Clusters of Galaxies at High Redshift: The LMT/GTM Perspective.
Abstract
The lack of reliable cluster samples at intermediate and high redshift has motivated many optical/infrared and X-ray cluster searches. The motivation of such searches is well justified: the abundance of massive () collapsed regions gives a direct constraint on . Alternatively, the Sunyaev-Zeldovich effect (SZE) offers a robust method for the detection of clusters which is, almost, independent of redshift. In this paper we comment on the possibility of mapping the SZE at high resolution in the millimeter regime using the Large Millimeter Telescope/Gran Telescopio Milimétrico (LMT/GTM) and the bolometer array BOLOCAM. The construction of the LMT/GTM facility is underway atop Cerro La Negra (latitude=; height=4600 m) in Mexico.
INAOE, Apdo. Postal 51 y 216, Tonantzintla, Puebla, PUE 72000, Mexico
1. Introduction
One of the running themes of this conference is the hidden Universe behind the Milky Way. We have seen throughout the conference how successful some searches have been at detecting clusters of galaxies in the Zone of Avoidance (e.g. Ebeling et al., in these proceedings). Tantamount to a Zone of Avoidance the Universe at high redshift remains unchartered. However, the millimeter regime offers a new window to explore the high- regions and uncover its large scale structure. The interaction of the cosmic microwave background (CMB) and the hot plasma trapped in clusters gives a distinctive signature in the resulting distorted spectrum that is very different from other CMB distortions. This uniqueness of the resulting spectrum gives a very efficient tool to detect clusters of galaxies at any redshift. The LMT/GTM project with the bolometer array camera BOLOCAM will capitalize on the ability to detect the SZE; hence, the possibility to conduct large surveys will be feasible. One mode will be to make pointed observations of nearby clusters of galaxies to make high resolution maps of the SZE, these observations will help to measure the baryonic content of clusters, H0, and their peculiar velocities through the detection kinematic SZE. In the second mode of observation, large regions of the sky will be mapped in three colors to search for clusters and superclusters at high-. The abundance of clusters of galaxies gives a direct constraint on . Below we outline the formalism for the treatment of the SZE effect (§2), review the LMT/GTM project (§3), and finally we describe how the LMT/GTM + BOLOCAM could be turned into a powerful machine for cluster cosmology (§4).
2. The Sunyaev-Zeldovich Effect
Clusters of galaxies are the largest bound structures in the Universe (e.g. Abell 3627). They are also reservoirs of large amounts of baryons and dark matter (). Trapped in the potential wells of clusters of galaxies lies a hot, tenuous and fully ionized gas () that is the major component of the intracluster medium (ICM) and the clusters’ baryonic content (e.g. Sarazin 1988). Shortly after the detection of the cosmic microwave background (CMB; ), Sunyaev & Zeldovich showed that the CMB photons and the electrons in the ICM can interact through the inverse Compton effect resulting in a scattering process. This process preserves the number of CMB photons, but gives a net energy gain to the CMB photons in the cluster’s line of sight. Thus the CMB is spectrally distorted. This process, also known as the thermal SZE, was originally proposed as a major source of mm radiation. However, only recently the advances in detector technology have allowed us to unambiguously measure this effect and use it as a cosmological tool (see reviews by Birkinshaw 1999 and Carlstrom et al. 1999).

The resulting spectrum of the CMB distortion due to inverse Compton scattering in the non-relativistic regime at the limit , where is the Planck constant, is the frequency, and is the Boltzmann constant, is given by the following equation (Zeldovich & Sunyaev 1969):
| (1) |
where the dimensionless frequency . The change of the CMB brightness , or temperature , is
| (2) | |||||
| (3) |
where . The amplitude of the effect is given by . This parameter is known as the Comptonization parameter and is defined as follows:
| (4) |
where is the rest mass of the electron, is the Thompson cross section, and is the electron number density that depends on physical conditions of the gas. In the case of the isothermal beta model (Cavaliere & Fusco-Femiano 1976) the electron temperature is a constant and the electron density follows a spherical distribution
| (5) |
where is the central number density, is the “core radius”, and is the square of the ratio of the average galaxy and gas particle speeds (Sarazin 1988). The condition of isothermallity seems to hold in real clusters inside of the virial radius (Irwin & Bregman 2000). Hence, the amplitude depends strongly on the cluster properties, i.e. its temperature and density structure; for massive clusters typical central values of are found. Nonetheless, the shape of the spectrum is independent of the physical conditions of the clusters, but vary with in the more complicated relativistic case (Sazonov & Sunyaev 1998). The critical points of are: a maximum at , i.e. maximum emission, a root at , i.e. a null, and a minimum at , and a minimum at , i.e. maximum decrement. Figure 1 shows the behavior of the thermal SZE for a massive cluster with .
The kinematic component of the SZE is due to the bulk motion of the cluster, and its ICM, relative to the CMB rest frame. The electrons will be scattered by the ICM electrons as above. However, if the cluster has a proper motion, the scattered photons will be Doppler shifted by an amount that depends on the angle of their scattering relative to the bulk velocity. This effect is equivalent to a change in the CMB temperature (). Its spectrum is given by:
| (6) |
The change in the CMB brightness due to the kinematic SZE is
| (7) | |||||
| (8) |
where is the component of the bulk velocity along the line of sight towards the observer and . The kinematic SZE is much smaller than the thermal SZE given the known properties of clusters. At long wavelengths the kinematic SZE gets swamped by the thermal SZE. However around mm the kinematic SZE reaches its maximum change in brightness while the thermal effect goes to zero. Figure 1 shows the kinematic SZE for a cluster with and a projected peculiar velocity . We remark, therefore, on the relevance of submm-mm observations for the detection of both components of the SZE.
3. The LMT/GTM Project
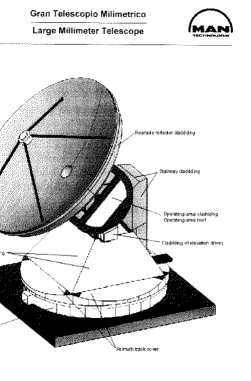
The LMT/GTM is a joint collaboration between the United States of America and Mexico. This is the largest scientific collaboration ever tried out between these two countries. The project contemplates the design, construction, and operation of a 50 m antenna that will be sensitive in the millimeter wavelength regime (). Figure 2 depicts an artist’s view of such an antenna. The main institutions that are involved in the project are the University of Massachusetts (UMass) and the Instituto Nacional de Astrofísica, Optica y Electrónica (INAOE). For further details visit the web site http://www.lmtgtm.org. First light is expected in the year 2002.
3.1. The Telescope Site
Millimeter astronomy poses more challenges than radio astronomy. The atmosphere is more opaque in the mm regime and is highly variable. An extensive search was conducted in many mountains in Mexico searching for places with high transparency and low water vapor column densities. The selected site was Cerro La Negra, a 4640 m volcanic mountain in the State of Puebla (lat. ). This site is one of the highest peaks in the Mexican Altiplano, located south of both Cofre de Perote and Pico de Orizaba. Cerro La Negra is an excellent site for mm observations. About of the time between October and May it has a with a 1st quartile . 850m observations will also be possible during the best conditions () when is . Additionally, during the summer months Cerro La Negra remains an excellent 3 mm site.
3.2. The Antenna
Very stringent antenna requirements need to be met to efficiently explore the mm window and take full advantage of Cerro La Negra conditions. They also pose a strong technological challenge because a 50 m aperture antenna for the millimeter has never been built before. For instance, the required pointing and tracking accuracy has to be arcsecs under wind conditions of m/s (50% of the time at Cerro La Negra). The demands on the quality of the surface are also high: for a projected initial rms surface accuracy , the resulting aperture efficiency is at mm. However the eventual goal is to reach that will give a good aperture efficiency and an optimal .
3.3. BOLOCAM
Analogous to the evolution in detector technology that was seen in the near infrared during last decade, arrays with increasing numbers of elements have made their debut into submm-mm astronomy. We can mention for example, the six element SuZIE (Holzapfel et al. 1997) at the Caltech Submillimeter Observatory (CSO), the 37/91 element SCUBA (Holland et al. 1999) at the James Clerk Maxwell Telescope (JCMT), and the six element Diabolo (Benoit et al. 2000) experiment at Institute de Radioastronomie Millimétrique (IRAM) 30 m, among others. BOLOCAM is designed around a monolithic wafer containing 151 silicon nitride micromesh bolometers arranged in a hexagonal pattern with a center-to-center spacing of 5 mm (Glenn et al. 1998). The detectors provide photon noise limited performance at mm at a base temperature of 30 mK. The feed horns and cavities are machined into single pieces of aluminum and invar. The camera design and optics are presented in Fig. 3. The first prototype was completed early this year and has been tested at CSO. The second one will be commissioned at the LMT/GTM. The LMT/GTM + BOLOCAM will have a field of view of 2′ and a resolution and an 111 Noise-Equivalent-Flux-Density at 1.4 mm (220 GHz), while at 1.1 mm (271 GHz) the resolution . The projected mapping speed at 1.1 mm will be about . BOLOCAM will have three bandpasses centered on ; however, for technical reasons only one passband can be used for each observing run (Glenn et al. 1998). The choice of the wavebands maximizes the ratio of the SZE thermal component signal to the combination of atmosphere and detector noise. The was chosen to detect the strongest component of the kinetic SZE while minimizing the component of the much stronger thermal SZE (see Holzapfel et al. 1997, for further details).

4. Search for Clusters of Galaxies at High Redshift
Clusters of galaxies are important probes of the large scale structure of the Universe. As they originate from the largest high density enhancements in the Cosmic Web (Bond, Kofman, and Pogosyan 1996, BKP): their abundance sets direct constraints on (e.g. Barbosa et al. 1996, Holder et al. 2000, Haiman et al. 2000) and the amplitude of the primordial fluctuations () (BKP, Bond et al. 1998, Haiman et al. 2000). Therefore, is very important from the observational point of view to arrive at the cleanest sample within any surveyed area. The thermal SZE, being independent of redshift and having a characteristic spectrum, provides an ideal tool for cluster detection.
Many cluster searches are currently underway either in the optical (e.g. Gladders & Yee 2000) or in the X-ray (e.g. Ebeling et al. 2000). Among many other biases that those searches might have, the most important one is that the detectability has a strong dependence with redshift () while the mass sensitivity of the thermal SZE has a weaker dependence with redshift. The flux density due to the thermal SZE is the integral of the spectral distortion integrated over the solid angle subtended by the cluster:
| (9) |
where the integral is over the cluster volume and is the angular diameter distance. Hence the flux depends on the total number of electrons at temperature and the angular distance only. Simple scaling laws show that , where and are the fluxes due to the SZE and X-ray respectively. Hence, the SZE probes deeper in redshift than the X-rays.

During routine operation LMT/GTM + BOLOCAM will be able to map massive clusters () at high with a resolution of at 1.1 mm in a few hours. Assuming that a massive cluster has kpc then (H km s-1,Mpc-1; ). Hence, it will be possible to map the entire cluster and sorrounding sky over an area of down to the sensitivity level in about 2 hrs. A 200 hrs survey, after commissioning, could cover a 10 region to a flux limit of mJy. Depending on the cosmology this survey could yield about 50-500 massive clusters (M ). In Fig. 4 remarkable differences in the cluster counts can be seen between different, standard, cosmological models at .Deviations from General Relativity can be noticed even at lower redshifts when models are normalized to CMB fluctuations (Gaztañaga & Lobo 2000). Observations at 1.1 mm and 2.4 mm could separate the fluctuations due to clusters from the other cosmological fluctuations. This way it would be possible to gather the largest reliable mass selected high- cluster samples.
Follow up observations with large infrared telescopes and the new X-ray missions will be needed to determine the mass and redshift distribution of the detected clusters. These observations will set strong constraints on the matter content of the Universe. At the same time we will also be exploring the large scale distribution of the Universe, gas distribution, and galaxy evolution at unprecedented high-.
Acknowledgments.
OLC is grateful to the organizing committee for support to participate in this very interesting conference. The research of OLC is supported by CONACyT (J-32098-E) and ANUIES-ECOS. OLC wishes to thank Gil Holder, Steve Myers and Chris Carilli for enlighting discussions. The hospitality of the PUC and Observatoire de Marseille is gratefully acknowledged.
References
Barbosa, D., Bartlett, J.G., Blanchard, A., & Oukbir, J. 1996, A&A, 314, 13
Benoit, A., Zagury, F., Coron, N., et al. 2000, A&AS, 141, 523
Birkinshaw, M. 1999, Physics Reports, 310, num. 2-3, 98
Bond, J.R., Kofman, L., & Pogosyan, D. 1996, Nature, 380, 603
Bond, J.R. et al. 1998, in Wide Field Surveys in Cosmology, eds. S. Colombi, Y. Mellier & B. Raban, (Gif-sur-Yvette: Editions Frontiers), 17
Carlstrom, J.E., Joy, M.K., Grego, L., et al. 1999, astro-ph/9905255
Cavaliere, A. & Fusco-Femiano, R. 1976, A&A, 49, 137
Ebeling, H., Edge A., & Henry, J.P. 2000, astro-ph/0001320
Gaztañaga, E., Lobo, A. 2000, astro-ph/0003129
Gladders M.D. & Yee H.K.C. 2000, astro-ph/0004092
Glenn, J., Bock, J.J., Chattopadhyay, G., et al. 1998, Proc. SPIE, 3357,326
Haiman, Z., Mohr, J.J., & Holder, G.P. 2000, astro-ph/0002336
Holder, G.P., Mohr, J.J., Carlstrom, J.E., et al. 2000, Apj in press.
Holland, W.S., Robson, E.I., Gear, W.K., et al. 1999, MNRAS, 303,659
Holzapfel, W. L., Wilbanks, T. M., Ade, P. A., et al. 1997, ApJ, 479, 17
Irwin, J.A. & Bregman, J. 2000, astro/ph0003123
Sarazin, C. L. 1988, X-ray Emission from Clusters of Galaxies. (Cambridge: Cambridge University Press)
Sazonov, S.Y. & Sunyaev, R.A. 1998, ApJ, 508, 1
Zeldovich, Ya. B. & Sunyaev, R.A. 1969, Ap&SS, 4, 301