The strength and width of Fe K lines in Seyferts and their correlations with the X-ray slope
Abstract
We study properties of Fe K lines of a large sample of Seyfert 1s observed by ASCA. Fits with power laws and Gaussian lines yield the average linewidth and equivalent width of keV and keV, respectively. Thus, the typical lines are weak and narrow. We then obtain the average line profile of all our spectra, and find it to consist of a narrow core and blue and red wings, with the red wing being much weaker than that of, e.g., MCG –6-30-15. We obtain three average spectra of Seyferts grouped according to the hardness, and find the equivalent width of the core (originating in a remote medium) to be eV in all three cases. The wings are well fitted by a broad line from a disc with strong relativistic effects. Its equivalent width correlates with the slope, increasing from eV for the hardest spectrum to eV for the softest one. The inner disc radius decreases correspondingly from to gravitational radii, and the fitted disc inclination is . The obtained correlation between the slope and the strength of the broad Fe K line is found to be consistent with the previously found correlation of the slope and Compton reflection.
keywords:
accretion, accretion discs – line: profiles – galaxies: active – galaxies: nuclei – galaxies: Seyfert – X-rays: galaxies.1 INTRODUCTION
There are two, related, main X-ray signatures of the presence of cold matter in accreting compact sources: Fe K flouorescence line and Compton reflection. The latter was discovered in Seyfert 1s by Ginga (Pounds et al. 1990), and the average solid angle, , subtended by the reflecting medium was found to be (Nandra & Pounds 1994). The former has been observed in most detail so far by ASCA, for which observations of Seyfert 1s yielded typical Fe K equivalent width, , of –300 eV (Nandra et al. 1997, hereafter N97).
There is a clear discrepancy between these two results if the line is supposed to come from the same medium as the Compton-reflecting continuum. Namely, the line is formed following about a half of ionizations of the innermost electron shell of an Fe atom by photons above the K edge (at 7.1 keV for neutral iron) incident on the reflecting medium. This gives a relationship between and , which, for the average photon index of Seyfert 1s of (Nandra & Pounds 1994) and the viewing angle of (N97) gives –130) eV, where the uncertainty of the coefficient is the result of the uncertain Fe K cross section (Życki & Czerny 1994; George & Fabian 1991). Thus, the measured reflection implies the of only 50–70 eV on average, much lower than that measured by N97.
A possible resolution of this dilemma is to postulate that the bulk of the line comes from a Thomson-thin molecular torus surrounding the X-ray source, which, for some geometries, can yield the required without the reflection signatures (e.g. Woźniak et al. 1998). However, the lines observed by ASCA are clearly broad (e.g., N97), which rules out their origin mostly from the torus. The most straightforward explanation of their width is a relativistic motion, presumably of an optically-thick accretion disc in the gravitational potential of the nucleus (Fabian et al. 1989; Tanaka et al. 1995), in which case the presence of reflection is unavoidable. Then, models in which the line strength is increased due to relativistic effects (Martocchia & Matt 1996; Reynolds & Fabian 1997) would imply a corresponding enhancement of the reflection, which is not seen. This problem has apparently motivated some authors to distinguish “reflection models” from disc models without reflection. This is clearly unphysical, since, as noted by N97, “simple atomic physics dictates that the fluorescence must be accompanied by a Compton-scattered continuum”.
Moreover, the strength of Compton reflection in Seyfert 1s has been found to correlate strongly with (Zdziarski, Lubiński & Smith 1999, hereafter ZLS99). This correlation has also been found in black-hole binaries, in which case , as expected (Gilfanov, Churazov & Revnivtsev 1999, 2001). On the other hand, no such proportionality has been claimed yet for Seyfert 1s, and some examples to the contrary have been seen (e.g. Chiang et al. 2000).
Here we re-examine the issue of the strength and width of the Fe K line in Seyferts and their correlation with the spectral index. We use the large available database of ASCA, which, at this time, contains about 3 times as many observations as those available at the time of the study of N97. Moreover, we make use of the ASCA calibration improved significantly over the years of the mission.
2 SIMPLE FITS TO INDIVIDUAL SPECTRA
Our Seyfert sample consists of the objects studied by N97 and by ZLS99 (except for NGC 4151 and NGC 6814, see below). These objects are mostly classified as radio-quiet Seyfert 1s or narrow emission-line galaxies. The latter are Seyferts intermediate between type 1 and 2 showing moderate X-ray absorption (e.g. Smith & Done 1996). We include 3C 120, as it is present in the sample of N97. Although it is radio-loud, its Fe K and reflection spectral features are similar to those of radio-quiet Seyferts (Zdziarski & Grandi 2001). We exclude NGC 4151, the X-ray brightest radio-quiet Seyfert, since it is characterized by an absorbing column, cm-2, much larger than those of other objects in the sample. We exclude NGC 6814 due to the poor statistics of its spectrum.
We use ASCA spectra extracted from the public Tartarus 1 database. After excluding 3 short observations with poor statistics, we have 71 spectra of 25 AGNs. We distinguish between 16 AGNs in the sample of N97: 3C 120, Fairall 9, IC 4329A, MCG –2-58-22, MCG –6-30-15, Mrk 335, Mrk 509, Mrk 766, Mrk 841, NGC 3227, NGC 3516, NGC 3783, NGC 4051, NGC 5548, NGC 7213, and NGC 7469 (58 observations); and 9 AGNs present only in the sample of ZLS99: AKN 120, MCG –5-23-16, NGC 2110, NGC 2992, NGC 4593, NGC 526A, NGC 5506, NGC 7172, and NGC 7314 (13 observations). The log of observations and results of individual fits are given in Lubiński, Zdziarski & Madejski (2001, hereafter LZM01).
For fitting the Fe K lines (using xspec, Arnaud 1996), we use only the 3–10 keV continuum in order to avoid the complexities of possible soft X-ray excesses and warm absorbers (as in N97). In those fits, we use the Galactic as well as at the redshift of the source (assuming a neutral medium with the abundances of Anders & Ebihara 1982) determined by modeling the entire ASCA spectrum by either a power law or a broken power law. However, the effect of on the 3–10 keV spectrum is minor. We then model the spectrum as a power law and a sum of 3 Gaussian lines. The first component is the main Fe K line, and the second is due to its reflection from the cold medium (George & Fabian 1991), with the energy and the width of 0.975 and the intensity of 0.12 of the main line. The third component represents combined Fe K and Ni K emission, with the energy and the width of 1.125 and the intensity of 0.18 of the main line. Due to limited statistics at keV, individual ASCA spectra do not allow us to fit the Compton reflection continuum, which we thus neglect at this stage. We fit the same model to the SIS0, SIS1, GIS2 and GIS3 data allowing for free relative normalization with respect to SIS0.
Fig. 1 shows the resulting parameters of the main Fe K line. We see that the lines are relatively weak and narrow, and peak close to 6.4 keV. The values of the weighted mean and its error are keV, keV, keV, and . We see no statistically significant differences between the AGN sample of N97 and the objects outside it.
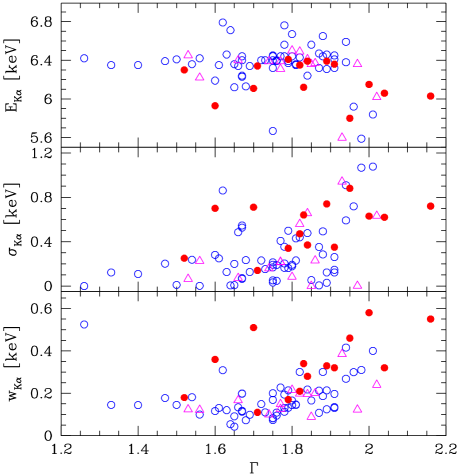
For comparison, Fig. 1 also shows results of analogous fits of N97, where the weighted means are keV, keV, and keV for the objects included here. We note that N97 used a single Gaussian in their fits, which, as we have checked, would have increased our values of and by about 20 per cent. We note that N97 obtained about twice that found here as well as their measurements show a scatter significantly larger than in our case, with a relatively large number of objects with and much above their respective mean values. The fact that the extreme data points have a little effect on the weighted means is due to the large errors for most objects with very broad lines in their sample.
The above differences are fully explained by improvements in the ASCA calibration since the analysis of N97, who used the calibration files of 1995. An illustrative example is that of 3C 120. N97 obtained keV and keV (their error ranges are for ). Then, Woźniak et al. (1998) obtained keV (hereafter the errors are for 90 per cent confidence, i.e., ) and keV, i.e., a line times weaker and narrower, using the same data and model as N97, but with the calibration of 1997. The weakness of the line has then been confirmed by broad-band observations by BeppoSAX and RXTE, which yielded keV, keV, and keV, keV, respectively (Zdziarski & Grandi 2001).
3 THE AVERAGE SPECTRUM
Due to the limited effective area of ASCA, the detailed shape of individual spectra of Seyferts is not well constrained, but the average form can be measured in much more detail. For that, we use only data from the SIS detectors, as they have a much better energy resolution than the GIS ones. We follow here the method of N97. We fit the SIS data of a single observation by a power law in the ranges of 3–4.5 keV and 7.5–10 keV, i.e., excluding the Fe K line region, obtain the ratio of the observed counts to those predicted by the power-law model, and then transform it to the rest frame.
Then, we obtain a weighted average of the ratios. A contribution to a bin in the average ratio is weighted by both its inverse-square error and the ratio of the length of the part of the input bin contributing to an output bin with respect to the length of the output bin. The latter expresses conservation of photons between the originally-binned spectrum and that with arbitrarily chosen final bins.
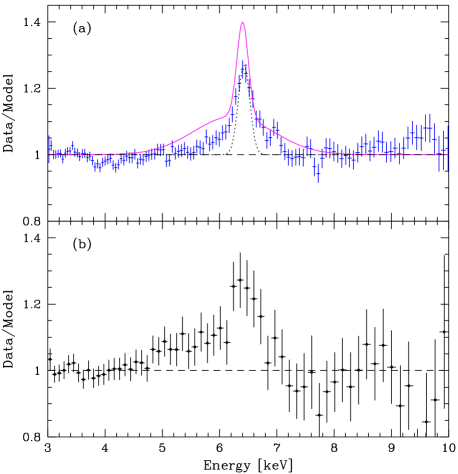
Fig. 2(a) shows the obtained average for all observations of the 16 AGNs of N97 (to improve statistics, we use all available observations of those AGNs). Note that our method yields the average line profile in the SIS count space (as in N97), and thus an intrinsically narrow line would have a keV (corresponding to the SIS resolution averaged over time), as shown by the dotted curve on Fig. 2(a). The observed profile clearly contains such a narrow core and relatively weak red and blue wings. Both the red wing and the core are weaker than those obtained by N97 (solid curve, obtained by scanning fig. 4a and normalizing using fig. 5a in N97). We find that adding the 13 observations of the 9 objects not present in the sample of N97 has virtually no effect on the obtained profile.
We have found that the main factor explaining the above discrepancy
appears to be
the change of the ASCA calibration in 1996 (see LZM01 for details). We have
obtained this result by dividing the line profile of N97 by the
curve111from http://heasarc.gsfc.nasa.gov/docs/asca/
xrtnewresponseannounce/announce.html by which the effective area
of ASCA was corrected in 1996. After a renormalization, the obtained shape
is close to our average profile. A further factor is the inclusion of NGC 4151
in the profile of N97. The brightness of this object causes it to weigh heavily
in the average, and to increase noticeably the red wing of the line. However,
the very strong red wing of the line in this object obtained with fits with a
single absorber may be spurious (Zdziarski, Johnson & Magdziarz 1996).
We also find that limiting the sample to the 19 early
observations of the 16 AGNs included in N97 has virtually no effect on the
strength of the red wing. On the other hand, the core of that spectrum is
narrower, which is due to the time-dependence of the ASCA resolution.
We have extensively tested our results. First, we obtain a good agreement with results for the objects with confirmed broad lines with red wings. Fig. 2(b) shows our obtained average profile of MCG –6-30-15, which does have a very pronounced red wing, in agreement with previous results (Tanaka et al. 1995; Iwasawa et al. 1996). Then, we have have reproduced very closely the results of Nandra et al. (1999) for another object with a very strong and broad line, NGC 3516. Also, we have studied the subsamples of SIS0 and SIS1 separately, and also the subsamples of the observations made before and after the end of 1995. We have found no significant differences between various subsamples, except between early and late ASCA spectra, with the latter spectrum being broader due to the well-known effect of degradation of the SIS resolution with time. Finally, we have studied 10 observations for which we also used the spectra from the Tartarus 2 database. We have found only very tiny differences in individual fits. Their average profiles obtained the 2 databases show very good agreement as well as neither shows a strong red wing, in agreement with Fig. 2(a). Also, we have found no significant differences between either Tartarus spectra and those reduced independently (LZM01).
We then tested for the effects of various methods of averaging. When we use arithmetic average instead of the (statistically) weighted one, we find the peak of the line in the ratio plot increases, due to the contribution of objects with a strong line measured with large errors. Since the dispersion in our sample is dominated by statistical errors (over the intrinsic dispersion), and the sample is not dominated by a few bright objects with small statistical errors, the weighted average gives a much better representation of the average properties. Still, even our unweighted line profile shows no strong red wing (see LZM01 for details). On the other hand, neglecting the weights due to different sizes of the bins has an effect of increasing the scatter in the ratios.
We note that our results are not unexpected. There are relatively few Seyferts with a confirmed strong red wing, the best cases being MCG –6-30-15 (Iwasawa et al. 1996) and NGC 3516 (Nandra et al. 1999). In detailed studies of IC 4329A and NGC 5548, the lines were found to be weak and narrow, consistent with the bulk of line formation relatively far away from the central black hole (Done, Madejski & Życki 2000; Chiang et al. 2000). These findings are clearly incompatible with the average line profile of Seyfert 1s being virtually the same as that of MCG –6-30-15 (N97).
4 PHYSICAL INTERPRETATION
Since the observed range of values of has to have a physical origin, e.g. due to varying cooling rate of thermally-Comptonizing plasma (e.g. ZLS99), we have ranked the spectra according to the spectral slope obtained in fits excluding the line region and divided into 3 subsamples with decreasing hardness (containing 22, 22 and 27 spectra, respectively). We then obtain 3 data-to-model ratios using the same method as above. An immediately visible effect is that both the line strength and the strength of the red wing increase with increasing softness of the continuum. To enable spectral fitting, we multiply the ratios by the respective average power law. Note that these spectra no longer use the ASCA response, and any intrinsically sharp feature is now broadened by the ASCA resolution.
We have first found that the line profiles clearly contain 2 components, broad and narrow (similarly to the finding of Weaver et al. 1997 for MCG –5-23-16). The narrow line is well-modeled by a Gaussian with keV, corresponding to the time-averaged ASCA resolution. Thus, the intrinsic width of the narrow line is less than 0.1 keV. This indicates its origin at radii (where is the black hole mass). The broad component originates, most likely, in an accretion disc. It is modeled as a line from a disc in the Schwarzschild metric (Fabian et al. 1989) with the inner radius, (; in units of ) and the inclination, , as free parameters. The outer radius is fixed at , and we assume the line emissivity equal to the emissivity of a geometrically-thin disc. Since the fluorescent disc emission has to be accompanied by Compton reflection, we add it to the model (using Green’s functions of Magdziarz & Zdziarski 1995), also taking also into account its relativistic broadening treated in the same way as for the line (model refsch in xspec v. 11). The incident continuum is a power law e-folded with an energy of 300 keV (e.g. Gondek et al. 1996). We tie the reflection strength, , to the equivalent width of the broad line, (Życki, Done & Smith 1998; Done et al. 2000), using results of George & Fabian (1991). Specifically, for the obtained 3 best-fit values of and (see Table 1) we assume , 135 and 120 eV, respectively (thus, given in Table 1 is not an independent parameter). To take into account calibration uncertainty, we allow the local-frame line energy to be in the 6.35–6.45 keV range. Furthermore, since a structure around 7 keV is clearly seen in the average line profile (Fig. 2), we include Fe K and Ni K lines at 7.06 keV, 7.46 keV with the photon flux equal to 0.12, 0.06, respectively, of the Fe line, for both the broad and narrow component. We keep at the best-fitting value while determining the uncertainties of other parameters.
| Spectrum | [deg] | [eV] | [eV] | ||||
|---|---|---|---|---|---|---|---|
| a | 61.0/115 | ||||||
| b | 85.7/115 | ||||||
| c | 79.6/115 |
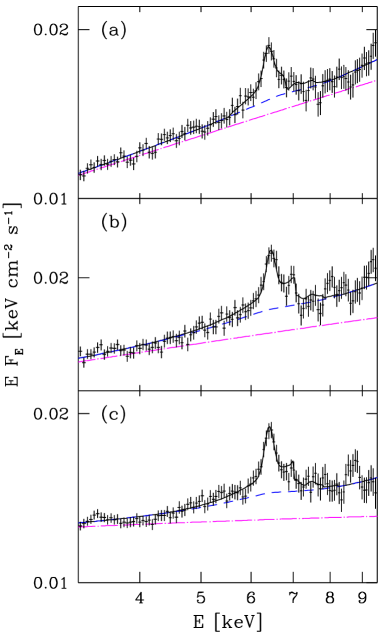
The resulting spectral fits are shown in Fig. 3, and their parameters are given in Table 1. We see that while and are clearly correlated, is practically constant (keeping at the best-fit of the middle spectrum results in only of for the other 2 spectra). Also, the inner radius of the reflecting disc is much lower for the 2 softer spectra than for the hardest one. This is consistent with a picture of cooling of the X-ray emitting plasma by blackbody disc photons, with the same disc producing the broad Fe K line and the Compton-reflected continuum (e.g. ZLS99). Then, the lower , the softer the incident continuum (due to a decrease of the plasma temperature caused by the increased cooling), and the more reflection and broad-line emission. The fact that for our hardest spectrum is consistent with either truncation of the cold disc and a hot inner disc (Narayan & Yi 1995), or, possibly, a complete ionization of the inner part of the disc (Matt, Fabian & Ross 1993) or a mildly relativistic outflow away from the disc (Beloborodov 1999). The reflection region appears to be neutral as the best fit of its ionization parameter is null in all three cases. Inclination is consistent with being the same for all three spectra (as expected for independent of ), .
We have tested whether the obtained - correlation could be spurious. For that purpose, we have generated simulated spectra with a distribution of similar to that in our sample (see Fig. 1), the 3–10 keV flux equal to that in our averages, and a constant of a relativistic line. Then, we obtained average spectra in 3 subsamples with the same ranges of as in our actual samples. Fits to the averages of the 3 simulated spectra reproduced the assumed within 7% with no systematic trend. This shows that the observed correlation is not spurious.
We have then checked that adding an unsmeared Compton-reflection component tied to the narrow line leads to a strong worsening of the fit, which implies that the remote medium is, on average, Thomson-thin (and thus does not produce noticeable Compton reflection, e.g. Woźniak et al. 1998). The narrow line is present at a very high statistical significance, in all 3 cases.
We find that the - correlation seen in Table 1 is approximately consistent with that found in the data from Ginga (ZLS99) and BeppoSAX (Matt 2001), see Fig. 4. The shown best-fit Ginga points have been obtained here by refitting the data of ZLS99 with our present physical model (at and as in Table 1). Some offsets in the values of and between the Ginga, BeppoSAX and ASCA results are apparently due to calibration differences between the instruments. Still, we see that our present - correlation (based on the Fe K line) is in good agreement with those driven by the strength of the Compton reflection.

We note that Nandra et al. (2000) found that some systematic effects (background undersubtraction with a specific power-law dependence on energy and time lag of reflection) may lead to an apparent correlation between and in a single AGN with constant . However, time-lag effects average out in a sample of AGNs. Then, it is highly unlikely that background-subtraction effects are responsible for the correlations in the AGN samples observed by all Ginga, BeppoSAX and RXTE (and now confirmed by ASCA). They also found that statistical effects alone cannot explain the correlation observed even in a single object (NGC 7469), in full agreement with the analysis of ZLS99. On the other hand, Vaughan & Edelson (2001) have shown that an apparent - correlation will be seen in multiple observations of a single AGN with these quantities being constant. However, this is just equivalent to showing an error contour for measurements of the 2 quantities, which is elongated and skewed (ZLS99). This effect was taken into account by ZLS99, who computed the probability of the correlation beyond that due to that error contour appearing by chance to be in the Ginga sample. Such a low probability is due most of the error contours in ZLS99 being much smaller than the extent of the correlation. This is in contrast to the case considered by Vaughan & Edelson (2001), in which the extent of their apparent correlation is equal to the length of the measurement error contour.
Note that a very strong - correlation is also found in accreting stellar-mass black holes. In that case also correlates with and with the characteristic frequencies in the power spectrum (Gilfanov et al. 1999, 2001).
As discussed above, the - correlation appears, most likely, due to feedback between hot and cold media. Its presence is of major importance as a diagnostic of geometry and physical conditions in accretion flows (e.g. Beloborodov 2001). One of its consequences is ruling out a geometry with static active regions above a disc, as it predicts an anticorrelation between and (Malzac, Beloborodov & Poutanen 2001).
5 CONCLUSIONS
We have studied Fe K line properties of a large sample of Seyfert 1s observed by ASCA. Gaussian fits yield keV and keV, i.e., relatively weak and narrow lines. The average line profile of our sample consists of a narrow core and red and blue wings. The average red wing is much weaker than that of the Seyferts with broadest K lines, e.g. MCG –6-30-15.
Since the power-law slope of Seyferts in our sample covers a large range, we have divided our sample into 3 groups, which average spectra we fitted separately. All 3 spectra contain a narrow core with eV, which we interpret as originating from a Thomson-thin remote medium. In addition, the data show a broad feature, well-fitted by a line from a relativistic disc. The equivalent width of the broad line increases from eV to eV with increasing . The fitted inner disc radius decreases from for to at –2. The inclination is consistent with being on average. The correlation of with corresponds to a correlation between the strength of Compton reflection and , confirming previous results of ZLS99 and Matt (2001).
Our results resolve the long-standing discrepancy (see §1) between the properties of the Fe K lines and those of Compton reflection in Seyfert galaxies.
ACKNOWLEDGMENTS
We thank M. Gierliński for help with xspec, C. Done, K. Leighly and G. Madejski for valuable discussions, and the anonymous referee for careful checking the results of this paper. This research has been supported in part by a grant from the Foundation for Polish Science and KBN grants 2P03D00614 and 2P03C00619p0(1,2), and it has made use of data obtained through the High Energy Astrophysics Science Archive Research Center Online Service, provided by NASA/GSFC.
References
- [] Anders E., Ebihara M., 1982, Geochim. Cosmochim. Acta, 46, 2363
- [] Arnaud K. A., 1996, in Jacoby G. H., Barnes J., eds., Astronomical Data Analysis Software and Systems V, ASP Conf. Series Vol. 101, San Francisco, p. 17
- [] Beloborodov A. M., 1999, ApJ, 510, L123
- [] Beloborodov A. M., 2001, Adv. Sp. Res., in press (astro-ph/0103320)
- [] Chiang J., Reynolds C. S., Blaes O. M., Nowak M. A., Murray N., Madejski G. M., Marshall H. L., Magdziarz P., 2000, ApJ, 528, 292
- [] Done C., Madejski G. M., Życki P. T., 2000, ApJ, 536, 213
- [] Fabian A. C., Rees M. J., Stella L., White N. E., 1989, MNRAS, 238, 729
- [] George I. M., Fabian A. C., 1991, MNRAS, 249, 352
- [] Gilfanov M., Churazov E., Revnivtsev M., 1999, A&A, 352, 182
- [] Gilfanov M., Churazov E., Revnivtsev M., 2001, in Proc. 5th CAS/MPG Workshop on High Energy Astrophysics, in press (astro-ph/0002415)
- [] Gondek D., Zdziarski A. A., Johnson W. N., George I. M., McNaron-Brown K., Magdziarz P., Smith D., Gruber D. E., 1996, MNRAS, 282, 646
- [] Iwasawa K., et al., 1996, MNRAS, 282, 1038
- [] Magdziarz P., Zdziarski A. A., 1995, MNRAS, 273, 837
- [] Malzac J., Beloborodov A. M., Poutanen J., 2001, MNRAS, in press
- [] Martocchia A., Matt G., 1996, MNRAS, 282, L53
- [] Matt G., 2001, Astroph. Lett. & Comm., in press (astro-ph/0007105)
- [] Matt G., Fabian A. C., Ross R. R., 1993, MNRAS, 262, 179
- [] Nandra K., Pounds K. A., 1994, MNRAS, 268, 405
- [] Nandra K., George I. M., Mushotzky R. F., Turner T. J., Yaqoob T., 1997, ApJ, 477, 602 (N97)
- [] Nandra K., George I. M., Mushotzky R. F., Turner T. J., Yaqoob T., 1999, ApJ, 523, L17
- [] Nandra K., Le T., George I. M., Edelson R. A., Mushotzky R. F., Peterson B. M., Turner T. J., 2000, ApJ, 544, 734
- [] Narayan R., Yi I., 1995, ApJ, 452, 710
- [] Pounds K. A., Nandra K., Stewart G. G., George I. M., Fabian A. C., 1990, Nat, 344, 132
- [] Reynolds C. S., Fabian A. C., 1997, MNRAS, 290, L1
- [] Smith D. A., Done C., 1996, MNRAS, 280, 355
- [] Tanaka Y., et al., 1995, Nat, 375, 659
- [] Vaughan S., Edelson R., 2001, ApJ, 548, 694
- [] Weaver K. A., Yaqoob Y., Mushotzky R. F., Nousek J., Hayashi I., Koyama K., 1997, ApJ, 475, 675
- [] Woźniak P. R., Zdziarski A. A., Smith D., Madejski G. M., Johnson W. N., 1998, MNRAS, 299, 449
- [] Zdziarski A. A., Grandi P., 2001, ApJ, 551, 186
- [] Zdziarski A. A., Johnson W. N., Magdziarz P., 1996, MNRAS, 283, 193
- [] Zdziarski, A. A., Lubiński, P., & Smith, D. A. 1999, MNRAS, 303, L11 (ZLS99)
- [] Życki P. T., Czerny B. 1994, MNRAS, 266, 653
- [] Życki P.T., Done C., Smith D.A., 1998, ApJ, 496, L25