Massive star populations and the IMF in metal-rich starbursts ††thanks: Based on observations at Kitt Peak National Observatory, National Optical Astronomical Observatories, operated by the Association of Universities for Research in Astronomy, Inc., under contract with the Nationsal Science Foundation
Abstract
We present new spectroscopic observations of Mkn 309, a starburst galaxy with one of the largest WR populations known. A highly super solar metallicity of 12 + (O/H) 9.3–9.4 is derived. Using additional objects from Guseva et al. (2000) we analyse a sample of five metal-rich ([O/H] 0) WR galaxies with the main goal of constraining the basic properties of the massive star populations (IMF slope, ) and the star formation history (age, burst duration) of these objects by quantitative comparisons with evolutionary synthesis models. The following main results are obtained:
-
•
The observations are well explained by extended bursts of star formation with durations 4–10 Myr seen at ages of 7–15 Myr or a superposition of several bursts with age differences of 4–10 Myr including a young ( 5 Myr) burst. This naturally explains both the observed WR populations (including WN and WC stars) and the presence of red supergiants. The burst durations, somewhat longer compared to those derived in other WR galaxies using the same models (Schaerer et al. 1999a), are plausible in view of the physical sizes of the observed regions and the nature and morphology of our objects (nuclear starbursts), and pose no fundamental physical problem.
-
•
The SEDs in the optical range are very well reproduced for all objects, provided the stellar light suffers from a smaller extinction than that of the gas (derived from the Balmer decrement). This confirms earlier findings from studies combining UV–optical data of other starburst galaxies.
-
•
All the considered observational constraints are compatible with a Salpeter IMF extending to masses 40 . Adopting a conservative approach we derive a lower limit of 30 for the Salpeter IMF. From more realistic assumptions on the metallicity and SF history we favour a lower limit 30–40 , which is also in agreement with H equivalent width measurements of metal-rich H ii regions in spiral galaxies indicating an upper mass cut-off of at least 35 – 50 . Steep IMF slopes () are very unlikely.
The uncertainties of our results are discussed. We compare our findings to other work on massive star populations and the IMF in similar environments. We stress the importance of direct analysis of stellar populations compared to other indirect methods based on properties of ionized gas to constrain the IMF in metal-rich starbursts.
Key Words.:
Galaxies: abundances – Galaxies: evolution – Galaxies: ISM – Galaxies: starburst – Galaxies: stellar content – Stars: luminosity function, mass function – Stars: Wolf-Rayet1 Introduction
Massive galaxies, the central regions of galaxies, AGNs, and related objects are generally expected to harbour metal-rich gas and stars, as indicated by numerous observations (e.g. Hamann 1997, Henry & Worthey 1999).
For the understanding of actively star-forming galaxies (also loosely denoted as “starbursts” here) knowledge about massive stars — their evolution, as well as radiative, mechanical, and chemical feedback — and their relative number compared to lower mass stars is of prime importance. However, the properties and evolution of individual metal-rich high mass stars, massive star populations, and their initial mass function (IMF) in metal-rich environments are still poorly known.
Although of great interest to a number of astrophysical problems few quantitative studies of individual massive stars at high metallicities exist so far. See e.g. McCarthy et al. (1997) and Monteverde et al. (1997) for work on M31 and M33 stars, Najarro et al. (1997) and Figer et al. (1999) for Galactic Center stars, and Maeder & Meynet (1994) for the use of WR/O star statistics. Studies of integrated stellar cluster spectra, such as the pioneering work of Bica, Alloin and coworkers (Bica & Alloin 1986), have provided an extremely useful base for the understanding of stellar populations in more complex objects. However, templates of both young and metal-rich clusters (metallicities above 1.25 solar) are missing. This clearly shows that studies of massive stars, both individual stars or integrated populations, with super-solar metallicity remain largely unexplored territory. While in principle nebular lines can be used through photoionization modeling to constrain the stellar content of H ii regions (e.g. García-Vargas et al. 1995, 1997, Stasińska & Leitherer 1996) the inherent difficulties of optical studies at high metallicities (e.g. strong sensitivity of lines to unknown electron temperature) render this approach rather uncertain. Here, we preferentially rely on the analysis of direct stellar features.
Of particular interest for studies of metal-rich starbursts is the upper part of the IMF. More precisely, important questions are what is the slope of the IMF and what are the most massive stars formed in such environments? From work undertaken in recent years the picture of a “universal” IMF with a slope close to the Salpeter value for the mass range of interest here ( ) and the existence of massive stars ( 60–100 ) seems to emerge (e.g. Larson 1998, references in Gilmore & Howell 1998, but also Scalo 1998). So far these results are found to hold for a diversity of objects and metallicities from solar to very metal poor environments (SMC, blue compact dwarf galaxies with 12 + (O/H) 7.2). Very little is, however, known about the IMF at high metallicities.
Indirect indications for a possible systematic difference of the IMF come e.g. from studies on IR-luminous starburst galaxies, where generally a soft radiation field is observed, which, among other explanations, can be interpreted as a deficit of massive stars (cf. Goldader et al. 1997, Luhman et al. 1998). Given the high luminosity and intense star-formation in these objects, the metallicity is likely high and could be responsible for the IMF change. Most recently Bresolin et al. (1999) claim a low value of the upper mass cut-off ( 25 ) at super-solar metallicity from considerations of the nebular properties of giant extragalactic H ii regions. Although not yet well established (cf. e.g. the recent modeling of ISO observations by Thornley et al. 2000), these results, if true, have many implications. It is important, however, to note that the only indications for a low value of in these objects come from the properties of the gas which is ionized by massive stars. Many causes (dust absorption, nebular geometry, uncertainties in stellar atmosphere models etc.) could be responsible for a misinterpretation in terms of . A direct probe of the stellar content of metal-rich objects is needed. A first step in this direction is done in the present work.
The so-called Wolf-Rayet (WR) galaxies (cf. Conti 1991, Schaerer et al. 1999b), where broad emission lines from WR stars observed in the integrated spectra indicate the presence of massive stars ( 25 ), provide an extremely interesting opportunity to constrain evolutionary models for massive stars in different environments and to probe the upper part of the IMF. These issues have first been explored in the important studies of Kunth & Joubert (1985), Arnault et al. (1989) and Vacca & Conti (1992). Recent progress comes from new high S/N observations (e.g. Schaerer et al. 1999a – hereafter SCK99, Guseva et al. 2000 – hereafter GIT00) and the use of improved evolutionary synthesis models (Cerviño & Mas-Hesse 1994, Meynet 1995, Schaerer 1996, Schaerer & Vacca 1998, hereafter SV98). Reviews on the issues addressed in studies of WR galaxies can be found for example in the volume of van der Hucht et al. (1999) and in Schaerer (1999ab).
The sample of GIT00 includes also some metal-rich WR galaxies. In the present work we extend this sample and present a detailed analysis of five objects with super solar metallicity. Our main goal is to determine the basic properties of the massive star populations (IMF slope, ) and the star formation history (age, burst duration) in these metal-rich starbursts.
The structure of this paper is as follows: The observational data is described in Sect. 2. Physical conditions and abundances are derived in Sect. 3. The stellar content of our objects is analysed in Sect. 4. In Sect. 5 we derive constraints on the star formation properties and massive star populations from comparisons with evolutionary synthesis models. The interpretation in terms of the IMF is discussed in Sect. 6. Our main results are summarised in Sect. 7.
2 Observational data
| Galaxy | (1950) | (1950) | Type | |
|---|---|---|---|---|
| Mkn 589 | 02 11 08.7 | +03 52 08 | 14.51 | S? |
| Mkn 1199 | 07 20 28.5 | +33 32 24 | 13.7 | Sc |
| Mkn 710 | 09 52 10.2 | +09 30 32 | 13.04 | SB(rs)ab Sbrst |
| Mkn 1259 | 10 36 03.0 | –06 54 37 | 13.5 | S0 pec? |
| Mkn 309 | 22 50 10.0 | +24 27 52 | 15.44 | Sa Sy2 |
The observational data used in the present paper consist of four high metallicity ( solar and above) objects taken from the large sample of Wolf-Rayet galaxies of GIT00 (Mkn 589, Mkn 710NGC 3049, Mkn 1199, Mkn 1259) , supplemented by the data on NGC 3049 by Schaerer et al. (1999a), and new observations of Mkn 309. The general properties of the objects are given in Table 1. Distances and derived metallicities are included in Table 6 below. Except for Mkn 710, a bright H ii region in a barred spiral galaxy, the star forming regions discusses here are fairly compact central regions of galaxies (“nuclear starbursts”). Note that this is in contrast with the remaining WR galaxies of GIT00, comprising mostly metal-poor blue compact dwarf galaxies.

Spectroscopic observations of Mkn 309 were made with the Kitt Peak 4m Mayall telescope during a clear night on 18 June 1999 with the Ritchey-Chrétien RC2 spectrograph used in conjunction with the T2KB 20482048 CCD detector. We use a 2″300″ slit with the KPC–10A grating (316 lines mm-1) in first order, with a GG 375 order separation filter. This filter cuts off all second-order contamination for wavelengths blueward of 7200Å which is the wavelength region of interest here. The above instrumental set-up gave a spatial scale along the slit of 0.69 arcsec pixel-1, a scale perpendicular to the slit of 2.7Å pixel-1, a spectral range of 3500–7300Å and a spectral resolution of 6Å. The seeing was 1″. The total exposure time was 60 minutes and was broken up into 2 subexposures. The slit was oriented close to the parallactic angle, so that no correction for atmospheric differential refraction was necessary.
The Kitt Peak IRS spectroscopic standard star Feige 34 was observed for flux calibration with a 6″ wide slit. Spectra of He–Ne–Ar comparison arcs were obtained before and after each observation to calibrate the wavelength scale.
The two-dimensional spectra were bias subtracted and flat-field corrected. We then use the IRAF222IRAF is distributed by National Optical Astronomical Observatories, which is operated by the Association of Universities for Research in Astronomy, Inc., under cooperative agreement with the National Science Foundation. software to perform wavelength calibration, correction for distortion and tilt for each frame and extraction of one-dimensional spectra. The extracted spectra from each frame were coadded and cosmic rays were removed manually. The sensitivity curve was obtained from the observed spectral energy distribution (SED) of Feige 34 with a high-order polynomial. The intensity distribution of the continuum and of the emission lines along the slit shows a strong maximum with FWHM = 2″. We extract a one-dimensional spectrum of the brightest part of the galaxy in a 2″42 aperture. The signal-to-noise ratio for this spectrum is 100. The spectrum for Mkn 309, uncorrected for extinction, is shown in Figure 1.
We detect several Wolf-Rayet emission lines. The He i lines in the blue part of the spectrum are in absorption suggesting the presence of early B stars in the star-forming region. We also mark several absorption features of heavy elements, such as Ca ii 3933, Na i 5889, 5895, the TiO band at 6250 and the Fe i + Ba ii + Ca i 6495 blend. Although weak, the latter feature is not an artifact. It is seen in the spectra of all studied galaxies (Fig. 2) because of their very high signal-to-noise ratio. Although Bica & Alloin (1986) note that the latter blend (their window #59) includes also CN and TiO features, the narrowness of the blend suggests that contribution of molecular bands is rather small.
The observed line intensities have been corrected for interstellar extinction using the reddening law by Whitford (1958). We decided not to correct line intensities separately for the Galactic and intrinsic extinctions, partly, because of the large discrepancy between the determinations of = 0.649 by Schlegel et al. (1998) and = 0.190 by Burstein & Heiles (1982). Instead we derive extinction directly from the observed hydrogen line intensities which have been also corrected for underlying stellar absorption, with the equivalent width for absorption hydrogen lines derived self-consistently together with the extinction coefficient from the observed intensities of all hydrogen lines. The redshift = 0.041740.00009 derived from the observed wavelengths of 16 emission lines is close to = 0.04215 in the NED. For the latter heliocentric redshift, 1″ = 817 pc, assuming = 75 km s-1 Mpc-1. We show the observed ()/(H) and extinction and absorption-corrected () / (H) line intensities for Mkn 309 in Table 2, along with the extinction coefficient and the equivalent width of the hydrogen absorption lines, the observed flux and equivalent width of the H emission line. The errors of the line intensities include the errors in the placement of the continuum and the errors introduced by Gaussian fitting of the line profiles. The indicated uncertainties represent formal errors. Note the small intensities of the [O i] and [S ii] emission lines suggesting that Mkn 309 is a starburst galaxy, contrary to its classification in the NED as Sy2 galaxy.
| Ion | ()/(H) | ()/(H) |
|---|---|---|
| 3727 [O ii] | 0.400.02 | 0.610.03 |
| 4101 H | 0.100.02 | 0.250.05 |
| 4340 H | 0.310.02 | 0.450.03 |
| 4363 [O iii] | 0.030.01 | 0.030.01 |
| 4861 H | 1.000.02 | 1.000.03 |
| 4959 [O iii] | 0.150.02 | 0.130.02 |
| 5007 [O iii] | 0.380.02 | 0.340.02 |
| 5056 Si ii | 0.050.02 | 0.040.02 |
| 5755 [N ii] | 0.050.01 | 0.030.01 |
| 5876 He i | 0.020.01 | 0.020.01 |
| 6300 [O i] | 0.050.01 | 0.030.01 |
| 6563 H | 5.410.10 | 3.040.06 |
| 6583 [N ii] | 3.830.07 | 2.120.04 |
| 6678 He i | 0.020.01 | 0.010.01 |
| 6717 [S ii] | 0.210.01 | 0.110.01 |
| 6731 [S ii] | 0.270.01 | 0.150.01 |
| 7065 He i | 0.020.01 | 0.010.01 |
| 7135 [Ar iii] | 0.050.01 | 0.020.01 |
| (H) dex | 0.680.02 | |
| (H)a | 1.740.11 | |
| (H) Å | 111 | |
| (abs) Å | 0.80.1 | |
ain units of 10-14 ergs s-1cm-2.
3 Physical conditions and heavy element abundances in the H II region
From the observed spectrum we shall now derive the physical conditions and metal abundances in Mkn 309. For the remaining objects the reader is referred to GIT00. Given the weakness or absence of [O iii] 4363 in Mkn 309 and other objects included later for comparison, the abundance determinations are affected by relatively large uncertainties. These are briefly discussed below.
3.1 Mkn 309
To determine heavy element abundances, we adopt, following Izotov et al. (1994, 1997), a two-zone photoionized H II region model: a high-ionization zone with temperature (O iii), where O iii and Ne iii lines originate, and a low-ionization zone with temperature (O ii), where O ii, N ii and S ii lines originate. As for the Ar iii lines, they originate in the intermediate zone between the high and low-ionization regions (Garnett 1992).
A weak auroral [O iii] 4363 emission line is detected with the peak intensity above the 3 level. However, the intensity of this line is rather uncertain due to underlying H stellar absorption and uncertainties in the placement of the continuum because of numerous absorption features. The temperature (O iii) calculated using the [O iii] 4363/(4959+5007) ratio is unreasonably high 47000 K. The electron temperature derived from the [N ii] 5755/6583 ratio (N ii) = 9900 K, though lower, is still significantly larger than the electron temperature (O iii) derived from the empirical relation by Edmunds & Pagel (1984) and can also be subject to the enhancement mechanisms discussed above. A similar (N ii) has been derived by Osterbrock & Cohen (1982). Adopting (N ii) = 9900K results in an oxygen abundance 12 + log O/H = 7.85. However, the N/O abundance ratio in this case is 30 – 40 times larger than the value expected for such a low oxygen abundance, which seems unreasonable. Therefore, we do not use the [O iii] 4363 and [N ii] 5755 auroral lines for the determination of electron temperature. Instead, the empirical method by Edmunds & Pagel (1984) is used to derive (O iii) from the intensities of nebular [O ii] 3727 and [O iii] 4959 + 5007 lines. The electron temperature for [O ii] is derived using the results of the H II photoionization models of Stasińska (1990) and the electron temperature for [Ar iii] is derived using the prescriptions by Garnett (1992). The electron number density is calculated from the [S ii] 6717/6731 line intensity ratio. Then and are used to derive element abundances.
In Table 3 we show the derived electron temperatures for different ions and the electron number density . The electron temperatures are particularly low, much lower than those derived from the [O iii] and [N ii] line intensity ratios. We find = 1110 cm-3. The resulting abundances for heavy elements are shown in Table 3. The oxygen abundance 12 + log O/H = 9.41 is 3 times larger than the solar value. In Table 3 we also show the oxygen abundance derived from empirical methods using [O ii] + [O iii] intensities (Edmunds & Pagel 1984) and the [N ii] 6583/H line intensity ratio (van Zee et al. 1998). All methods give nearly the same value of oxygen abundance. The nitrogen-to-oxygen abundance ratio is 4 times larger than the solar value and within the errors is consistent with the secondary nitrogen production expected at the high metallicity of Mkn 309.
| Parameter | Value |
|---|---|
| (O iii)(K) | 3830520 |
| (O ii)(K) | 6110520 |
| (Ar iii)(K) | 4970520 |
| (S ii)(cm-3) | 1110350 |
| O+/H+(103) | 0.380.21 |
| O++/H+(103) | 2.202.29 |
| O/H(103) | 2.582.30 |
| 12 + log(O/H) | 9.410.39 |
| 12 + log(O/H) (Edmunds & Pagel) | 9.320.20 |
| 12 + log(O/H) (van Zee et al.) | 9.320.20 |
| N+/H+(103) | 0.200.10 |
| ICF(N) | 6.85 |
| log(N/O) | –0.290.64 |
| Ar++/H+(106) | 1.680.75 |
| ICF(Ar) | 2.25 |
| log(Ar/O) | –2.840.41 |

| Parameter | Valuea |
|---|---|
| (H)b | 2.200.17 |
| (N iii 4512) | 0.250.03 |
| (Si iii 4565) | 0.060.02 |
| (N v 4612) | 0.140.02 |
| (N iii 4640) | 0.250.02 |
| (C iv 4658) | 0.220.02 |
| (He ii 4686) | 0.230.02 |
| (C iii 5696) | 0.100.02 |
| (C iv 5808) | 0.150.02 |
| (4650)c | 4.090.23 Å |
| (C iv 5808) | 1.190.20 Å |
| ain units of 10-14 ergs s-1cm-2. | |
| bmeasured in a 6″6″ aperture | |
| cincludes the three WR lines from 4640 – 4686 Å. | |
3.2 Uncertainties
Although various empirical methods concur to indicate a similar O/H abundance for Mkn 309 (cf. above), metallicity determinations in the absence of direct electron temperature measurements remain uncertain. This is the case for most of the objects in this study. The quoted errors indicate only formal uncertainties.
McGaugh (1994) estimates an uncertainty of 0.1 dex on O/H at high abundances. As shown by Stasińska (1998) calibrations of the strong line method are also affected by age and geometrical effects. Errors are difficult to estimate in this case; from theoretical modeling an uncertainty of 0.1–0.2 dex may not be unreasonable (Stasińska 1998).
In GIT00 and the present paper we adopt the van Zee et al. (1999) calibration with typical errors of 0.2 dex and which is formally only valid to 12 + (O/H) 9.1. This limited metallicity range is due to the intrinsic difficulties mentioned above and affects other calibrations in the literature (e.g. Edmunds & Pagel 1984). The van Zee et al. calibration is based on the intensities of [N ii] lines. Our metallicities could be overestimated if nitrogen is enriched in nuclear regions of galaxies (e.g. Coziol et al. 1999).
4 Stellar features and analysis of the stellar populations
The quality of the spectra allow the detection of several stellar emission and absorption features the most prominent ones being the WR emission lines, H and He absorption lines, TiO, Ca ii, Na i and Fe i absorption features.
The broad emission lines attributed to WR stars are discussed below and will later be used extensively for quantitative modeling. The high order Balmer absorption lines as well as He i absorption lines, often seen in H ii regions, are mostly due to OBA stars. Recent synthesis models including these lines are given by González Delgado et al. (1999; cf. also Olofsson 1995).
4.1 Features from late type stars
Several broad absorption features, mostly due to TiO bands, are observed around 6250 and 7200 Å in all our objects (see Fig. 2). These absorption features as well as some narrow absorption lines of atoms and ions, commonly observed in integrated spectra of clusters including young stars (cf. Bica & Alloin 1986), indicate the presence of red giants or supergiants in our regions. However, some contribution of interstellar Ca ii and Na i absorption might be present. Quantitative measurements of TiO absorption features for a large sample of blue compact dwarf galaxies have been provided by Guseva et al. (1998)111Using the TiO features, stellar metallicities have been obtained for 36 star-forming regions. At least for the lowest metallicities, their results indicate that the metallicities of stars are less than the metallicity of the gas.. The two absorption features found in our objects are observed in giant and supergiant stars of spectral types K3 and later (e.g. Silva & Cornell 1992). Despite the presence of nebular lines there is no indication of the broad TiO band at 6540 – 7050 Å seen in M types. The observed TiO features are thus compatible with giants or supergiants of spectral type K3 or later K types. Presently we are not able to firmly distinguish between a young ( 7–10 Myr) supergiant population or an older giant population (possibly a “nuclear” or bulge like population). However, the equivalent widths of heavy element absorption features are rather consistent with young stellar population. While strength of TiO bands is insensitive to the age of stellar population (Bica & Alloin 1986), the equivalent widths of Ca ii 3933 (1.5 Å) and Na i 5889, 5895 (1 Å) lines are smaller than those for old stellar population and are consistent with values expected for the young stellar population (Bica & Alloin 1986). Therefore, we strongly favour the first interpretation (population of red supergiants), which, as will be shown later, allows a consistent explanation of all major observational constraints in the framework of a simple star formation history dominated by recent activity. Unless otherwise stated this working hypothesis is thus adopted in the remainder of this work. A more firm distinction should be possible using observations covering a more extended wavelength range and other stellar signatures.
Limited quantitative information can be obtained from the observed TiO bands. First contamination by nebular emission lines and sky lines render exact measurements of some features difficult. Furthermore, quantitative models of the TiO features in young populations are not available yet. Although promising for future work (cf. Schiavon et al. 2000), no detailed quantitative analysis of the TiO features will thus be undertaken here. The only constraint retained below (Sect. 5), is that we conclude that the RSG features indicate the presence of stars with ages 7–10 Myr in the observed region (e.g. Origlia et al. 1999).
In passing we note the similarity of some of our findings with earlier studies on the link between starbursts and AGNs, which have revealed the simultaneous presence of the Ca ii triplet originating from red giants or supergiant, H ii-region like emission lines, and partly also WR stars (e.g. Terlevich et al. 1990, 1996, Pastoriza et al. 1993). The main aim of our study being different from these studies, we leave a discussion of similarities and differences to further investigations.
4.2 Broad emission lines from WR stars – analysing the WR population
The objects included in our study have been selected for the presence of broad emission lines attributed to WR stars. The following lines have been identified in our objects: N iii 4512, Si iii 4565222On further inspection of the data of GIT00 and additional observations, it appears that the origin of this line (stellar or nebular) may not be fully established. This will be addressed in a future publication., the so-called blue bump: N v 4612, N iii 4640, C iv 4658, He ii 4686; C iii 5696, and the red bump C iv 5808 (see SCK99, GIT00). The WR line intensities and equivalent widths in Mkn 589, Mkn 710, Mkn 1199 and Mkn 1259 are taken from GIT00. Additional data on Mkn 710 from SCK99 are also included our analysis. The new data on Mkn 309 is presented below. The intensities of the blue WR bump in those and other objects to be discussed later are also given in Table 6. For objects in common with earlier studies, our intensities ((WR)/(H)) and are in good agreement with the data of Mas-Hesse & Kunth (1996) and SCK99 for Mkn 710, and with that of Ohyama et al. (1997) for Mkn 1259. Differences with the data of Mkn 710 from Vacca & Conti (1992) were discussed in SCK99; their origin remains unclear.
We shall now discuss the observed WR lines and estimate the number of WR stars of various subtypes in Mkn 309. Such an analysis is given by SCK99 and GIT00 for the other objects.
Several broad emission lines (FWHM 15 - 50 Å) have been detected in the spectrum of Mkn 309 suggesting the presence of Wolf-Rayet (WR) stars of several types. The observed fluxes of these lines measured in the 2″42 aperture are shown in Table 4. The H flux given there was measured in a 6″6″ aperture using another spectrum. Comparison with the narrow slit spectrum shows that the large aperture contains most of the H emission which is more spatially extended than the continuum emission.
These fluxes have then been corrected for extinction, and line luminosities were calculated adopting the distance = 168.6 Mpc derived from =0.04215 (NED) assuming =75 km s-1 Mpc-1. The luminosities have been calculated for two cases: I) the extinction coefficient (H) is equal to 0.68 as derived from the Balmer decrement for both gas and stars and II) (H) is equal to 0.68 for the gas and 0.15 for stars (Sect. 5). The results are shown in Table 5. The H flux and equivalent width agree well with the data of Osterbrock & Cohen (1982, hereafter OC82). The intensity of their WR bump is 30 % larger than our measurement including all WR lines from 4512 to 4686 Å. Such differences could have various origins (different observational setups etc.) and are not uncommon (see e.g. comparison in SCK99). They do not affect our conclusions on Mkn 309.
The strongest lines are those of the most frequently observed blue “WR bump” ( 4650 Å) which we identify as a composition of the N v 4603,4619 doublet denoted here as N v 4612, the Niii 4634-40 blend, the Ciii/iv 4650-58 blend, and He ii 4686. Broad N iii 4512 is also detected as previously noted in several objects by GIT00. We confirm the presence of N v 4612, C iii 5696 and C iv 5808 which were suspected by OC82.
The observed WR features clearly indicate a mixed population of WN and WC stars. What can be said about their subtypes ? The low N v 4612/N iii 4640 ratio indicates a late WN subtype; the observed value corresponds to the WN6 type, although it is also compatible with subtypes WN7-8 (Smith et al. 1996). C iii 5696 emission is only strong in late WC stars. The observed C iii 5696/C iv 5808 ratio, the primary classification criterion, corresponds to WC7-8 stars (SV98, Crowther et al. 1998). Taking into account the contribution from the detected WNL stars to C iv 5808 changes the subtype to WC8 according to the Crowther et al. classification. The width of C iii 5696 (FWHM 19 Å) is, however, smaller than that of C iv 5808 (49 Å). This could indicate a mixture of late and some early WC stars. Our improved observations confirm the presence of WN and WC stars which were suspected by OC82 and re-enforce their proposed subtype distribution.
| Parameter | Ia | IIb |
|---|---|---|
| 168.6 Mpc | 168.6 Mpc | |
| (H) | (3.590.28)1041 | (3.590.28)1041 |
| (N iii 4512) | (4.750.49)1040 | (1.250.13)1040 |
| (Si iii 4565) | (1.050.42)1040 | (2.821.14)1039 |
| (N v 4612) | (2.440.43)1040 | (6.651.18)1039 |
| (N iii 4640) | (4.430.39)1040 | (1.210.11)1040 |
| (C iv 4658) | (3.820.36)1040 | (1.050.10)1040 |
| (He ii 4686) | (4.060.35)1040 | (1.130.10)1040 |
| (C iii 5696) | (1.290.21)1040 | (4.710.77)1039 |
| (C iv 5808) | (1.740.29)1040 | (6.521.08)1039 |
| (O7V) | 659005100 | 659005100 |
| (WNL) | 258002300 | 7060630 |
| (WC7) from uncorrected C iv 5808 | 124002100 | 4650770 |
| (WC7) from corrected C iv 5808 for WNL | 106001800 | 4150690 |
| (WC7) from C iii 5696 | 160002600 | 5810950 |
| (WC7)/(WNL) | 0.42 – 0.63 | 0.59 – 0.82 |
| (WC8) from C iii 5696 | 188003100 | 68401120 |
| (WC4) from C iv 5808 corrected for WNL+WCL | 2780460 | 1140190 |
| (WC4 + WC8)/(WNL) | 0.850.14 | 1.130.19 |
| (WNL)/(O7V) | 0.390.05 | 0.110.01 |
| (WR)/(O7V) | 0.59 – 0.71 | 0.19 – 0.22 |
a(H) = 0.68 is assumed for correction of all lines.
b(H) = 0.68 and 0.15 are assumed for gaseous and stellar emission, respectively.
cin ergs s-1.
| Name | Metallicity | Distance | (WR)/(H) | (WR) | (WR) | References |
|---|---|---|---|---|---|---|
| [12 + (O/H)] | [Mpc] | intensity | [erg s-1] | |||
| High (WR) objects | ||||||
| IRAS 01003-2238 | 470 | 0.61 | 2.9 | 9. | Armus et al. (1988) | |
| Mkn 309 | 9.3 | 168.6 | 0.34 | 1.2 | (1.2–4.) | present work |
| NGC 1614 | 8.6 | 64 | 0.08 | 7.6 | 2.4 | Armus et al. (1989) |
| Vacca & Conti (1992) | ||||||
| Mkn 1259 | 8.95 | 28.7 | 0.27 | 5.7 | 2.0 | GIT00 |
| Mkn 1199 | 9.13 | 54.1 | 0.38 | 5.9 | 1.9 | GIT00 |
| Mkn 477 | 152 | 0.1 | 5.4 | 1.7 | Heckman et al. (1997) | |
| F08208+2816 | 8.15 | 189 | 0.08 | 3.7 | 2.4 | Huang et al. (1998) |
| Mkn 702 | 8.60 | 212.1 | 0.13 | 3.2 | 1.2 | GIT00 |
| Mkn 589 | 8.99 | 45.9 | 0.24 | 2.1 | 8. | GIT00 |
| Objects with large (WR)/(H) | ||||||
| Mkn 710 | 9.03 | 20 | 0.3 | 4.6 | 800 | SCK99, GIT00 |
| Mkn 1063 | 8.46 | 20 | 0.20 | 1.6 | 600 | GIT00 |
| Mkn 178 | 7.82 | 2.96 | 0.39 | 1.6 | 5 | GIT00 |
| NGC 5128/13 | 9. | 5.5 | 1.0–1.8 | D’Odorico & Rosa (1982) | ||
We now estimate quantitatively the number of WR stars using the calibration of WR line luminosities of SV98 from Galactic and LMC stars. The resulting numbers of WR stars and their relative numbers are shown in Table 5 for the two choices of extinction coefficient mentioned above. Since He ii 4686 is predominantly emitted by WN stars and no nebular emission is present given the low excitation we use this line to count the number of WNL stars. Depending on the adopted extinction 7000–26000 stars are found. The number of WC stars can be derived from C iv 5808 and/or C iii 5696. For the former line the contribution of emission from WNL stars ( 10-15 %) has to be subtracted. Adopting the mean spectral type to be WC7, we find 4000 – 16000 WCL. Strong variations of the line luminosities of individual WC stars on subtype are found (SV98); adopting WC8 as mean spectral type would considerably increase the deduced number of WCL stars. Assuming that both WCL and WCE stars are present (as indicated by the line widths discussed above), we can alternatively derive their numbers from C iv 5808 and C iii 5696 respectively. The total number of WCL+WCE stars derived in this way is in reasonable agreement with the previous estimate. In all cases the resulting (WC)/(WN) ratio is found to be between 0.4 to 1.1 (Table 5). A metallicity dependence of the average line luminosities used here can a priori not be excluded. However, Galactic and LMC WR stars do not show significant differences, except for N iii 4640 (cf. SV98). In addition, since the Galactic objects used by SV98 includes a good fraction of WR stars located inside the solar radius at metallicities typically 0.15 dex above solar (cf. Maeder & Meynet 1994) our estimated WR populations and the detailed comparisons shown below should not be affected by possible variations of the properties of individual WR stars with metallicity.
What can be said about the remaining WR lines ? Using again the line luminosities from SV98, different estimates of WC stars yield predictions for the C iv 4658 line in good agreement with the observed one (differences from –20 to +50 %). The observed N iii 4640 emission from WNL stars is found to exceed the expected value by a factor of 2 based on the average Galactic value of N iii 4640/He ii 4686 (see SV98), which is known to show a metallicity dependence (Smith et al. 1996). The excess could thus be due to larger N iii 4640/He ii 4686 emission in WNL stars at high metallicities (cf. also Schmutz & Vacca 1999). Using the derived WR number population and the data of SV98, weak emission – below our detection limit – is expected for other WR lines. This is in agreement with the observed spectrum. Similar quantitative comparisons cannot yet be done for N iii 4512 and Si iii 4565 (see GIT00 for detections of these lines in other objects). We conclude that all broad emission lines detections and non-detections are compatible with the WNL and WC populations indicated in Table 5.

4.3 WR and O star populations in Mkn 309 and related objects
The ionizing flux of Mkn 309 corresponds to a number (O7V)65900 of equivalent O7V stars assuming Case B recombination, K, and cm-3. Thus, the number ratio of WR stars to equivalent O7V stars is (WR)/(O7V) = 0.59 – 0.71 in case I (Table 5) and 0.19 – 0.22 in case II. Here (WR) = (WNL+WC4+WC8) or (WR) = (WNL+WC4+WC7). The high (WR) / (O7V) value (assuming identical extinction for gas and stars) is more than a factor of 2 larger than the observed (WR)/(O) value in Galactic regions inside the solar radius and in M31, which are representative for environments with constant star formation at solar and supersolar metallicity (see Maeder & Meynet 1994 and references therein). As for other WR galaxies (cf. e.g. Vacca & Conti 1992, GIT00) such (WR)/(O) ratios generally indicate intense star forming events taking place over relatively short timescales (e.g. review of Schaerer 1999a). Estimates of the SF timescales for the objects of our study and allowing also for the observed lower extinction for the stars will be derived below (Sect. 5).
Among all WR galaxies with 12 + (O/H) 8.3, the largest (WC)/(WN) ratio ( 0.4 – 0.8) is derived in Mkn 309 (cf. SCK99, GIT00). Although lower, the upper value comes close to (WC)/(WN) 0.9 – 1 observed at high metallicities in the Local Group (Massey & Johnson 1998). As shown below, the WN and WC populations in all metal-rich WR galaxies studied here can be understood in terms of current stellar evolution models.
To compare the WR populations of Mkn 309 with those in other related objects we have compiled in Table 6 the properties of WR galaxies with large WR bump luminosities and large (WR)/H line intensities. The compilation is based on the catalogue of Schaerer et al. (1999b) and the data discussed in Schaerer (1999a). In absolute terms, the WR population in Mkn 309 is among the largest known; presently it is only surpassed by the ultra-luminous infrared galaxy IRAS 01003–2238 (IRAS F01004–2237, Armus et al. 1988, Veilleux et al. 1999). Other objects with more than 8000-10000 WR stars333WR numbers based on determinations in the original papers or objects with (WRbump) 2. erg s-1 using the calibration of Smith (1991) for individual WN7 stars. The list is likely incomplete due to missing data on WR line fluxes. Marginal cases not included here are NGC 6764, Mkn 315, He 2-10 (references in Schaerer et al. 1999b). See GIT00 (Fig. 3) for additional WR-bump luminosities. are NGC 1614, Mkn 477, Mkn 1259, Mkn 1199, Mkn 702 and Mkn 589, and F08208+2816 whose main properties are summarised in Table 6.
Interestingly, at least the two most “WR-luminous” objects (IRAS 01003–2238 and Mkn 309) also stand out by very large (WR)/(H) ratios444(WR) stands for the intensity of blue bump including broad lines between 4640 and 4686 Å. as shown in Fig. 3. The intensities (see Table 6) clearly exceed the typical values of 0.1–0.2 (cf. also Schaerer 1999a). Other objects with strong WR bump intensities but much smaller absolute populations of WR stars are the H ii region # 13 in NGC 5128 (Cen A), Mkn 178, Mkn 710, and Mkn 1063 also listed in Table 6. Although few such WR regions are currently known at the high metallicity end, it seems that the largest WR intensities are found in massive and distant objects. If true, this is quite surprising. Indeed for similar metallicity and IMF one would statistically expect reduced WR strengths in more distant objects where the spectroscopic observations encompass a much larger area containing more likely a mixture of several populations with different ages. Observational biases may, however, also be present (see Kunth & Joubert 1985). New observations of nearby (low ) metal-rich WR regions will be needed to confirm this trend. In any case, it appears that despite the likely growing importance of the “age spread effect” the increase of the WR population with metallicity (cf. Maeder & Meynet 1994) is sufficient to lead to the continuing increase of the (WR)/(H) envelope with metallicity first shown by Arnault et al. (1989).
5 Model comparison
To constrain the basic properties of the massive star populations (IMF slope, ) and the star formation history (age, burst duration) of our objects we now undertake a detailed comparison between the observations and evolutionary synthesis models.
5.1 Procedure
The following main observational constraints are used:
-
1.
H and H equivalent widths. The former is used as a primary age indicator; once is reproduced serves as an independent test for the predicted spectral energy distribution (SED) in the red.
-
2.
Nebular line intensities. (H)/(H) determines the extinction of the gas. The use of other line intensities requires detailed photoionization modeling which is beyond the scope of this paper.
-
3.
Intensities and equivalent widths of the main WR features. The blue bump (henceforth referred to as 4650 bump) and C iv 5808 (red bump) serve as main constraints on the WR population. To avoid uncertainties in deblending individual contributions of the blue bump we prefer to use measurements for the entire bump. In contrast to the spectra of metallicity objects our low excitation spectra show no evident contamination from nebular lines (e.g. [Fe iii] 4658, nebular He ii 4686).
To potentially disentangle between various effects (underlying “non-ionizing” population, loss of photons, differential extinction between gas and stars) it is important to use both equivalent widths and relative WR/H intensities (cf. SCK99).
-
4.
TiO bands at 6250 and 7200 Å. Assuming that they originate from a red supergiant population (rather than giants; cf. Sect. 4) this indicates the presence of cool stars from a population with ages 7–10 Myr.
-
5.
SEDs available over the full range of 3500–7500 Å provide an additional important constraint on the non-WR populations, which are responsible for the continuum flux.
For the model comparisons we use calculations based on the evolutionary synthesis code of SV98, which in particular includes the most recent calibration of WR line luminosities used to synthesize the WR features, up-to-date stellar tracks, and recent stellar atmospheres for O and WR stars complemented by Kurucz models for cooler stars (see SV98 for a full description). In all cases the high-mass loss stellar tracks of Meynet et al. (1994), which reproduce a large number of properties of individual WR stars and WR populations in nearby galaxies (Maeder & Meynet 1994) are used. Note that except for the improved O star atmospheres used by SV98 the recent Starburst99 synthesis models (Leitherer et al. 1999) use the same basic input physics.


The basic model parameters we consider are:
-
a)
Metallicity. Two sets of stellar tracks with different metallicities are explored here: (solar) and 0.04.
-
b)
IMF slope and upper mass cut-off (). We adopt a Salpeter IMF (slope =2.35), and =120 as our standard model.
-
c)
Star formation history (SFH). Models for instantaneous bursts (coeval population), extended burst durations (constant SF during period ; in this case age=0 is defined at the onset of SF, i.e. corresponds to that of the oldest stars present), and constant SF are considered. Models of combined stellar populations (arbitrary ages, and relative weights) with the same SFH have also been calculated.
-
d)
Fraction of ionizing Lyman continuum photons (). indicates the fraction of ionizing photons absorbed by the gas. Our standard value is . Values are used to simulate various effects (e.g. dust absorption, photon leakage outside regions, etc.) leading to a reduction of photons available for photoionization.
-
e)
Stellar extinction is kept as a free parameter for the comparison of the SED. This is justified by numerous indications showing different extinction between gas and stars (e.g. Fanelli et al. 1988). Note that such a difference affects also , , and (WR)/(H) ratios. In Figs. 4, 5, 8 we therefore show two sets of observations: corrected assuming (filled symbols) and using (open symbols) determined from the SED model fit (see below).
One of our main aims is to constrain the IMF (slope, ). To do so we adopt in this section a “conservative approach” which consists of exploring as far as possible a “standard” (Salpeter) IMF to see if any observational constraint requires a deviation from it. Regarding the WR features this in particular implies that in this section (i.e. Figs. 4 and 5) all observations will be compared to synthesis models at solar metallicity (=0.02) This model can thus be taken as a lower limit for the predicted WR strengths which increase with increasing metallicity. The use of this lower limit is necessary in view of the lack of precise metallicity determinations for metal-rich objects.


5.2 Results
The comparison of the observed and predicted WR features is shown in Fig. 4. We show predictions for instantaneous bursts at =0.02 (solid line), =0.04 (dashed), and burst durations of Myr at =0.02 (dotted). All models are calculated with the “standard” IMF (Salpeter, =120 ). Figure 4 shows the following:
-
•
both the observed WR equivalent width and the (WR) / (H) ratio fall below the predictions for an instantaneous burst at solar metallicity rather than between the =0.02 and 0.04 curves corresponding to super solar metallicities. If each observed region corresponded indeed to a single coeval population, this finding would be a strong argument in favor of a deficiency of stars above the WR mass limit ( 21–25 ) with respect to the standard IMF. However, in the present case this can be explained quite simply as follows.
-
•
The observations are well reproduced by =0.02 models assuming extended burst durations of 4–10 Myr. The corresponding ages of our objects, as indicated by , are between 7 and 15 Myr as shown in Fig. 6. The observations of the red WR bump (C iv 5808; see Fig. 5) and the remaining observational constraints are well matched by this scenario (see below).
-
•
Including the differential extinction correction for gas and stars as derived from the Balmer decrement and the SED (cf. below) leads to non-negligible changes of the considered quantities. Allowing for this effect does, however, not modify the above conclusions for the bulk of the objects.
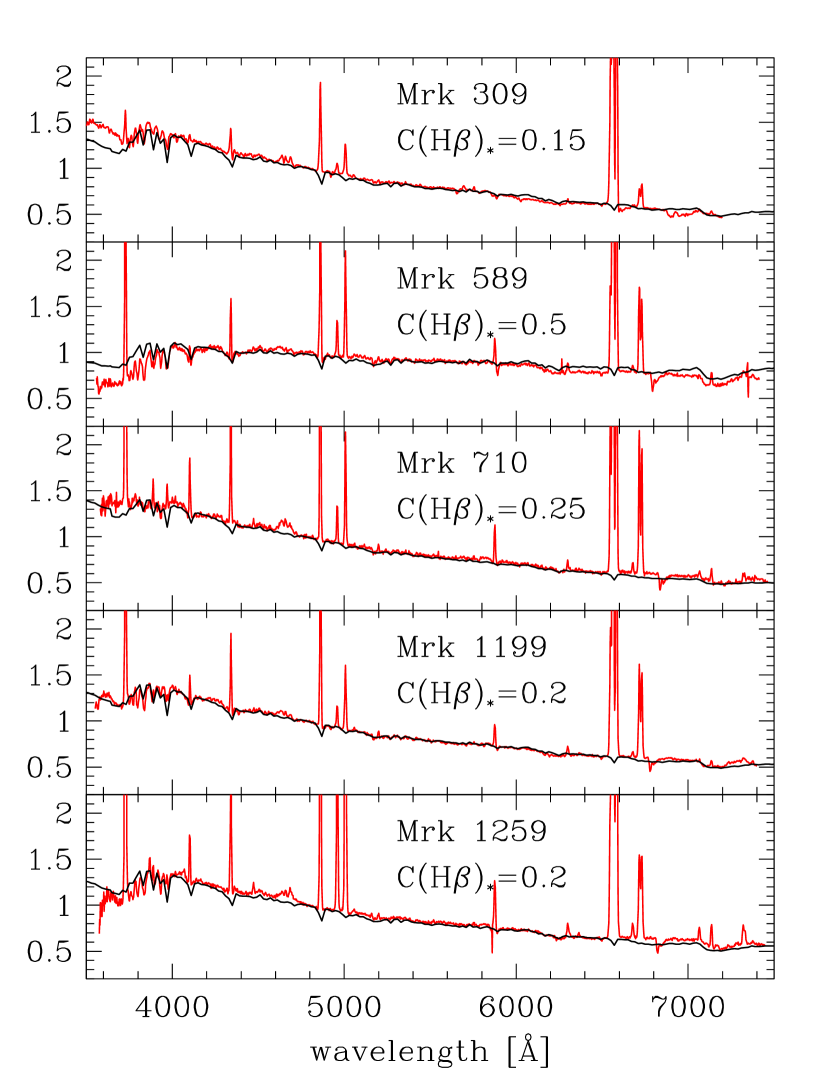
The extended burst scenario at ages 7–15 Myr also explains the presence of red (super)giants revealed by the TiO bands (Sect. 4). Even at a quantitative level we note, somewhat surprisingly, that the broad TiO features (especially the 6250 Å feature) in the majority of objects are quite well reproduced by our SEDs, where Kurucz models are used to describe cool stars (see Fig. 7). In any case, we find that the overall shape of the SED alone already indicates a mixture of populations with different ages. Independent of the amount of extinction, single stellar populations are not able to produce the required relative amount of blue ( 5100 Å) to red light.
Last, but not least, the overall SEDs in the optical range of all objects are very well reproduced with the extended burst models at =0.02 555Similar agreement is also obtained with the =0.04 models.. The SEDs, shown in Fig. 7, correspond to the model for =8 Myr, taken at the age deduced from the observed H equivalent width (see Fig. 6). Both the predicted stellar and nebular continuum emission are included in the models. In the present case the latter is of importance only for emission shortward of the Balmer break. However, in this domain a quantitative comparison is not possible since the H and He continuous emission coefficients depend quite strongly on the electron temperature which is poorly known for the present objects.
As discussed above, the extinction suffered by the stellar continuum () is taken as a free parameter, since it may differ from the value derived from the gas (Balmer decrement). The resulting values of are systematically smaller than the values from the gas (Mkn 309: 0.15 / 0.68, Mkn 589: 0.5/0.72; Mkn 710: 0.25/0.52, Mkn 1199: 0.2/0.55, Mkn 1259: 0.2/0.60) with differences similar to those found e.g. by Calzetti (1997) and Mas-Hesse & Kunth (1999). For Mkn 309, with the largest , we have independent evidence showing that : the observed ratio / = 8.9 clearly exceeds the maximum (typical) value of 7.5 ( 5–6) predicted for instantaneous (extended) burst models666Although less clearly the remaining objects seem to indicate the same finding. / is larger than the typical value predicted for extended burst models. Mkn 589: /=6.30; Mkn 710: 6.68; Mkn1199: 6.84; Mkn 1259: 7.18.. Any other effect (underlying old population, multiple components etc.) will further reduce the predicted / ratio; the only way to bring both in agreement is by adopting a larger extinction for the gas. Accounting for the differential extinction and adopting the SEDs shown in Fig. 7, the observed / are in excellent agreement with the model predictions for all objects.
We conclude that all the given observational constraints can be reproduced by models with a Salpeter IMF extending to high masses for a burst scenario with star formation extending over 4–10 Myr. Let us now address the question if this model is unique and what other models can be excluded.
5.3 Alternate models
A variety of other models have been considered to explain the observations. We here consider mostly three variations, all of them adopting a large upper mass cut-off: 1) the effect of internal dust absorbing the ionizing photons, 2) variations of the star formation history, and 3) variations of the IMF slope.
The first one is illustrated in Fig. 4, where the arrow indicates the direction along which the predicted lines will be shifted if 50 % of the Lyman continuum photons are lost (e.g. absorbed by dust inside the H ii region). The Figure shows that in this case the observations can still reasonably be explained with our “standard model”; somewhat longer burst durations are then required. A distinction between the two cases from the remaining constraints including the SED is not possible. However, values of seem more difficult to reconcile with Fig. 4.
As mentioned earlier instantaneous burst models are excluded from the observations due to the presence of both WR and RSG features, and the detailed SED. This also holds for synthesis models allowing for the formation of WR stars through Roche lobe overflow in massive close binary systems (Cerviño 1998, Cerviño et al. 2000). At the epoch where such instantaneous burst models predict the simultaneous presence of WR (formed in interacting systems) and RSG, the predicted H equivalent width is too low (Cerviño, private communication). Constant star formation (CSF) predicts a maximum (WR)/(H) which is much too small (see Fig. 4), and too large H equivalent widths. The only way reconcile this scenario is to invoke effect 2) with variable values of as low as 0.1–0.25. The SED does not exclude this possibility. We have also performed Monte-Carlo simulations combining arbitrarily two “standard IMF” instantaneous bursts of different ages and relative contributions. Several possible combinations are found satisfying all the observational constraints; all of them obviously involve a young ( 5 Myr) population superposed to a older one ( 7–9 Myr) producing enough evolved red stars. Again, no strong distinction is found (“by eye”) for the SEDs compared to the extended burst scenario discussed above.
Finally we have considered the case of a steeper IMF slope of , keeping =120 . This IMF deficient in massive stars with respect to the Salpeter slope produces just a strong enough WR bump (up to 4650) 9 (13) Å for =0.02 (0.04)) at the maximum during an instantaneous burst. Extended bursts are essentially excluded in this case, and very few solutions (combined populations) can be found. Not enough massive stars (WR stars with 20–25 ) are expected for this steep IMF slope.
From the models considered in this Section we conclude that a variety of models with a “standard IMF” (Salpeter slope and large ) reproduce the observational constraints. Very few solutions can be found for an IMF slope close to the Miller & Scalo (1979) value; this renders such a steep IMF in metal-rich regions very unlikely.
Before we proceed to a further discussion of the IMF we shall briefly compare our successful models with those available by other authors for Mkn 710 and Mkn 1259.
5.4 Comparison with other work
The WR region in Mkn 710 has recently been studied in detail by SCK99 and Mas-Hesse & Kunth (1999). Our results are in agreement with the study of SCK99, whose measurements have been included in the present paper (see also SCK99 for comparisons with the earlier data of Vacca & Conti 1992). This region being the only metal-rich in the sample of SCK99, no detailed fitting attempt was made. Regarding the IMF, SCK99 conclude that the Salpeter slope produces enough WR stars to explain the observations. From the analysis of 5 metal-poor regions SCK99 found that short burst durations ( 2–4 Myr) were required; Mkn 710 was not considered. The somewhat longer burst durations found for the present metal-rich sample could be due to an increasing complexity of the regions considered here (nuclear SB versus isolated H ii regions) hosting progressively more separate populations.
For the comparison with Mas-Hesse & Kunth (1999) it is important to note that their optical–UV observations include a much larger region (10 by 20″) than the present observations typically extracted over 2–3″ wide regions. This explains most likely the larger contribution of an older underlying population contributing to the optical flux found by these authors. The results on the burst duration are in good agreement. Incidentally Mas-Hesse & Kunth derive the same stellar extinction as found from our work.
For Mkn 1259 a subsolar metallicity was derived by Ohyama et al. (1997) based on [O iii] 5007Å. The value used in the present work, based on a spectrum of superior S/N and resolution by GIT00, should be more accurate. Using their low metallicity value, Ohyama et al. (1997) concluded that an instantaneous burst with an age of 5 Myr reproduces well the observed properties of the nuclear region of this object. Using our metallicity, the strengths of the WR features imply an extended burst, compatible with the observed RSG features and the SED. For most aspects however, the difference with Ohyama et al. (1997) is probably negligible.
6 Discussion
Having excluded steep IMF’s with a high , we will now examine what limits can be set up on for a Salpeter slope and discuss several implications from our results. We then briefly discuss the plausibility of the star formation timescales derived in this work.

6.1 Constraints on the IMF from the present data
What value of is our data exactly sensitive to ? From the ages and burst durations derived above we see that the youngest stars present have ages of the order of 3–5 Myr. This corresponds to stars with initial masses 40–120 (see Meynet et al. 1994). Although in the best case our data could be sensitive to changes of over this range, we have to conservatively admit that we might not be able to distinguish between different values for the upper mass cut-off 40 . To improve the present situation one obviously has to be able to study the intrinsically youngest regions and/or include additional observational constraints.
With the objects studied here it is not straightforward to answer the reverse question, namely “What lower limit can we set on ?”. In the ideal case (instantaneous burst with a known metallicity) the use of WR lines is a very powerful discriminant, as illustrated in Fig. 8. Here, in principle, the high metallicity tracks (=0.04) should be adopted to obtain a conservative lower limit for . However, as it is clear from Sect. 5, the use of the WR features is not straightforward for answering the above question given the extended duration of SF. On the other hand, as apparent from Fig. 8, the observed H equivalent widths indicate clearly an upper mass cut-off of 30 .
The (He i 5876)/(H) ratio has previously been used by Bresolin et al. (1999) as an indicator of . We note that for all of the data except Mkn 309 our limit on seems also consistent with the observed (He i 5876)/(H) ratio as estimated from simple Case B recombination theory. More firm conclusions await combined stellar population and photoionization modeling (cf. Sect. 7).
6.2 IMF constraints from H/H equivalent widths of young SF regions
Assuming a Salpeter IMF with as large as 100–120 at high metallicity, to be compatible with the observations discussed above, has obviously implications which need to be confronted with other observational data. A straightforward implication is that at age=0 H ii regions are expected to show very large H equivalent width ( 450– 500 Å for =0.02–0.04, and larger values for and =120 ). It is well known that regions with such large are apparently not found or are extremely rare, independently of metallicity to first order. What is the situation for high metallicities ? Relatively few measurements have been published for metal-rich H ii regions. Among the data of Shields et al. (1991), Oey & Kennicutt (1993), Kennicutt & Garnett (1996), van Zee et al. (1998), and Bresolin et al. (1999, see Bresolin 1997) few regions with 12 + (O/H) 8.9 have 250 Å. Furthermore these measurements are most likely affected by very large uncertainties due to placement of the weak continuum as inspection of some data of van Zee et al. shows. From this data we conclude that max() 200-300 Å for metal-rich H ii regions. For a Salpeter slope this corresponds to 35 – 50 , compatible with our conservative lower limit for but clearly below “normal” values of 100–120 .
Although a detailed discussion and interpretation of the observed H or H equivalent widths distributions is beyond the scope of the present work, we would like to briefly comment on four processes which could lead to reduced values of the observed maximum: 1) Dust inside the H ii regions, 2) underlying populations diluting the continuum, 3) early phases hidden in compact radio sources (cf. Kobulnicky & Johnson 1999), 4) absence of a proper ZAMS for high mass stars in the accretion scenario of Bernasconi & Maeder (1996). From the available data we are not able to discuss possible selection effects.
The first two are the most commonly considered possibilities. The importance of dust, especially in metal-rich objects, remains to be explored. For metal-poor objects (e.g. H ii galaxies) with a low dust content the effect should on average be small. Although for metal-poor objects the young bursts might dominate the visible light and underlying absorption (2) should thus not be important for the max()-discrepancy (cf. Mas-Hesse & Kunth 1999), the recent study of Raimann et al. (2000) suggests the existence of non-negligible underlying populations. If the bulk of star formation (SF) occurred in a similar fashion as in He 2-10, where Kobulnicky & Johnson (1999) find a significant number of compact radio sources, this could constitute a possibility to hide the earliest phases of SF and thereby reducing the observed maximum . We note, however, that the estimated lifetime of these regions ( 10 % of the O star lifetime; Kobulnicky & Johnson) is clearly too short to resolve the max()-discrepancy which concerns the first 2 Myr. Effect 4 has been suggested by Mas-Hesse & Kunth (1999) as a possibility to explain this discrepancy. However, test calculations (Schaerer & Bernasconi, 1995, unpublished) show that the stellar tracks following the accretion scenario of Bernasconi & Maeder (1996) lead to an insufficient decrease of max()777max() 400 Å for =0.02 and the standard IMF.. In addition, the validity of their scenario remains to be verified by detailed confrontations with observations of individual stars.
Regarding only metal-rich region we conclude from the available data that the observed maximum H equivalent width is compatible with a Salpeter IMF with an upper mass cut-off 35 – 50 , in agreement with the results from our WR galaxies. Larger values of cannot be excluded from our present (small) sample of objects, in contrast to the indications from measurements in larger samples. In view of the discrepancy between the observed and predicted max() which seems to hold for all metallicities and for which currently no clear explanation exists, interpretations based on the “exclusive” use of should, however, be taken with caution.
6.3 Are the derived burst durations plausible ?
An interesting result derived from our models is that all the objects analysed here require extended burst durations over 4–10 Myr or a superposition of two or more bursts with similar ages differences and a young component ( 5 Myr). 888 We note that the observed H equivalent width and the (WR)/(H) ratio of IRAS 01003–2238 (cf. refs. in Table 6) can be explained by =0.04 models with a longer burst ( 20 Myr). For the most distant object from our sample (Mkn 309) the size of the observed region corresponds to 2 kpc. For a typical galaxian velocity dispersion of 200 km s-1 the crossing time is 8.4 Myr. Shorter times are obtained for the remaining objects (cf. Heckman et al. 1997 for Mkn 477) including also IRAS 01003–2238, which has a very compact morphology (Surace et al. 1999). This simple estimate shows that the above burst durations pose no fundamental physical problem for any of the objects discussed here.
Is there any difference of increasing burst duration with distance as could be expected on average if the observed regions are composed of an increasing number of “small” super star cluster like objects ? In this context it is interesting to note that in an earlier study of WR galaxies with distances of 4–14 Mpc burst durations not exceeding 2–4 Myr were found using the same evolutionary synthesis models (SCK99). This difference is likely due to two effects: first the distance effect, and second the different nature of the objects included in the two samples (dwarf galaxies with one or few SF regions versus predominantly nuclear starbursts).
7 Summary and conclusions
We have obtained new spectroscopic observation of Mkn 309, a starburst galaxy with one of the largest WR population known (cf. Osterbrock & Cohen 1982, Armus et al. 1988). Our high S/N observations allow in particular a detailed determination of the WR star content of this object, composed of WNL, WCL and possibly also some WCE stars (Sect. 4). Adopting the extinction from the Balmer decrement (but cf. below) this corresponds to massive star populations of 25000 WNL, 10000–15000 WC, and 65000 equivalent O7V stars in an area of 1.7 3.5 kpc. Several methods to estimate the metallicity concur to indicate 12 + (O/H) 9.3–9.4, which makes Mkn 309 the most metal-rich WR galaxy known today.
The Mkn 309 observations have been combined with spectra of four other metal-rich WR galaxies from the sample of Guseva et al. (2000) to constrain the basic properties of the massive star populations (IMF slope, ) and the star formation history (age, burst duration) of these objects by detailed quantitative comparisons with appropriate evolutionary synthesis models (Sect. 5). We have used the following main observational constraints: H recombination lines, intensities and equivalent widths of the main WR features, TiO bands originating from a population of late type stars (which are most likely red supergiants; cf. Sect. 4) and the detailed SED from 3500–7000 Å. Considering a large parameter space for the synthesis models (metallicity, IMF slope and upper mass cut-off, star formation history, possible effects of dust or photon leakage on the ionized gas, variable stellar extinction) we obtain the following main results:
1.) The observations are explained by continuous star formation extending over 4–10 Myr (“extended bursts”) seen at ages of 7–15 Myr or a superposition of several bursts with similar age differences (4–10 Myr) including a young ( 5 Myr burst). This naturally explains both the observed WR populations (including WN and WC stars) and the presence of red supergiants. Such extended burst durations, compared to other WR galaxies indicating even shorter SF timescales (e.g. SCK99), are plausible in view of the physical sizes of the observed regions and the nature and morphology of our objects (nuclear starbursts), and pose no fundamental physical problem (Sect. 6).
2.) The SEDs in the optical range are very well reproduced for all objects, provided the stellar light suffers from a smaller extinction than that of the gas (derived from the Balmer decrement). Differences of 0.15–0.36 are found for our objects with a mean . Our finding of smaller stellar extinction based solely on optical data is in agreement with earlier studies (e.g. Fanelli et al. 1988, Calzetti 1997, Mas-Hesse & Kunth 1999) requiring, however, the combination of UV and optical data.
3.) The observational constraints are compatible with a Salpeter IMF extending to masses 40 . Analysis of younger regions are required to provide real upper limit on the value of the upper mass cut-off. We have also explored what deviations from this “universal” IMF are allowed. Adopting a conservative approach we derive a lower limit of 30 for the Salpeter IMF. Larger values ( 30–40 ) are obtained using probably more realistic assumptions on the metallicity and SF history. An upper mass cut-off of at least 35 – 50 seems also indicated from H equivalent width measurements of metal-rich H ii regions in spiral galaxies (see Sect. 6). Quite independently of the value of , steeper IMFs with slopes such as the Miller & Scalo (1979) IMF, are very unlikely.
Obviously the solutions fitting the observable constraints are not unique. The main conclusions just summarised are, however, quite robust to changes of the considered model parameters (see Sect. 5.3). Nevertheless it should be recalled that the results presented here rely quite extensively on our present knowledge of massive stars, especially on the evolution of WR stars. The advantage of studying objects of solar or somewhat higher metallicity is that this corresponds to the domain with the largest number of individual WR stars in the Local Group which has previously been compared quite successfully to the evolutionary models used here (see Maeder & Meynet 1994). In this sense the application of our synthesis models to starburst galaxies should at least allow meaningful differential comparisons of properties such as the IMF.
Through the analysis of the massive star content in luminous metal-rich starbursts by means of their direct stellar features, our aim is to constrain the upper end of the IMF (slope and upper mass cut-off) in metal-rich environments in general and in particular in massive starbursts such as ULIRGs. Whereas previous studies based on indirect indications from the ionized gas seem to indicate an IMF deficient in massive stars (e.g. Goldader et al. 1997, Luhman et al. 1998, Bresolin et al. 1999, but see the recent modeling efforts of Thornley et al. 2000), our first results do not support such important differences compared to the “standard” Salpeter IMF.
To obtain more reliable constraints on the IMF in metal-rich environments new high quality spectral observations will be necessary. While analysis of few individual objects are extremely useful, larger samples are e.g. required to constrain the exact value of by sampling all relevant ages. To include the combined information from gas and stars, coupled evolutionary synthesis and photoionization models including all the stellar and nebular observables should be used consistently. Furthermore the statistical distributions of the properties of e.g. metal-rich disk H ii regions also contain encoded information about the IMF, SF history etc. The theoretical tools for such analysis are available today. With the new powerful telescopes available now, great progress should be made on studies of stellar populations and the IMF in metal-rich environments.
Acknowledgements.
We thank Richard Green for the participation in the observations of Mkn 309 and valuable comments, Liese van Zee, who kindly supplied us with some spectra of metal-rich H ii regions, Paul Crowther for discussions on the classification of WR stars, and Miguel Cerviño for calculations and discussions on synthesis models including binary stars. Claus Leitherer and Grazyna Stasińska provided useful comments on an earlier version of this work. Yuri Izotov acknowledges support from the Observatoire Midi-Pyrénées where part of this work was done. DS, NGG and YII acknowledge the partial support of INTAS grant 97-0033. TXT and YII acknowledge the partial financial support of NSF grant AST-9616863. He thanks the hospitality of the Observatoire of Paris-Meudon and the Institut d’Astrophysique in Paris.References
- (1) Armus, L., Heckman, T. M., Miley, G. K., 1988, ApJ 326, L45
- (2) Armus, L., Heckman, T. M., Miley, G. K., 1989, ApJ 347, 727
- (3) Arnault, P., Kunth, D., Schild, H., 1989, A&A 224, 73
- (4) Bernasconi, P. A., Maeder, A., 1996, A&A 307, 829
- (5) Bica, E., Alloin, D., 1986, A&A 162, 21
- (6) Bresolin, F., 1997, PhD thesis, University of Arizona
- (7) Bresolin, F. , Kennicutt, R. C. , Jr., Garnett, D. R., 1999, ApJ 510, 104
- (8) Burstein, D., Heiles, C., 1982, AJ 87, 1165
- (9) Calzetti, D., 1997, in “The Ultraviolet Universe at Low and High Redshift: Probing the Progress of Galaxy Evolution”, Eds. W.H. Waller et al., AIP Conference Proceedings, v.408., 403
- (10) Cerviño, M., 1998, PhD thesis, Universidad Complutense, Madrid
- (11) Cerviño, M., Mas-Hesse, J.M., 1994, A&A 284, 749
- (12) Cerviño, M., Mas-Hesse, J.M., Kunth, D., 2000, A&A, submitted
- (13) Conti, P. S., 1991, ApJ 377, 115
- (14) Coziol, R., Reyes, R.E.C. Considère, S., Davoust, E., Contini, T., 1999, A&A 345, 733
- (15) Crowther, P. A., de Marco, O., Barlow, M. J., 1998, MNRAS 296, 367
- (16) D’Odorico, S., Rosa, M., 1982, in “Wolf-Rayet Stars: Observations, Physics, Evolution”, Eds. C. W. H. de Loore, A. J. Willis, IAU Symp. 99, 557
- (17) Edmunds, M. G., Pagel, B. E. J., 1984, MNRAS 211, 507
- (18) Fanelli, M. N., O’Connell, R. W., Thuan, T. X., 1988, ApJ 334, 665
- (19) Figer, D. F., Najarro, F., Morris, M. , McLean, I. S., Geballe, T. R., Ghez, A. M., Langer, N., 1998, ApJ 506, 384
- (20) García-Vargas, M.L., Bressan, A., Díaz, A.I., 1995, A&AS 112, 13
- (21) García-Vargas, M.L., González Delgado, R. M., Pérez, E., Alloin, D., Díaz, A.I., Terlevich, E., 1997, ApJ 478, 112
- (22) Garnett, D. R., 1992, AJ 103, 1330
- (23) Gilmore, G., Howell, D., Eds., 1998, “The Stellar Initial Mass Function”, ASP Conf. Series, 142
- (24) Goldader, J. D., Joseph, R. D., Doyon, R., Sanders, D. B., 1997, ApJ 474, 104
- (25) González Delgado, R. M., Leitherer, C., Heckman, T., 1999, ApJS 125, 489
- (26) Guseva, N. G., Izotov, Y. I., Thuan, T. X., 1998, Kinematics and Physics of Celestial Bodies 14, 1
- (27) Guseva, N. G., Izotov, Y. I., Thuan, T. X., 2000, ApJ 531, 776 (GIT00)
- (28) Hamann, F., 1997, ApJS 109, 279
- (29) Heckman, T. M., Gonzalez-Delgado, R., Leitherer, C., Meurer, G. R., Krolik, J., Wilson, A. S., Koratkar, A., Kinney, A., 1997, ApJ 482, 114
- (30) Henry, R. B. C., Worthey, G., 1999, PASP 111, 919
- (31) Huang, J. H., Gu, Q. S., Ji, L., Li, W. D., Wei, J. Y., Zheng, W., 1999, ApJ 513, 215
- (32) Izotov Y. I., Thuan T. X., Lipovetsky V. A., 1994, ApJ 435, 647
- (33) Izotov Y. I., Thuan T. X., Lipovetsky V. A., 1997, ApJS 108, 1
- (34) Kennicutt, R. C., Jr., Garnett, D. R., 1996, ApJ 456, 504
- (35) Kobulnicky, H. A., Johnson, K .E., 1999, ApJ 527, 154
- (36) Kunth, D., Joubert, M., 1985, A&A, 142, 411
- (37) Larson, R., 1998, MNRAS 301, 569
- (38) Leitherer, C., Schaerer, D., Goldader, J. D., González Delgado, R. M., Robert, C., Foo Kune, D., De Mello, D., Devost, D., Heckman, T. M., 1999, ApJS 123, 3
- (39) Luhman, M. L., Satyapal, S., Fischer, J., et al., 1998, ApJ 504, L11
- (40) Maeder, A., Meynet, G., 1994, A&A 287, 803
- (41) Mas-Hesse, J. M., Kunth, D., 1999, A&A 349, 765
- (42) Massey, P., Johnson, O., 1998, ApJ 505, 793
- (43) McCarthy, J. K., Kudritzki, R. -P. , Lennon, D. J., Venn, K. A., Puls, J., 1997, ApJ 482, 757
- (44) McGaugh, S. S., 1994, ApJ 426, 135
- (45) Meynet, G., 1995, A&A 298, 767
- (46) Meynet, G., Maeder, A., Schaller, G., Schaerer, D., Charbonnel, C., 1994, A&AS 103, 97
- (47) Miller, G. E., Scalo, J. M., 1979, ApJS 41, 513
- (48) Monteverde, M. I., Herrero, A., Lennon, D. J., Kudritzki, R. -P., 1997, ApJ 474, L107
- (49) Najarro, F., Krabbe, A., Genzel, R., Lutz, D., Kudritzki, R. P., Hillier, D. J., 1997, A&A 325, 700
- (50) Oey, M. S., Kennicutt, R. C., Jr., 1993, ApJ 411, 137
- (51) Ohyama, Y., Taniguchi, Y., Terlevich, R., 1997, ApJ 480, L9
- (52) Olofsson, K., 1995, A&AS 111, 57
- (53) Origlia, L., Goldader, J. D., Leitherer, C., Schaerer, D., Oliva, E., 1999, ApJ 514, 96
- (54) Osterbrock, D. E., Cohen, R. D., 1982, ApJ 261, 64 (OC82)
- (55) Pastoriza, M.G., Dottori, H.A., Terlevich, E., Terlevich, R., Diaz, A.I., 1993, MNRAS, 260 177
- (56) Raimann, D., Storchi-Bergmann, T., Bica, E., Melnick, J., Schmitt, H., 2000, MNRAS, in press (astro-ph/0004160)
- (57) Scalo, J., 1998, in “The Stellar Initial Mass Function”, Eds. G. Gilmore, D. Howell, ASP Conf. Series, 142, 201
- (58) Schaerer, D., 1996, ApJ 467, L17
- (59) Schaerer, D., 1999a, in “Wolf-Rayet Phenomena in Massive Stars and Starburst Galaxies”, IAU Symp. 193, 539
- (60) Schaerer, D., 1999b, in “SpectroPhotometric Dating of Stars and Galaxies”, eds. I. Hubeny, S. Heap, R. Cornett, ASP Conf. Series, 192, 49
- (61) Schaerer, D., Contini, T., Kunth, D., 1999a, A&A 341, 399 (SCK99)
- (62) Schaerer, D., Contini, T., Pindao, M., 1999b, A&AS 136, 35
- (63) Schaerer, D., Vacca, W. D., 1998, ApJ 497, 618 (SV98)
- (64) Schiavon, R. P., Barbuy, B., Bruzual, G., 2000, ApJ, 532, 453
- (65) Schlegel, D. J., Finkbeiner, D. P., Davis, M., 1998, ApJ 500, 525
- (66) Schmutz, W., Vacca, W. D., 1999, New Astronomy 4, 197
- (67) Shields, G. A., Skillman, E. D., Kennicutt, R. C., Jr., 1991, ApJ 371, 82
- (68) Silva, D. R., Cornell, M. E., 1992, ApJS 81, 865
- (69) Smith, L. F. 1991, in “Wolf-Rayet Stars and Interrelations with Other Stars in Galaxies”, IAU Symp. 143, eds. K. A. van der Hucht & B. Hidayat, (Dordrecht: Kluwer), p. 601
- (70) Smith, L. F., Shara, M. M., Moffat, A. F. J., 1996, MNRAS 281, 163
- (71) Stasińska, G., 1990, A&AS 83, 501
- (72) Stasińska, G., 1998, in “Dwarf Galaxies and Cosmology”, Eds. T.X. Thuan, C. Balkowski, V. Cayette, J. Tran Thanh Van, Editions Frontieres (Gif-sur-Yvette, France), p. 259
- (73) Stasińska, G., Leitherer, C., 1996, ApJS 107, 661
- (74) Surace, J. A., Sanders, D. B., Vacca, W. D., Veilleux, S., Mazzarella, J. M., 1998, ApJ 492, 116
- (75) Terlevich, E., Diaz, A., Pastoriza, M.G., Terlevich, R., Dottori, H., 1990, MNRAS 242, 48P
- (76) Terlevich, E., Diaz, A., Terlevich, R., Gonzalez-Delgado, R., Perez, E., Garcia-Vargas, M.L., 1996, MNRAS 279, 1234
- (77) Thornley, M.D., Förster-Schreiber, N.M., Lutz, D., Genzel, R., Spoon, H.W.W., Kunze, D., 2000, ApJ, in press (astro-ph/0003334)
- (78) Vacca, W. D., Conti, P. S., 1992, ApJ 401, 543
- (79) van der Hucht, K. A., Koenigsberger, G., Eenens, P. R. J., (Eds.), “Wolf-Rayet Phenomena in Massive Stars and Starburst Galaxies”, IAU Symp. 193
- (80) van Zee, L., Salzer, J. J., Haynes, M. P., O’Donoghue, A. A., Balonek, T. J., 1998, AJ 116, 2805
- (81) Veilleux, S., Kim, D.-C., Sanders, D. B., 1999, ApJ 522, 113
- (82) Whitford, A. E., 1958, AJ 63, 201