Near–infrared imaging of the host galaxies of intermediate redshift steep spectrum radio quasars††thanks: Based on observations collected at the European Southern Observatory, La Silla, Chile.
Abstract
We present the results of near–infrared -band (1.65 m) imaging of 19 steep spectrum radio quasars (SSRQ) in the redshift range 0.5 z 1.0. This sample of SSRQs is matched with our previously studied complete sample of 20 flat spectrum radio quasars (FSRQ) with respect to redshift and optical and radio luminosity. We are able to clearly detect the host galaxy in 10 (53 %) SSRQs and marginally in 6 (32 %) others, while the host remains unresolved in 3 (16 %) SSRQs. The galaxies hosting the SSRQs are large (average bulge scale-length R(e) = 9.01.7 kpc) and luminous (average M(H) = -27.21.1). They are, therefore, 2 mag more luminous than the typical galaxy luminosity L* (M*(H) = –25.00.2), and 1 mag more luminous than the brightest cluster galaxies (M(H) = –26.30.3). The SSRQ hosts appear to have similar luminosity to those of the FSRQ hosts (M(H)–27), and they fall between the luminosities of lower redshift (M(H) –26) and higher redshift (M(H) –29) radio-loud quasars. The average nucleus–to–galaxy luminosity ratio of SSRQs (LN/LG = 3.83.2) is much smaller than that found for the FSRQs (LN/LG = 2111), in good agreement with the current unified models. We confirm for the most luminous SSRQs the trend noted for the FSRQs between the host and nuclear luminosity. This trend supports the suggestion based on studies of lower redshift AGN, that there is a minimum host galaxy luminosity which increases linearly with the quasar luminosity. Finally, FSRQs seem to reside in richer environments than SSRQs, as evidenced by a larger number of close companion galaxies.
Key Words.:
Galaxies:active – Galaxies:nuclei – Infrared:galaxies – Quasars:general1 Introduction
Detailed studies of orientation-independent properties of quasars, such as their host galaxies and environments, are a fundamental tool to understand the quasar phenomenon, and AGN in general. Such studies can crucially test models which attempt to unify different observed classes of AGN either through evolution (e.g. Ellingson, Yee & Green 1991) or orientation (e.g. Antonucci 1993; Urry & Padovani 1995). They can shed light on whether interactions (as evidenced by close companions or disturbed morphology) are important for triggering and fueling of the quasar activity (e.g. Smith & Heckman 1990; Hutchings & Neff 1992). These studies allow one to investigate the possible reciprocal effect of the AGN on the properties and evolution of the hosts. Possible cosmological evolution of the AGN population (e.g. Small & Blandford 1992; Silk & Rees 1998) can be constrained by comparing the properties of the hosts and environments of AGN at different redshifts.
The host galaxies of low redshift (z 0.3) quasars have been thoroughly investigated using both ground-based imaging (e.g. McLeod & Rieke 1995; Taylor et al. 1996; Percival et al. 2000) and the Hubble Space Telescope (HST; e.g. Bahcall et al. 1997; Boyce et al. 1998; McLure et al. 1999). These investigations have shown that most quasars live in galaxies at least as bright as the Shechter function’s characteristic luminosity L∗ (e.g. Mobasher, Sharples & Ellis 1993). While most quasar host galaxies are brighter than L∗, and in many cases comparable to brightest cluster member galaxies (BCM; Thuan & Puschell 1989), some undetected or marginally detected hosts may be under-luminous. Recent morphological studies of host properties at low (e.g. Taylor et al. 1996; Percival et al. 2000) have concluded that while radio-loud quasars (RLQ) are found exclusively in giant elliptical galaxies, radio-quiet quasars (RQQ) reside in both elliptical and spiral (disc dominated) galaxies. It has been suggested that the morphological type may depend on the power of the quasar, with the most luminous quasars found only in spheroidal host galaxies (Taylor et al. 1996). Close companions have been found around many quasars (e.g. Hutchings 1995; Bahcall et al. 1997; Hutchings et al. 1999), some with signs of interaction, but the physical association has been confirmed only in some cases through spectroscopic measurements (e.g. Heckman et al. 1984; Ellingson et al. 1994; Canalizo & Stockman 1997).
Our knowledge of the host properties is basically limited to low redshift, because of the increasing difficulty of both resolving the quasar and the rapid cosmological dimming ( (1+z)4) of the host in contrast to the nucleus. At intermediate redshift (0.5 z 1), quasar hosts have been little investigated (e.g. Carballo et al. 1998; Rönnback et al. 1996). Recently, we studied in the near-infrared (NIR) the host galaxies of a complete sample of 20 flat spectrum radio quasars (FSRQ) (most of which are at 0.5 z 1) (Kotilainen, Falomo & Scarpa 1998; hereafter KFS98). We were able to resolve the host galaxy in a substantial fraction (50 %) of them and found these highly polarized quasars to reside in galaxies of M(H)–27.
While most FSRQs are characterized by rapid variability, high and variable polarization, high brightness temperatures, core–dominated radio emission and confirmed or suspected superluminal motion (e.g. Impey & Tapia 1990; Quirrenbach et al. 1992; Padovani & Urry 1992; Vermeulen & Cohen 1994), very few of these characteristics are shared by the more common steep spectrum radio quasars (SSRQ). This difference is usually explained in the unified model in terms of synchrotron radiation strongly relativistically beamed close to our line–of–sight in FSRQs, while SSRQs are viewed further away from the beaming axis (Blandford & Rees 1978).
We present here deep high spatial resolution (03 px-1, 1′′ FWHM seeing) NIR -band (1.65 m) imaging study of the host galaxies of a sample of SSRQs in the redshift range 0.5 z 1. We thus explore the host galaxies in the rest-frame 0.8 – 1.1 m, offering many advantages over the optical wavelengths, including larger host/nucleus contrast, negligible scattered light from the quasar, small K-correction and insignificant extinction (see KFS98 for details). For practically all the quasars in the sample we present the first high quality NIR imaging observations, and the first detection of the host galaxy.
| Name | Other name | z | (6-11 cm) | M(B) | log L(11 cm) | Date | I/Sa | T(exp) | FWHM | 6′′ ap. |
|---|---|---|---|---|---|---|---|---|---|---|
| (erg/sec) | (min.) | (arcsec) | (mag) | |||||||
| PKS 0056–00 | PHL 923 | 0.717 | 0.46 | –25.8 | 44.58 | 31/12/97 | I | 42 | 0.9 | 14.09 |
| 03/01/98 | I | 20 | 1.0 | 14.24 | ||||||
| PKS 0159–11 | 3C 57 | 0.669 | 0.61 | –26.6 | 44.53 | 30/12/97 | I | 48 | 0.9 | 13.08 |
| PKS 0349–14 | 3C 95 | 0.614 | 1.12 | –26.4 | 44.30 | 02/01/98 | I | 60 | 0.8 | 12.89 |
| PKS 0413–21 | 0.807 | 0.54 | –25.3 | 44.69 | 03/01/98 | I | 60 | 1.1 | 14.87 | |
| PKS 0414–06 | 3C 110 | 0.773 | 0.83 | –27.3 | 44.12 | 31/01/99 | S | 36 | 0.7 | 14.55 |
| PKS 0454–22 | 0.534 | 0.97 | –26.4 | 44.12 | 31/01/99 | S | 36 | 0.7 | 14.02 | |
| PKS 0518+16 | 3C 138 | 0.759 | 0.60 | –24.1 | 45.15 | 30/12/97 | I | 48 | 1.0 | 14.76 |
| 31/12/97 | I | 60 | 1.1 | 14.65 | ||||||
| PKS 0710+11 | 3C 175 | 0.768 | 1.03 | –26.4 | 44.47 | 02/01/98 | I | 42 | 1.0 | 13.09 |
| 03/01/98 | I | 64 | 1.0 | 13.14 | ||||||
| PKS 0825–20 | 0.822 | 0.76 | –25.8 | 44.78 | 30/12/97 | I | 64 | 1.0 | 14.29 | |
| 02/01/98 | I | 54 | 0.9 | 14.25 | ||||||
| PKS 0838+13 | 3C 207 | 0.684 | 0.35 | –24.6 | 44.51 | 01/02/99 | S | 54 | 0.9 | 15.92 |
| PKS 0855–19 | 0.660 | 0.04 | –24.4 | 44.11 | 31/01/99 | S | 48 | 0.7 | 15.44 | |
| PKS 0903–57 | 0.695 | 0.45 | –24.2 | 44.48 | 30/12/97 | I | 48 | 1.2 | 15.46 | |
| 31/12/97 | I | 60 | 1.0 | 15.60 | ||||||
| PKS 0959–443 | 0.837 | 0.08 | –26.8 | 44.42 | 31/01/99 | S | 48 | 0.8 | 14.68 | |
| PKS 1046–409 | 0.620 | 0.47 | –24.9 | 44.29 | 03/01/98 | I | 64 | 0.9 | 13.88 | |
| PKS 1116–46 | 0.713 | 0.35 | –26.0 | 44.51 | 31/01/99 | S | 48 | 0.6 | 15.90 | |
| PKS 1136–13 | 0.554 | 0.59 | –26.3 | 44.46 | 31/12/97 | I | 42 | 0.9 | 13.35 | |
| PKS 1237–10 | 0.750 | 0.00 | –25.4 | 44.54 | 31/01/99 | S | 52 | 0.7 | 16.04 | |
| PKS 1327–21 | 0.528 | 0.48 | –25.7 | 44.10 | 31/01/99 | S | 44 | 0.7 | 15.07 | |
| PKS 1335–06 | 0.625 | 0.97 | –25.2 | 44.44 | 31/01/99 | S | 18 | 0.8 | 16.40 | |
| 01/02/99 | S | 36 | 1.0 | 16.16 |
a: I = IRAC2, S = SOFI.


| sample | z | M(B) | (6–11 cm) | log L(11 cm) |
|---|---|---|---|---|
| SSRQ | 0.6910.092 | –25.70.9 | 0.560.32 | 44.450.25 |
| FSRQ | 0.7510.166 | –25.81.0 | 0.020.37 | 44.780.29 |
The SSRQ sample was chosen from the Véron-Cetty & Véron (1998) AGN catalogue to match the FSRQ sample (KFS98) in terms of redshift and optical and radio luminosity distribution, while keeping the two samples separated regarding the radio spectral index. The selection criteria applied were: 0.5 z 1.0, +20°, MB -24.0, (6-11 cm) 0, and L(11 cm) 1044 erg sec-1. This selection yielded a total of 54 SSRQs. Out of these, 33 were observable during the observing runs. A total of 19 SSRQs out of these were observed, and their general properties are given in Table 1. The properties of the SSRQ and FSRQ samples are compared in Fig. 1 and Table 2. The MB distribution is very similar for the two samples. The FSRQ sample has more high redshift quasars, but the average value is in agreement with the SSRQs. The samples are reasonably well separated in , although some overlap exists. Finally, there is a marked difference in the L(11 cm) distribution, in the sense that the FSRQ distribution extends to much higher radio luminosities than the SSRQ sample. This is due to the unfortunate circumstance that there were not enough very radio-luminous SSRQs available at the time of the observations. This caveat should be kept in mind in the following discussion.
The outline of the paper is as follows. In section 2, we briefly describe the observations, data reduction and the method of the analysis. Our results concerning the host galaxies and the nuclear component are given in section 3 and compared with the results for FSRQs. In section 4, we analyze the close environment of SSRQs and FSRQs and, finally, in section 5 summary and main conclusions of this study are drawn. In the Appendix, we give comments for individual quasars. Throughout this paper, H0 = 50 km s-1 Mpc-1 and q0 = 0 are used.
2 Observations, data reduction and modeling of the luminosity profiles
The observations were carried out during two observing runs. The first was at the 2.2m telescope of European Southern Observatory (ESO), La Silla, Chile, between 30 December 1997 and 3 January 1998, using the 256x256 px IRAC2 NIR camera (Moorwood et al. 1992) with pixel scale 0278 px-1, giving a field of view of 1.2 arcmin2. The second run was at the ESO 3.5m New Technology Telescope (NTT) on the nights of 31 January and 1 February 1999, using the 1024x1024 px SOFI NIR camera (Lidman & Cuby 1998), with pixel scale 0292 px-1, giving a field of view of 5.0 arcmin2. Details of the observations and NIR photometry are given in Table 1. The observations, data reduction and modeling of the luminosity profiles were performed following the procedure described in KFS98. Briefly, targets were always kept in the field by shifting them in a grid across the array, with typical offsets of 30′′. Individual exposures of 60 sec duration were coadded to achieve the final integration time reported in Table 1.
Data reduction, performed using IRAF111IRAF is distributed by the National Optical Astronomy Observatories, which are operated by the Association of Universities for Research in Astronomy, Inc., under cooperative agreement with the National Science Foundation., consisted of correction for bad pixels by interpolating across neighboring pixels, sky subtraction using a median averaged, scaled sky frame from all observations of a given target, flat-fielding using illuminated dome exposures, and combination of all images of the same target, using field stars or the centroid of the light distribution of the quasar as a reference point. Standard stars from Landolt (1992) were used for photometric calibration, for which we estimate an accuracy of 0.1 mag, based on comparison of multiple observations at different nights with IRAC2 as listed in Table 1. K–correction was applied to the host galaxy magnitudes following the method of Poggianti (1997). The applied K–correction for each quasar is reported in Table 3. This correction, insignificant at low redshift (m(H) = 0.03 at z = 0.2), has to be taken into account at moderate redshifts (m(H)0.14 at our median redshift of z = 0.65). No K–correction was applied to the nuclear component.
After masking all the regions around the target contaminated by companions, azimuthally averaged radial luminosity profiles were extracted for each quasar and field stars out to the background noise level, corresponding to a surface brightness of (H) = 23–24 mag arcsec-2. In the small field of view IRAC2 images, bright stars were present in the field of only a few quasars. For most quasars, the core of the PSF was derived from faint field stars, while the wing was derived from separate observation of a nearby bright star or extrapolated using a suitable Moffat (1969) function obtained from fitting bright stars in other frames of similar seeing during the same night. In the much larger field–of–view SOFI images, all quasars had bright stars in the field, enabling a good PSF determination.
The luminosity profiles were fitted into a point source (PSF) and a galaxy (de Vaucouleurs law, convolved with the PSF) component by an iterative least–squares fit to the observed profile. For these moderately high redshift quasars, data quality does not allow one to discriminate between elliptical and disk morphologies for the host galaxy, and the elliptical model was assumed, as demonstrated to be the case for low redshift RLQs (e.g. Taylor et al. 1996; Bahcall et al. 1997). For quasars with no host galaxy detection, we determined an upper limit to the brightness of the host galaxy by adding simulated “host galaxies” of various brightness to the observed profile until the simulated host became detectable within the errors of the luminosity profile. For a detailed discussion of potential error sources in this fitting procedure, see KFS98. We estimate the uncertainty of the derived host galaxy magnitudes to be 0.3 mag for the clearly detected hosts. For the marginally detected hosts, we can only assess a lower limit to the error margin as 0.5.
3 Results and discussion

![[Uncaptioned image]](/html/astro-ph/0008513/assets/x6.png)
Fig. 2. continued.
![[Uncaptioned image]](/html/astro-ph/0008513/assets/x8.png)
Fig. 3. continued.
| Name | z | K–corr. | r(e)/R(e) | m(H) | m(H) | L(n)/L(g) | M(H) | M(H) | Notea |
| mag | arcsec/kpc | nucleus | host | nucleus | host | ||||
| PKS 0056–00 | 0.717 | 0.17 | 14.1 | 16.7 | 12 | –29.7 | –27.0 | U | |
| PKS 0159–11 | 0.669 | 0.15 | 0.94/8.8 | 16.1 | 18.2 | 7.0 | –27.6 | –25.4 | M |
| PKS 0349–14 | 0.614 | 0.14 | 1.20/11.2 | 13.0 | 15.1 | 7.0 | –30.6 | –28.5 | R |
| PKS 0413–21 | 0.807 | 0.20 | 0.95/9.6 | 15.8 | 15.1 | 0.51 | –28.3 | –29.1 | R |
| PKS 0414–06 | 0.773 | 0.19 | 0.81/8.0 | 14.8 | 17.4 | 11.4 | –29.3 | –26.6 | R |
| PKS 0454–22 | 0.534 | 0.12 | 1.45/12.1 | 14.4 | 15.9 | 4.1 | –28.6 | –27.1 | R |
| PKS 0518+16 | 0.759 | 0.18 | 0.81/8.0 | 17.9 | 18.6 | 2.0 | –26.1 | –25.4 | M |
| PKS 0710+11 | 0.768 | 0.19 | 0.81/8.0 | 13.2 | 15.3 | 7.0 | –30.8 | –28.7 | M |
| PKS 0825–20 | 0.822 | 0.20 | 18.8 | 19.1 | 1.4 | –25.4 | –25.0 | U | |
| PKS 0838+13 | 0.684 | 0.15 | 0.95/8.9 | 16.3 | 17.5 | 3.0 | –27.4 | –26.2 | R |
| PKS 0855–19 | 0.660 | 0.14 | 1.00/9.3 | 15.7 | 17.5 | 5.1 | –27.9 | –26.1 | R |
| PKS 0903–57 | 0.695 | 0.16 | 0.45/4.3 | 14.9 | 16.5 | 4.3 | –28.9 | –27.3 | M |
| PKS 0959–44 | 0.837 | 0.21 | 1.08/11.1 | 14.9 | 16.9 | 6.1 | –29.4 | –27.4 | M |
| PKS 1046–40 | 0.620 | 0.14 | 0.70/6.3 | 14.4 | 14.6 | 1.3 | –29.0 | –28.8 | R |
| PKS 1116–46 | 0.713 | 0.17 | 0.95/9.1 | 16.3 | 17.4 | 2.8 | –27.5 | –26.4 | R |
| PKS 1136–13 | 0.554 | 0.12 | 13.5 | 15.6 | 7.6 | –29.7 | –27.5 | U | |
| PKS 1237–10 | 0.750 | 0.18 | 0.80/7.8 | 16.5 | 17.4 | 2.4 | –27.5 | –26.6 | R |
| PKS 1327–21 | 0.528 | 0.12 | 0.96/8.0 | 15.2 | 17.6 | 8.6 | –27.8 | –25.4 | M |
| PKS 1335–06 | 0.625 | 0.14 | 0.80/7.2 | 17.4 | 17.2 | 0.81 | –26.1 | –26.3 | R |
a R = resolved; M = marginally resolved; U = unresolved.
| Sample | filter | N | b | |||
|---|---|---|---|---|---|---|
| L∗ Mobasher et al. (1993) | K | 136 | 0.0770.030 | –25.00.2 | ||
| BCM Thuan & Puschell (1989) | H | 84 | 0.0740.026 | –26.30.3 | ||
| RLQ McLeod & Rieke (1994a) | H | 22 | 0.1030.029 | –25.10.5 | –24.90.6 | |
| RLQ McLeod & Rieke (1994b) | H | 23 | 0.1960.047 | –26.50.9 | –25.70.6 | |
| RLQ McLure et al. (1999) | R | 6 | 0.2190.029 | –26.80.7 | –26.40.3 | |
| RLQ Bahcall et al. (1997) | V | 6 | 0.2200.047 | –25.50.9 | –26.10.5 | |
| RLQ Taylor et al. (1996) | K | 13 | 0.2360.046 | –24.50.8 | –27.10.8 | –26.30.7 |
| RLQ Véron-Cetty & Woltjer (1990) | I | 20 | 0.3430.094 | –25.20.5 | –26.30.5 | |
| RLQ Hooper et al. (1997) | R | 6 | 0.4650.032 | –26.80.4 | –26.20.4 | |
| RLQ Lehnert et al. (1992) | K | 6 | 2.3420.319 | –30.51.0 | –28.81.1 | |
| RQQ Taylor et al. (1996) | K | 19 | 0.1570.062 | –23.80.6 | –26.10.9 | –25.70.7 |
| RQQ McLure et al. (1999) | R | 9 | 0.1690.033 | –25.51.9 | –25.80.5 | |
| RQQ Bahcall et al. (1997) | V | 14 | 0.1830.046 | –24.90.5 | –25.10.6 | |
| RQQ Percival et al. (2000) | K | 14 | 0.3570.057 | –25.60.8 | –28.00.8 | –24.90.5 |
| RQQ Hooper et al. (1997) | R | 10 | 0.4330.032 | –25.80.8 | –25.60.5 | |
| FSRQ/R+Ma (KFS98; 0.5z1.0) | H | 9 | 0.6710.157 | –26.21.1 | –29.70.8 | –26.71.2 |
| FSRQ/Ra (KFS98; 0.5z1.0) | H | 4 | 0.6730.141 | –25.91.3 | –30.20.7 | –27.80.3 |
| SSRQ/R+Ma | H | 16 | 0.6900.088 | –25.61.0 | –28.31.3 | –27.01.2 |
| SSRQ/Ra | H | 10 | 0.6830.077 | –25.60.9 | –28.21.2 | –27.21.1 |
a R = resolved; M = marginally resolved.
b Transformation of magnitudes to -band done assuming V–H = 3.0, R–H =
2.5 and H–K = 0.2 galaxy colours, and H0 = 50 km s-1 Mpc-1 and
q0 = 0.
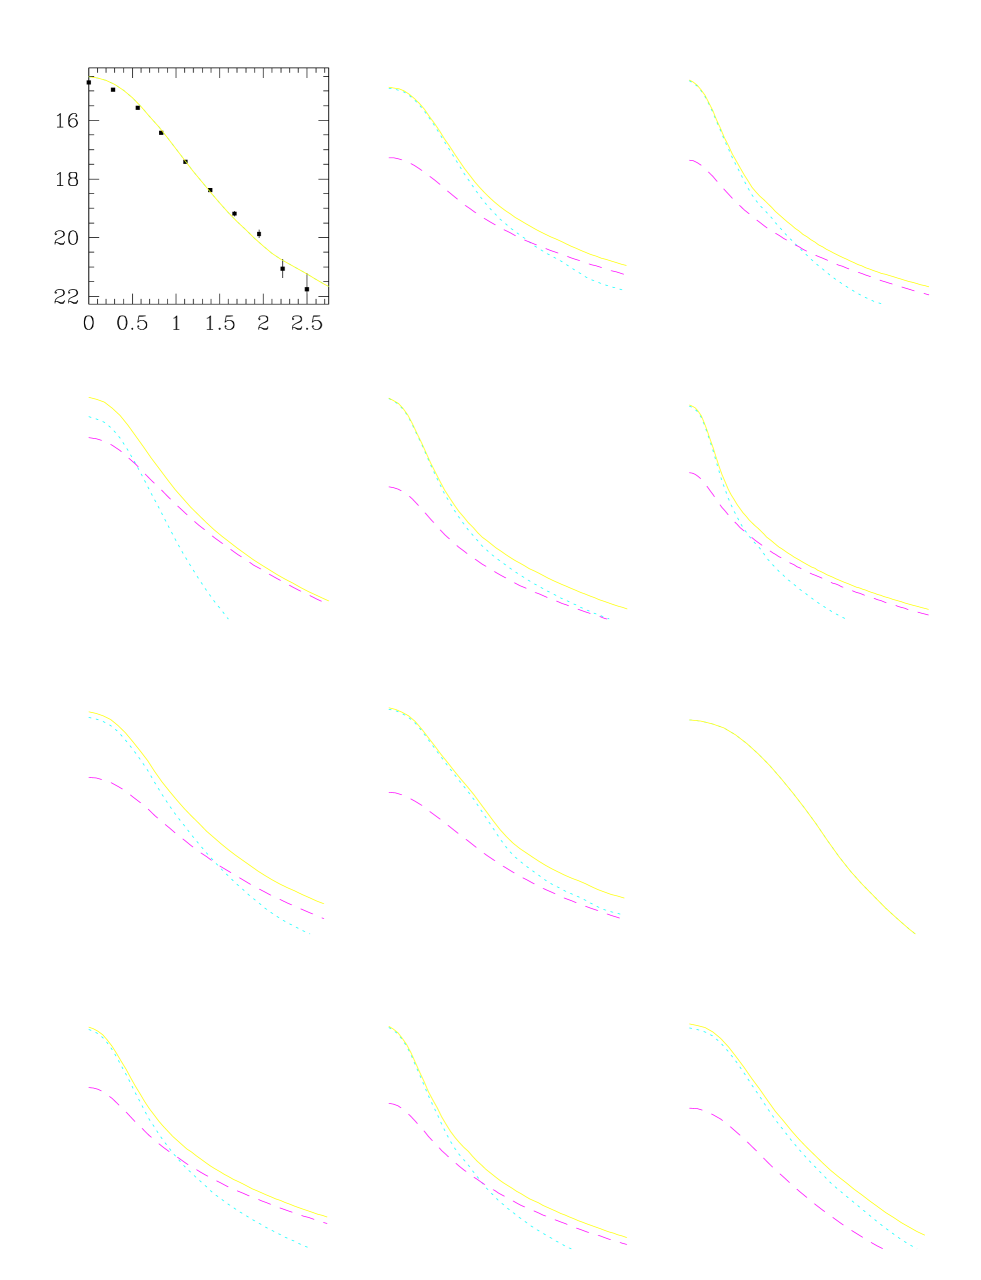
In Fig. 2, we show the -band contour plots of all the SSRQs, after smoothing the images with a Gaussian filter of = 1 px. In Fig. 3 we show the radial luminosity profiles of each quasar, with the best–fit decomposition overlaid. We detect the host galaxy clearly for 10 (53 %) SSRQs and marginally for 6 (32 %) more. The host remains unresolved for 3 (16 %) SSRQs. We summarize the best–fit model parameters of the profile fitting and the derived properties of the host galaxies in Table 3, where column (1) gives the name of the SSRQ, (2) the redshift, (3) the applied K–correction, (4) the scale-length of the host galaxy, (5) – (6) the apparent magnitude of the nucleus and the host, (7) the nucleus/host luminosity ratio, (8) – (9) the absolute magnitude of the nucleus and the host, and column (10) note about the detection of the host.
Table 4 presents a comparison of the -band absolute magnitudes of the SSRQ hosts with relevant samples from previous studies in the literature, for which we report the average values after correcting the published values for colour term and to our cosmology. In the Appendix, we compare our NIR photometry with the few previous studies, and discuss in more detail individual quasars, including comparison with the few previous optical/NIR determinations of the host galaxies.
3.1 The host galaxies

In Fig. 4 (upper panel) we investigate the location of the SSRQ and FSRQ hosts in the -band absolute magnitude vs. redshift diagram. In Fig. 4 (lower panel) we show the same diagram for the mean value of various samples of RLQ and RQQ hosts from the literature. The average -band absolute magnitude of the resolved SSRQ host galaxies is M(H) = –27.21.1 and the average bulge scale-length R(e) = 9.01.7 kpc, while the values after adding the marginally resolved hosts are M(H) = –27.01.2 and R(e) = 8.61.9 kpc. The SSRQ hosts are therefore large (all have R(e) 3 kpc, the empirical upper boundary found for normal local ellipticals by Capaccioli, Caon & D’Onofrio 1992), and very luminous, much brighter than the luminosity of an L∗ galaxy, which has M(H) = –25.00.3 (Mobasher et al. 1993). It is therefore evident that the SSRQ hosts are preferentially selected from the high–luminosity tail of the galaxy luminosity function (the derived upper limits for the unresolved hosts are also consistent with this; see Table 3). Indeed, we find no case of an SSRQ host with M(H) –25, indicating that for some reason these quasars cannot be hosted by a galaxy with L L∗, similarly to what was found by Taylor et al. (1996) for low redshift RLQs. Although there is a large spread, the SSRQ hosts are on average of similar luminosity to those of FSRQ hosts (KFS98).
There is a suggestion of a positive correlation of host luminosity with redshift (Fig. 4, lower panel) as the FSRQ and SSRQ hosts fall between the luminosities of lower redshift (M(H) –26) and higher redshift (M(H) –29) RLQs. This is consistent with what is expected from passive stellar evolution models for elliptical galaxies (e.g. Bressan et al. 1994; Fukugita, Shimasaku & Ichikawa 1995), and the evolution of galaxies in clusters (Ellingson et al. 1991), although the scatter is quite large. On the other hand, it is not consistent with models of hierarchical galaxy formation (e.g. Kaufmann & Hähnelt 2000), which predict L∗ hosts at z = 2 – 3 that afterwards undergo mergers to become present-day giant elliptical hosts. The detected correlation, therefore, suggests that major merging has already happened at z = 2 - 3. Also, this is consistent with the discovery of ellipticals with old stellar populations even at z2 (e.g. Spinrad et al. 1997; Stiavelli et al. 1999). However, this scenario seems not to be valid for RQQs, which show no or little evolution with redshift, as evidenced by the non-detection of high redshift RQQ hosts (Lowenthal et al. 1995).
On the other hand, the detected correlation can be interpreted as evidence for a relationship between optical and radio luminosities. Ledlow & Owen (1996) found such a correlation for radio galaxies and in the unified model (e.g. Urry & Padovani 1995), where RLQs and radio galaxies are identical objects seen from different viewing angles, this relationship is expected also to exist between the radio luminosities and host galaxy absolute magnitudes for RLQs at different redshifts.
Most of the available comparison data from literature are for low and intermediate redshift RLQs. These samples span a moderately large range in redshift from z0.1 up to z0.7, which is the average redshift of the SSRQ sample. The average host galaxy magnitudes for the various samples are given in Table 4 in order of increasing average redshift. Considering all these samples together gives average host magnitude of M(H) = –26.20.7. As can be seen from Fig. 4, there is no significant difference among the average values of these low z samples. The average M(H) = –27.01.2 for the SSRQ hosts is therefore 1 magnitude brighter than the luminosity of low z RLQ which suggests evolution in the host brightness with redshift, and/or a relationship of the host luminosity with the nuclear luminosity (see section 3.2).
It is worth to compare these data also with those for samples of low redshift RQQs extracted from the literature. The average host galaxy magnitudes for the various samples are given in Table 4. Considering all these RQQ samples together yields an average host magnitude of M(H) = –25.40.4, 1 magnitude fainter than comparable redshift RLQ hosts and 1.5 mag fainter than SSRQ hosts at intermediate redshift, indicating that RLQs and RQQs inhabit different types of galaxies. However, this difference may also be due to the above mentioned correlation between optical and radio luminosities (Ledlow & Owen 1996), in the sense that RQQ surveys select objects according to the optical luminosity, while RLQ surveys select objects with high radio luminosity and, therefore, a bright host galaxy.
Lehnert et al. (1992, 1999) have reported spatially resolved structures around RLQs at z1.5 and z2.3 that, if interpreted as host galaxies, would correspond to extremely luminous galaxies with average M(H) = –29.11.1, 2 mag brighter than the FSRQs and SSRQs at z0.7. However, within the scatter involved in these numbers, our results appear to be consistent with those of Lehnert et al., for the trend between the nuclear and host galaxy luminosities (see section 3.2), and is supporting evidence for the existence of a real upturn in the host luminosity occurring between z0.5 and z2, leading from LL* hosts at low redshift to the host galaxies of high redshift quasars that are several magnitudes brighter than L* (see Fig. 4). While this type of change is consistent with evolution of the stellar population in the elliptical hosts (as argued for high redshift RGs by Lilly & Longair 1984), or being intrinsic AGN luminosity effect (as argued for high redshift RGs by Eales et al. 1997), there are many caveats in this comparison, most notably differences in the intrinsic quasar luminosity of the various samples. In addition, optical and NIR imaging by Lowenthal et al. (1995) failed to detect extended emission in a sample of six RQQs at z2.3. Their upper limits (average m(H) 18.80.4 and M(H) -28.40.6) indicate that the RQQ hosts at high redshift must be 3 mag brighter than L* and 1 mag fainter than those found in the Lehnert et al. (1992) sample of RLQs at similar redshift and with roughly similar nuclear luminosity, again suggesting that RLQs and RQQs are different types of objects.

It is well established that elliptical galaxies form families of homologous systems with characteristic parameters R(e), (e) and velocity dispersion . These are commonly represented in the Fundamental Plane (e.g. Djorgovski & Davis 1987). These relations have been claimed to be related to the morphological and dynamical structure of the galaxies, and to their formation process. We have investigated the properties of the SSRQ and FSRQ hosts in the projected Fundamental Plane (F-P) concerning the effective surface brightness (e) and the effective radius R(e). Surface brightness (e) was corrected for Galactic extinction, K–correction and for the (1+z)4 cosmological dimming. Fig. 5 shows the correlation between (e) and log R(e) for the SSRQ and FSRQ hosts. It can be seen that the behavior of the SSRQ and FSRQ hosts are similar. Both follow the Kormendy (1977) relation for giant massive ellipticals (e.g. Capaccioli et al. 1992). No host galaxy is in the (scatter) area at log R(e) 0.5 kpc. This confirms that the SSRQ and FSRQ hosts are exclusively drawn from the population of giant ellipticals.
3.2 The nuclear component

The average absolute magnitude of the nuclear component for all SSRQs is M(H) = –28.21.2, that is 1.5 mag brighter than low redshift RLQ nuclei (average M(H) = –26.80.9) and 2 mag brighter than low redshift RQQ nuclei (average M(H) = –26.41.0). This is likely due to a selection effect present in the original samples induced by the different average redshift. On the other hand, the SSRQ nuclei are 1.5 mag fainter than the nuclei of FSRQs (KFS98; M(H) = –29.70.8) in the similar redshift range. This difference is even more evident when considering the nucleus/galaxy (LN/LG) luminosity ratio, shown in Fig. 6. The average LN/LG ratios are 3.83.2 and 2111 for the SSRQs and FSRQs, respectively. The large range in the luminosity ratio can be due to differences in the intrinsic nuclear or host luminosity, or a difference in the beaming factor from one object to another. Whereas the majority of the FSRQs have LN/LG 10 in the -band, only one SSRQ is above this limit, and the distribution of the LN/LG ratio for the SSRQs is similar to that of the low redshift RLQs (e.g. Taylor et al. 1996).
From Fig. 4 it appears that the host galaxies of the various samples are not dramatically different in intrinsic luminosity, especially if stellar evolution in the elliptical host galaxies is taken into account. Therefore, Fig. 6 clearly indicates that SSRQs exhibit a nuclear component which is systematically brighter than that of lower redshift RLQs and RQQs, but fainter than that of the FSRQs. This is consistent with the beaming model with larger Doppler amplification factor for FSRQs than SSRQs, that makes the observed differences understandable.

In Fig. 7, we show the relation between the luminosities of the nucleus and the host galaxy for the SSRQs and FSRQs. We confirm for the SSRQs the tendency noted for FSRQs by KFS98 for the more powerful quasars to reside in more luminous hosts, in the sense that there appears to be a lower limit to the host luminosity, which increases with the quasar luminosity. All the SSRQs and FSRQs appear consistent with this boundary limit, first proposed by McLeod & Rieke 1995).
Recent dynamical investigations of nearby galaxies have reported evidence for supermassive black holes in their nuclei (Kormendy & Richstone 1995; Magorrian et al. 1998). Assuming that quasar activity results from accretion of material onto a supermassive black hole, the nucleus-host relationship is in agreement with that found by Magorrian et al. (1998) from HST kinematic study between the mass (luminosity) of the black hole and the mass (luminosity) of the spheroidal component in nearby galaxies. Our results for SSRQs and FSRQs therefore suggest that the Magorrian et al. relationship extends to host galaxy masses at cosmological distances. On the other hand, the much weaker correlation found for more nearby, lower luminosity AGN (e.g. McLeod & Rieke 1995; McLeod, Rieke & Storrie-Lombardi 1999) may indicate that the onset of the correlation occurs only after a certain level in nuclear and/or galaxy luminosity has been reached. For example, at highest luminosities (highest black hole masses) quasars may accrete near the Eddington limit, triggering the onset of the host - black hole correlation (Lacy et al. 2000).
However, we advise caution about obvious selection effects that may de-populate the upper left hand (faint nuclei are difficult to detect against luminous hosts) and lower right hand (faint hosts are difficult to detect under luminous nuclei) corners of the diagram. Moreover, it is not clear if this boundary limit depends on the radio loudness since a recent investigation of luminous RQQs at z 0.3 (Percival et al. 2000) does not find any correlation between host and nuclear luminosities.
4 The close environment of SSRQs and FSRQs
| Name | z | Nr(50 kpc) | Nr(100 kpc) |
| FSRQs: | |||
| PKS 0336–019 | 0.852 | 0 | 1 |
| PKS 0403–123 | 0.571 | 0 | 3 |
| PKS 0405–123 | 0.574 | 0 | 2 |
| PKS 0420–014 | 0.915 | 0 | 0 |
| PKS 0440–003 | 0.844 | 1 | 1 |
| PKS 0454–463 | 0.858 | 1 | 1 |
| PKS 0605–085 | 0.872 | 0 | 1 |
| PKS 0637–752 | 0.654 | 1 | 1 |
| PKS 1055+018 | 0.888 | 0 | 3 |
| PKS 1253 | 0.538 | 0 | 0 |
| PKS 1504–166 | 0.876 | 0 | 0 |
| PKS 1954–388 | 0.626 | 0 | 3 |
| PKS 2128–123 | 0.501 | 0 | 1 |
| PKS 2145+067 | 0.990 | 0 | 0 |
| PKS 2243–123 | 0.630 | 0 | 1 |
| PKS 2345–167 | 0.576 | 0 | 1 |
| SSRQs: | |||
| PKS 0056–00 | 0.717 | 0 | 0 |
| PKS 0159–11 | 0.669 | 0 | 0 |
| PKS 0349–14 | 0.614 | 0 | 0 |
| PKS 0413–21 | 0.807 | 0 | 1 |
| PKS 0414–06 | 0.773 | 0 | 0 |
| PKS 0454–22 | 0.534 | 0 | 0 |
| PKS 0518+16 | 0.759 | 0 | 0 |
| PKS 0710+11 | 0.768 | 1 | 1 |
| PKS 0825–20 | 0.822 | 0 | 1 |
| PKS 0838+13 | 0.684 | 0 | 0 |
| PKS 0855–19 | 0.660 | 0 | 1 |
| PKS 0903–57 | 0.695 | 0 | 0 |
| PKS 0959–44 | 0.937 | 0 | 2 |
| PKS 1046–40 | 0.620 | 0 | 0 |
| PKS 1116–46 | 0.713 | 0 | 2 |
| PKS 1136–13 | 0.554 | 0 | 0 |
| PKS 1237–10 | 0.750 | 0 | 0 |
| PKS 1327–21 | 0.528 | 0 | 1 |
| PKS 1335–06 | 0.625 | 0 | 1 |
It has been noted in many previous studies of quasar environments (e.g. Yee & Green 1984; Stockton & MacKenty 1987; Hutchings & Neff 1990; Hutchings 1995; Hutchings et al. 1999) that quasars have often companions in their immediate environments and they are sometimes associated with disturbed morphology. Spectroscopy of these companions (e,g. Stockton 1978; Heckman et al. 1984) has shown that the companions are at the redshift of the quasar and are therefore physically associated. These observations have sustained the potentially important idea that nuclear activity can be triggered and/or fueled by strong tidal interactions and/or galaxy mergers (e.g. Heckman 1990)
Although both RLQs and RQQs seem to occur in dense groups of galaxies (and only rarely are located in rich galaxy clusters), a systematic difference of environment is found between RLQs and RQQs in the sense that the latter are generally found in poorer fields (e.g. Ellingson et al. 1991). There have also been some suggestions (Stockton 1978; Hutchings & Neff 1990) that FSRQs (and in general, core-dominated RLQs) have a smaller frequency of companions with respect to the more common SSRQs. These differences, if confirmed, are important for understanding the connection between the characteristics of the nuclear activity and the environment.
To investigate these differences, we have compared the frequency of companions found around the matched samples of SSRQs and FSRQs. For both samples, we have counted the number of resolved companion objects (i.e. galaxies) within a specified radius and brighter than m∗(H) + 2, where m∗(H) is the apparent magnitude corresponding to M∗(H) = –25 at the redshift of each quasar. This limit is in all frames at least 1 mag brighter than the magnitude limit of the images. To evaluate the number of companion galaxies around the quasars, we have chosen two radii corresponding to projected distances of 50 and 100 kpc. At the average redshift of 0.7 of the samples, 1 arcsec corresponds to 9.4 kpc. In Table 5 we give for each quasar the number of resolved companions N(r).
The average number of companions around FSRQs is 0.190.39 and 1.191.01 within 50 and 100 kpc projected distance from the quasar, respectively. The corresponding values for the SSRQs are 0.050.22 and 0.530.68. The fraction of FSRQs with no close companion is 81% and 25% within 50 and 100 kpc from the quasar, respectively, while the corresponding fractions for the SSRQs are 95% and 58%. Contrary to previous suggestions (Stockton 1978; Hutchings & Neff 1990), we find that the immediate environment of FSRQs is comparably rich (and possibly even richer) than that of SSRQs. This argues against a possible tight connection between the formation/evolution of the radio structure and the quasar galaxy environment.
5 Conclusions
We have presented near–infrared -band images of 19 SSRQs in the redshift range 0.5 z 1 with the aim of studying the quasar environment (host galaxies and companions) in comparison with our previously studied matched sample of FSRQs with respect to redshift and optical and radio luminosity. We are able to clearly detect the host galaxy in 10 (53 %) SSRQs and marginally in 6 (32 %) others, while the host remains unresolved in 3 (16 %) cases. The galaxies hosting the SSRQs are large (average bulge scale-length R(e) = 9.01.7 kpc) and luminous (average M(H) = -27.21.1). They are, therefore, 2 mag more luminous than the typical galaxy luminosity L* (M*(H) = –25.00.2), and 1 mag more luminous than the brightest cluster galaxies (M(H) = –26.30.3). The SSRQ hosts appear to have similar luminosity as those of the FSRQ hosts (M(H)–27). On the other hand, the average nucleus–to–galaxy luminosity ratio of SSRQs (LN/LG = 3.83.2) is significantly smaller than that found for the FSRQs (LN/LG = 2111), in agreement with the idea that the latter are beamed. We find for SSRQs a positive trend, noted earlier for the FSRQs, between the host and nuclear luminosity. Finally, we find that the number of close companion galaxies is not strongly influenced by the characteristics of radio emission. Comparable (and possibly larger in FSRQ) densities of companions are observed for FSRQs and SSRQs,
Acknowledgements.
This work was partly supported by the Italian Ministry for University and Research (MURST) under grants Cofin 98-02-32 and Cofin 98-02-15. This research has made use of the NASA/IPAC Extragalactic Database (NED), which is operated by the Jet Propulsion Laboratory, California Institute of Technology, under contract with the National Aeronautics and Space Administration.Appendix: Notes on individual quasars and comparison with previous NIR photometry.
PHL 923 = PKS 0056-00. The host remains unresolved with upper limit MH -27.0, assuming R(e) = 10 kpc.
3C 57 = PKS 0159-11. Hyland & Allen (1982) measured H = 14.78 in a 7 ′′ aperture, fainter than our H = 14.1 – 14.2. The profile fit is rather poor with PSF only ( = 3.7). Using a PSF + elliptical model results in a better fit ( = 1.0), but there remains excess emission with respect to the first 2 pixels, indicating a bad match with the PSF. The host is thus only marginally resolved with R(e) = 8.8 kpc and MH = –25.4.
3C 95 = PKS 0349-14. Neugebauer et al. (1979) measured H = 14.73 in a 7.5′′ aperture, fainter than our H = 12.9.
3C 110 = PKS 0414-06. Hyland & Allen (1982) measured H = 14.71, while Sun & Malkan (1989) measured H = 14.89, slightly fainter than our H = 14.6. This quasar was studied in the -band by Rönnback et al. (1996) who found it to be unresolved, with M(R) -20.9, whereas we resolved the host with M(H) = –26.6.
3C 138 = PKS 0518+16. The host galaxy is marginally resolved, with MH = -25.4 and Re = 8 kpc. This quasar was imaged with HST in the optical by De Vries et al. (1997), who claim it to be slightly extended (although they did not attempt any modelling).
3C 175 = PKS 0710+11. Simpson & Rawlings (2000) measured H = 14.720.01 in a 3 arcsec aperture, fainter than our H = 13.1. The host is marginally resolved with MH = –28.7 and re = 8 kpc. This quasar has not been resolved by previous ground-based optical studies (Malkan 1984; Hes, Barthel & Fosbury 1996) but is marginally resolved with HST (Lehnert et al. 1999), showing roughly E-W orientation and a plume to S-SE up to 2 arcsec from the nucleus.
PKS 0825-202. The host remains unresolved with M(host) –25.0.
3C 207 = PKS 0838+13. Simpson & Rawlings (2000) measured H = 16.110.04 in a 3 arcsec aperture, in agreement with our H = 15.9. This quasar was not resolved by HST (Lehnert et al. 1999).
PKS 0903-57. The profile fit is poor, resulting in a marginally resolved host with MH = -27.3 and Re = 4.3 kpc.
PKS 0959-443. The profile fit is poor with PSF only. The quasar is marginally resolved with a reasonably good PSF + elliptical fit, yielding MH = -27.4 and Re = 11.1 kpc. Note that there is a bright star close to the quasar, and although it was removed prior to the fit, the possible detection of a host galaxy needs to be approached with caution.
PKS 1116-46. This quasar was studied in the -band by Rönnback et al. (1996), who found it to be marginally resolved with M(R) = –23.0.
PKS 1136-138. The rather short exposure time for this quasar resulted in limiting surface brightness of only = 21. The quasar remains unresolved with a poor fit of the PSF in the center.
PKS 1327-21. Glass (1981) measured K = 14.280.24 in a 12′′ aperture, brighter than our H = 15.1. Again, the fit with the PSF does not match well in the central pixel. The quasar is marginally resolved with a reasonably good PSF + elliptical fit, with MH = -25.4 and Re = 8.0 kpc. Wyckoff, Wehringer & Gehren (1981) did not resolve the host in the optical with M(R) –21.9, whereas Véron-Cetty & Woltjer (1990) claim the host to be resolved with M(V) = –23.7.
PKS 1335-06. Romanishin & Hintzen (1989) resolved the host
galaxy in the optical with M(B) = -23.7 and R(e) = 7.2 kpc. The radio
morphology of this quasar is a bent triple with bridges connecting the
components (Price et al. 1993, Bogers et al. 1996). It appears that we have
detected NIR emission from the NW hot spot and its associated radio lobe, to
the NW and N of the quasar (Fig. 2). However, the SE hot spot
and lobe are not detected in our image.
References
Antonucci,R.R.J., 1993, ARA&A 31, 473
Bahcall,J.N., Kirhakos,S., Saxe,D.H., Schneider,D.P., 1997, ApJ 479, 642
Blandford.R.D., Rees,M.J., 1978, Pittsburgh Conference on BL Lac Objects (ed. A.M.Wolfe), 328
Bogers,W.J., Hes,R., Barthel,P.D., Zensus,J.A., 1996, A&AS 105, 91
Boyce,P.J., Disney,M.J., Blades,J.C. et al. 1998, MNRAS 298, 121
Bressan,A., Chiosi,C., Fagotto,F., 1994, ApJS 94, 63
Capaccioli,M., Caon,N., D’Onofrio,M., 1992, MNRAS 259, 323
Carballo,R., Sanchez,S.F., Gonzalez-Serrano,J.L., Benn,C.R., Vigotti,M., 1998, AJ 115, 1234
de Vries,W.H., O’Dea,C.P., Baum,S.A. et al., 1997, ApJS 110, 191
Djorgovski,S., Davis,M., 1987, ApJ 313, 59
Eales,S., Rawlings,S., Law–Green,D., Cotter,G., Lacy,M., 1997, MNRAS 291, 593
Ellingson,E., Yee,H.K.C., Green,R.F., 1991, ApJ 371, 49
Fukugita,M., Shimasaku,K., Ichikawa,T., 1995, PASP 107, 945
Glass,I.S., 1981, MNRAS 194, 795
Heckman,T.M., 1990, in IAU Colloquim 124, p. 359
Heckman,T.M., Bothun,G.D., Balick,B., Smith,E.P., 1984 AJ 89, 958
Hes,R., Barthel,P.D., Fosbury,R.A.E., 1996, A&A 313, 423
Hooper,E.J., Impey,C.D., Foltz,C.B., 1997, ApJ 480, L95
Hutchings,J.B., 1995, AJ 110, 994
Hutchings,J.B., Neff,S.G., 1990, AJ 99, 1715
Hutchings,J.B., Neff,S.G., 1992, AJ 104, 1
Hutchings,J.B., Crampton,D., Morris,S.L., Durand,D., Steinbring,E., 1999, AJ 117, 1109
Hyland,A.R., Allen,D.A., 1982, MNRAS 199, 943
Impey,C.D., Tapia,S., 1990, ApJ 354, 124
Kauffmann,G., Hähnelt,M., 2000, MNRAS 311, 576
Kormendy,J., 1977, ApJ 218, 333
Kormendy,J., Richstone,D., 1995, ARA&A 33, 581
Kotilainen,J.K., Falomo,R., Scarpa,R., 1998, A&A 332, 503 (KFS98)
Lacy,M., Bunker,A.C., Ridgway,S.E., 2000, AJ 120, 68
Landolt,A., 1992, AJ 104, 340
Ledlow,M.J., Owen,F.N., 1996, AJ 112, 9
Lehnert,M.D., Heckman,T.M., Chambers,K.C., Miley,G.K., 1992, ApJ 393, 68
Lehnert,M.D., Miley,G.K., Sparks,W.B., et al., 1999, ApJS 123, 351
Lidman,C., Cuby,J.G., 1998, SOFI User Manual, ESO
Lilly,S.J., Longair,M.S., 1984, MNRAS 211, 833
Lowenthal,J.D., Heckman,T.M., Lehnert,M.D., Elias,J.H., 1995, ApJ 439, 588
Magorrian,J., Tremaine,S., Richstone,D. et al., 1998, AJ 115, 2285
Malkan,M.A., 1984, ApJ 287, 555
McLeod,K.K., Rieke,G.H., 1994a, ApJ 420, 58
McLeod,K.K., Rieke,G.H., 1994b, ApJ 431, 137
McLeod,K.K., Rieke,G.H., 1995, ApJ 454, L77
McLeod,K.K., Rieke,G.H., Storrie-Lombardi,L.J., 1999, ApJ 511, L67
McLure,R.J., Dunlop,J.S., 2000, MNRAS, in press (astro-ph/9908214)
McLure,R.J., Kukula,M.J., Dunlop,J.S., et al., 1999, MNRAS 308, 377
Mobasher,B., Sharples,R.M., Ellis,R.S., 1993, MNRAS 263, 560
Moffat,A.F.J., A&A 3, 455
Moorwood,A.F.M. et al., 1992, ESO Messenger 69, 61
Neugebauer,G., Oke,J.B., Becklin,E.E., Matthews,K., 1979, ApJ 230, 79
Padovani,P., Urry,C.M., 1992, ApJ 387, 449
Percival,W.J., Miller,L., McLure,R.J., Dunlop,J.S., 2000, MNRAS, in press (astro-ph/0002199)
Poggianti,B.M., 1997, A&AS 122, 399
Price,R., Gower,A.C., Hutchings,J.B. et al., 1993, ApJS 86, 365
Quirrenbach,A. Witzel,A., Krichbaum,T.P. et al., 1992, A&A 258, 279
Romanishin,W., Hintzen,P., 1989, ApJ 341, 41
Rönnback,J., van Groningen,E., Wanders,I., Örndahl,E., 1996, MNRAS 283, 282
Silk,J., Rees,M.J., 1998, A&A 331, L1
Simpson,C., Rawlings,S., 2000, MNRAS, in press (astro-ph/0005570)
Small,T.A., Blandford,R.D., 1992, MNRAS 259, 725
Smith,E.P., Heckman,T.M., 1989, ApJ 341, 658
Spinrad,H., Dey,A., Stern,D., et al., 1997, ApJ 484, 581
Stiavelli,M., Treu,T., Carollo,C.M. et al., 1999, A&A 343, L25
Stockton,A., 1978, ApJ 223, 747
Stockton,A., MacKenty,J.W., 1987, ApJ 316, 584
Sun,W.H., Malkan,M.A., 1989, ApJ 346, 68
Taylor,G.L., Dunlop,J.S., Hughes,D.H., Robson,E.I., 1996, MNRAS 283, 930
Thuan,T.X., Puschell,J.J., 1989, ApJ 346, 34
Urry,C.M., Padovani,P., 1995, PASP 107, 803
Vermeulen,R.C., Cohen,M.H., 1994, ApJ 430, 467
Véron–Cetty,M–.P., Woltjer,L., 1990, A&A 236, 69
Véron–Cetty,M–.P., Véron,P., 1998, ESO Scientific Report
Wyckoff,S., Wehinger,P.A., Gehren,T., 1981, ApJ 247, 750
Yee,H.K.C., Green,R.F., 1984, ApJ 280, 79