Changing Molecular Gas Properties in the Bar and Center of NGC 7479
Abstract
We present sensitive interferometric 12CO, 13CO and HCN observations of the barred spiral galaxy NGC 7479, known to be one of the few barred galaxies with a continuous gas-filled bar. We focus on the investigation and interpretation of 12CO/13CO line intensity ratios , which is facilitated by having more than 90% of the flux in our interferometer maps. The global (9 kpc by 2.5 kpc) value of is high at 20 – 40. On smaller scales ( pc), is found to vary dramatically, reaching values in large parts of the bar, but dropping to values , typical for galactic disks, at a 13CO condensation in the southern part of the bar. We interpret these changes in terms of the relative importance of the contribution of a diffuse molecular component, characterized by unbound gas that has a moderate optical depth in the 12CO(10) transition. This component dominates the 12CO along the bar and is also likely to play an important role in the center of NGC 7479. In the center, the 12CO and the HCN intensity peaks coincide, while the 13CO peak is slightly offset. This can be explained in terms of high gas temperature at the 12CO peak position. Along the bar, the relation between the distribution of 12CO, 13CO, dust lanes and velocity gradient is complex. A southern 13CO condensation is found offset from the 12CO ridge that generally coincides with the most prominent dust lanes. It is possible that strong 13CO detections along the bar indicate quiescent conditions, downstream from the major bar shock. Still, these condensations are found close to high velocity gradients. In the central region, the velocity gradient is traced much more closely by 13CO than by 12CO.
Key Words.:
galaxies: individual: NGC 7479 - galaxies: ISM - galaxies: starburst - radio lines: galaxies1 Introduction
Bars are regarded as an important transport mechanism of material toward the central regions of galaxies, fuelling nuclear starbursts and driving galaxy evolution through the concentration of mass close to the nucleus (e.g. Sakamoto et al. saka+ (1999), Combes combes+ (1990) and references therein). To accomplish this, gas has to flow inward through the bar; however, long bars that are filled with dense gas that can be traced in CO are rare and thus likely transient. Among the few specimens known are NGC 1530 (Reynaud & Downes rendow (1998)), M 100 (Sempere & García-Burillo sem_ga (1997)), UGC 2855 (Hüttemeister et al. huette+ (1999)), NGC 2903 and NGC 3627 (Regan et al. regan+ (1999)). These bars differ significantly in their properties, i.e. velocity field, linewidth and derived shock structure. This is somewhat surprising, since the gas should in all cases be responding to a strong bar potential in a similar way. The dynamics of this response should then have consequences for the properties of the gas in the bar and the nucleus, e.g. produce a diffuse component unbound from clouds (e.g. Das & Jog dasjog (1995)). The evolutionary state of the bar and the degree of central mass concentration may be instrumental in regulating the conditions of the gas in the bar (see models by Athanassoula atha (1992)). More specifically, the gas is funnelled from outer -orbits to inner -orbits as the bar evolves in time (see e.g. the simulations by Friedli & Benz frie_be (1993)).
To better understand the gas flow, the star formation efficiency along the bar and the feeding of a starburst, it is essential to know the physical state of the gas both along the bar and in the central structure. An analysis based on more molecules than 12CO, the most abundant species after H2, is necessary to investigate gas properties and to go beyond the study of the morphological and kinematic structure of a system. Achieving this goal requires the detection and high-resolution mapping of very faint lines, observations which are at the sensitivity limit of today’s millimeter interferometers.
In this paper, we present such a study, carried out in one of the best known gas-rich barred galaxies. NGC 7479, classified a (mild) starburst SBb galaxy containing a LINER nucleus, has a gaseous bar of kpc projected length (for an assumed distance of Mpc, see Table 1), which has been repeatedly mapped in 12CO: Sempere et al. (sempere+ (1995)) present single dish data in the and transition. Interferometric maps have been obtained by Quillen et al. (quillen+ (1995)) and recently by Laine et al. (laine+ (1999)). Our results include the most sensitive 12CO map to date, but we focus on the relation of the 12CO emission to the first interferometric 13CO and HCN() data obtained in NGC 7479, and the physical state of the gas we can infer from the comparison of these molecules to the 12CO distribution. Preliminary results of this study were given in Aalto et al. (1997a ).
| R.A. (1950.0)a) | Dec (1950.0)a) | Distance | Typeb) | Size (blue)b) | PA diske) | PA bare) | |||
|---|---|---|---|---|---|---|---|---|---|
| 32 Mpc | SBb | 117c) | 44 34 | L⊙ | 25∘ | 5∘ |
a): Radio continuum peak position (Neff & Hutchings nefhut (1992),
VLA A-Array at 1.490 MHz)
b): from the UGC catalogue (Nilson nilson (1973))
c): from Groosbol (grosbol (1985)) : angle of inclination
d): from Sempere et al. (sempere+ (1995))
e): Position angle (north-to-east) of the disk major axis (see e.g. the UGC catalogue) and
the gaseous bar. The position angle of the stellar bar is even closer to
that of the disk major axis (Sempere et al. sempere+ (1995)).
2 Observations
2.1 Interferometric observations at OVRO
We have obtained interferometric maps of the transitions of 12CO, 13CO, HCN and in the inner 1′ (9 kpc) of NGC 7479 using the Caltech six-element Owens Valley Radio Observatory (OVRO) millimeter array. All observations were centered on the radio continuum peak. The quasar 3C454.5 was observed every min as a phase and amplitude calibrator. 3C345 was used as an additional passband calibrator, and flux calibration was done relative to the planets Neptune and Uranus. Calibration was done with the standard package developped for OVRO. Continuum emission with a peak flux of 3 – 4 mJy beam-1 has been subtracted from all maps.
The observations were carried out in the low resolution and equatorial configurations of the OVRO array between February and June 1996. The naturally weighted synthesized beam sizes are 46 425 for 12CO, 49 405 for 13CO and 72 52 for HCN. At =32 Mpc, equals 155 pc. The positional accuracy of structures in the maps is and thus considerably higher than the resolution. Due to the limited -coverage, the maps are not sensitive to structures larger than for CO and for HCN. On-source integration times were 7.2 hr for 12CO, 23.5 hr for 13CO and 11.5 hr for HCN.
The parameters of the observations are summarized in Table 2.
For a beamsize of , i.e. 12CO, a brightness temperature () of 1 K corresponds to 0.210 Jy beam-1 at a wavelength of 2.6 mm. The spectral resolution of our data is 4 MHz or 10.04 , and the total velocity range covered by the autocorrelator is 1120 , centered on = 2500 . For the final presentation, the data were smoothed to a velocity resolution of 20 (12CO and 13CO) or 40 (HCN).
Imaging was done using the NRAO AIPS package. For image display and analysis of the data cubes, the ATNF Karma package was also used.
| Line, (GHz) | Date | Field Center | -Coverage | Prim. Beam | Syn. Beam | Conf.a) | Noiseb) | |
|---|---|---|---|---|---|---|---|---|
| 12CO( | 2/96 | 6k – 46 k | 63′′ | L,E | K | 85 mK | ||
| 115.271 | 4/96 | (15m – 119m) | PA | |||||
| 13CO | 2/96, 3/96 | 5.7k – 44 k | 66′′ | L,E | K | 23 mK | ||
| 110.201 | 5/96, 6/96 | (15m – 119m) | PA | |||||
| HCN | 2/96 | 4.4k – 35 k | 80′′ | L,E | K | 12 mK | ||
| 88.632 | 5/96 | (15m – 119m) | PA |
: The array configurations we used at OVRO are labelled L (low
resolution) and E (equatorial)
: This is the rms noise per channel (20 for CO, 40 for
HCN). On a mJy beam-1-scale, the values correspond to 18 mJy beam-1(12CO),
and 5 mJy beam-1(13CO and HCN).
2.2 Single dish observations at OSO
Single dish spectra of the transitions of 12CO and 13CO were taken at the Onsala Space Observatory 20 m telescope in 1997. The central position of NGC 7479 was observed with a beamsize of 33′′ and system temperatures of 500 K – 600 K (12CO) and 200 K – 300 K (13CO). The spectra were smoothed to a velocity resolution of 30 .
3 Results
3.1 The Distribution of the 12CO Emission
3.1.1 Morphology and Central Kinematics
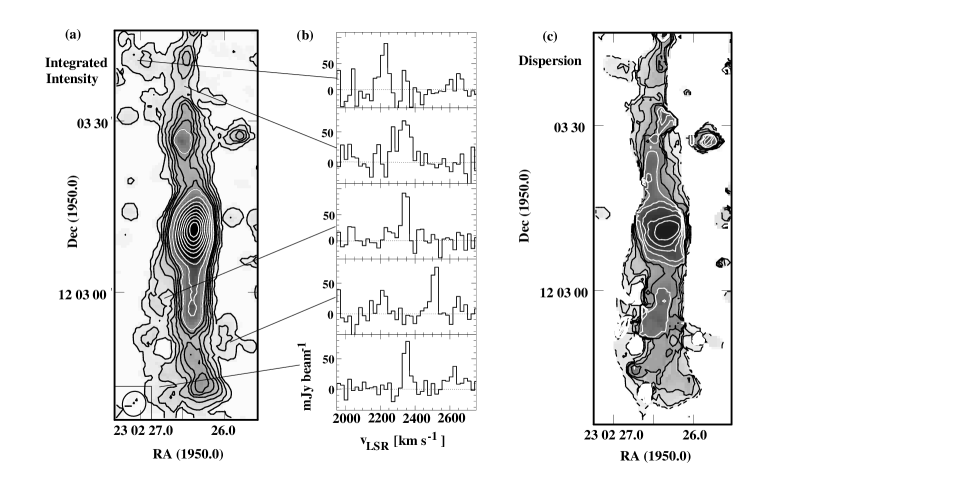
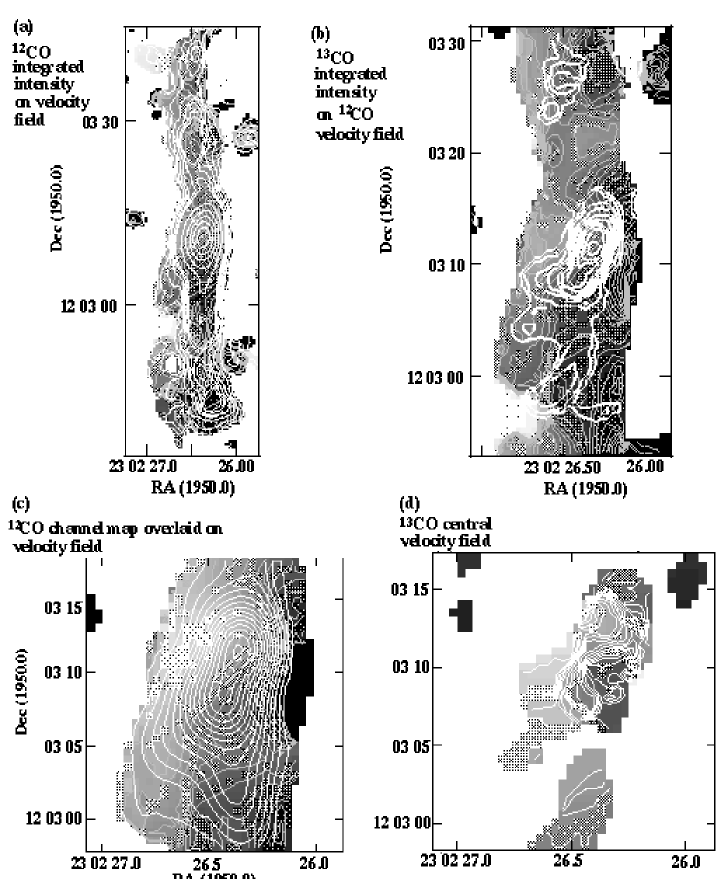
The 12CO distribution is displayed in Fig. 1a. It extends in one continuous structure over the whole length of the bar, with a number of secondary peaks along the bar axis. The total 12CO flux in the map is 380 Jy . The distribution has a central concentration with a (deconvolved) FWHM size of ( pc at =32 Mpc). This structure holds about 30 % of the total CO flux of the bar. The peak position is at and , coincident to within 10 with the radiocontinuum peak.
In Fig. 1b, we display some representative spectra from the outer parts of our 12CO map, regions where the confidence level of the integrated intensity maps (which refers to the full velocity width in the center of 400 ) drops below . The lines are clearly detected in these parts of the bar, but become very narrow. The same effect is evident from the dispersion map (Fig. 1c): The dispersion (calculated along the line-of-sight, ) falls off sharply toward the bar edges, but remains at 40 to 60 close to the major axis.
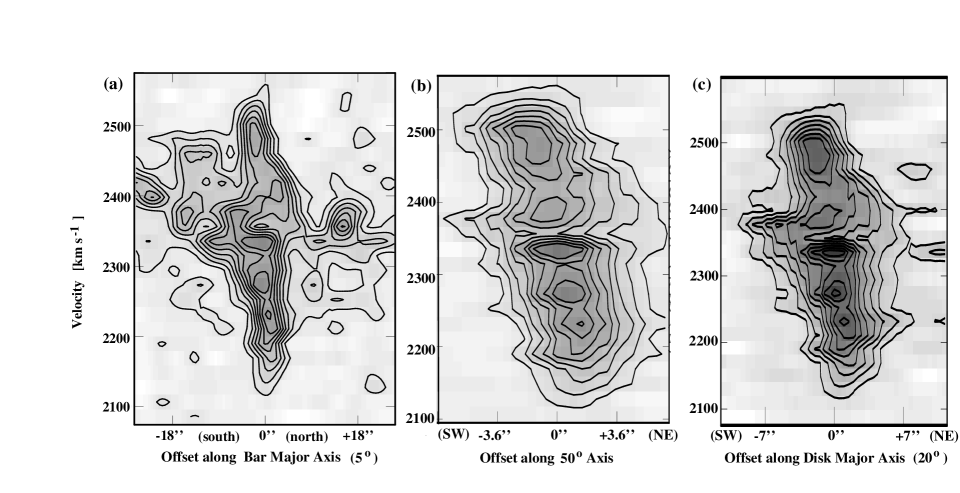
To show that the change in dispersion is not a result of projected rotation, we display position-velocity (pv) diagrams along the bar major axis (position angle (PA) 5∘, Fig. 2a) and the disk major axis (PA 25∘, Fig. 2c). The velocity width is not systematically larger along the disk major axis, where rotation should have the largest effect. Also, the regions of narrow lines are not associated with the disk minor axis. The only possible effect of rotation is a tentative alignment of the 60 to 80 velocity contours in the 12CO dispersion map (Fig. 1c and Fig. 4a) with the disk major axis.
There is no sign of a ‘twin peaks’ structure (as coined by Kenney et al. ken+ (1992)) perpendicular to the bar, perhaps suggesting that there are no antibar orbits, occuring within an Inner Lindblad resonance (ILR). However, the question of the existence of an ILR in NGC 7479 is controversial and remains undecided: Quillen et al. (quillen+ (1995)) derived the existence of an ILR close to the nucleus, while in the models of Sempere et al. (sempere+ (1995)) no ILR exists. Laine et al. (lai+2 (1998)) argue that the bar perturbation close to the center is so strong that the issue cannot be resolved without non-linear orbit analysis. In any case, the ILR would be located within 700 pc – 800 pc (4′′ – 5′′) from the nucleus; thus, we would barely resolve a ‘twin peak’ structure.
Another possible signature of an ILR is a ring of material close to its positions, due to the expected pile-up of gas in the collision region where and orbits intersect. Such a structure may be indicated in our map. There certainly is a clear peak not just in intensity but also in velocity dispersion (Fig. 1c) in the center. This dispersion peak fragments into a high velocity system, consisting of a number of clumps, as is evident from the pv diagrams we show in Fig. 2. This system is confined to within of the center and distinctly different from the material within the ‘main’ bar, where the velocity changes much more slowly, which is seen in panel (a), a cut along the major bar axis. The central rapidly rotating structure is most easily seen at a position angle close to (panel (b)). While there is a central peak (at ), this peak does not dominate the emission: other features at velocities ranging from 2200 to 2500 are almost as strong and spatially separated by .
A high velocity system like this is a signature feature of many barred galaxies. It has been used by Binney et al. (binney+ (1991)) to argue the presence of a central bar in our Galaxy. The orbits of the gas that can cause this feature have been modelled by e.g. García-Burillo & Guelin (gb (1995)) for the case of the weakly barred edge-on galaxy NGC 891. The structure found in NGC 7479 (already noted by Laine et al. laine+ (1999)) also greatly resembles the system seen in UGC 2855, a strongly barred galaxy where, in contrast to NGC 7479, quiescent conditions are found for the gas along the bar (Hüttemeister et al. huette+ (1999)). As in UGC 2855, the central high velocity system in NGC 7479 can be interpreted as a clumpy tilted ring or torus close to the ILR (which we would then place at from the nucleus), as a fragmented, tilted, rotating nuclear disk that is freely fed from material inflowing through the bar without being stopped at an ILR, or even as a dynamically decoupled inner bar, as tentatively suggested by Baker (baker (2000)).
3.1.2 Comparison with Prior 12CO Maps
The general morphological structure and velocity field of our map are in excellent agreement with the results reported by Laine et al. (laine+ (1999)). However, the 12CO emission in our map is a continuous bar structure, while the structure seen by Laine et al. breaks up into separate clumps away from the central condensation, a large part of the body of the bar being devoid of emission. As can be expected if the two maps are consistent, the position of these clumps is in exact agreement with the peaks we see embedded in more extended emission.
Comparing the total fluxes contained in the maps, we find that our flux is higher by a factor of 1.45 than that seen by Laine et al. This discrepancy is caused by our map being more sensitive by a factor of , due to a larger beam size combined with a slightly longer integration time. Thus, the larger East-West diameter of the bar seen in our map and its continuity are not artifacts of smearing by lower resolution, but real effects: Our map picks up an additional, more smoothly distributed gas component traced by 12CO. We can compare our total flux to the flux seen in the single dish map of Sempere et al. (sempere+ (1995)), which covered a larger area than our map. However, % of the flux is contained the region of the OVRO primary beam. We find that we recover more than 90% of this flux, which is consistent with Laine et al., who report recovering 60% of the single dish flux in their less sensitive map. Thus, there is very little, if any, missing flux in our 12CO map and we can analyse the complete molecular distribution as traced by 12CO at high resolution. This complete recovery of flux is the main distinguishing feature between our 12CO map and the interferometric maps published previously, both by Laine et al. and earlier by Quillen et al. (quillen+ (1995)).


3.2 Distribution of 13CO and HCN
Since 13CO and HCN usually originate from regions that are more compact and confined than 12CO emitting gas, we consider it very likely that we also recover the entire flux for those molecules, being limited only by sensitivity, not by missing zero-spacings in the interferometer map.
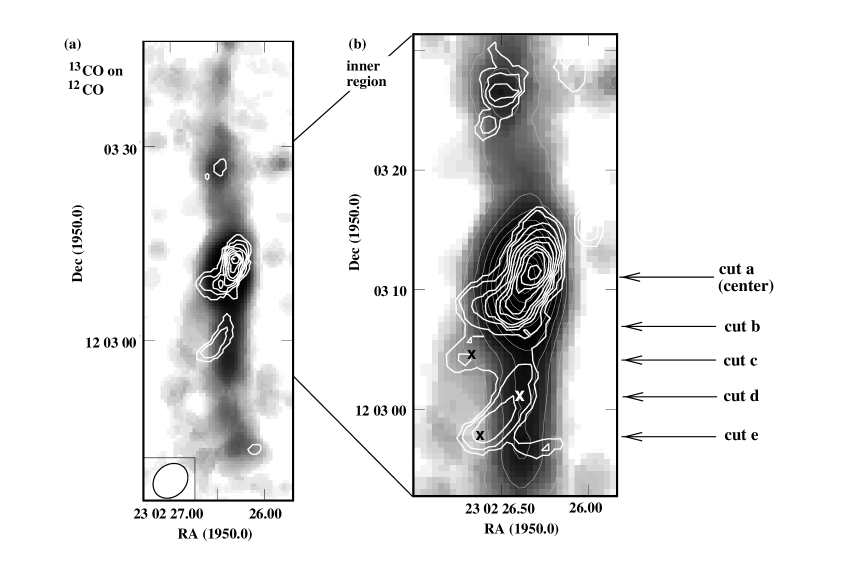
The distribution of the 13CO emission is presented in Fig. 3. While Fig. 3a gives the moment 0 map for the full central velocity of 400 (see Fig. 5), panel b is integrated over only 200 , so that very narrow lines are not lost in the noise. Now, a connection between the central distribution and the southern feature becomes apparent. The example spectra shown in Fig. 6 demonstrate the narrowness of these lines. The total 13CO flux we detect is Jy .
The 13CO emission is distributed very differently from the 12CO. The central 13CO peak is significantly offset to the north-west from the 12CO peak (by 2′′ or 320 pc in linear size).
While the 12CO distribution in the central concentration and south of the center along the bar runs almost exactly north-south, the central 13CO distribution is best described as extending along a position angle of , with a curvature toward the south-east (Fig 3). The deviation between the 12CO and 13CO morphology is even clearer in the southern 13CO extension at offsets to to the south along the bar.
No 13CO is seen at corresponding offset along in the northern part of the the bar.
The weak feature offset to the north, close to the bar end, has no southern counterpart, but is coincident with a peak in the 12CO distribution and thus likely to be real. Further peaks at the bar ends are not detected with at a sufficient confidence level, since these regions are close to the edges of our primary beam, and any emission may be affected by the fall-off in sensitivity as well as sidelobes of the central peak. One might expect to recover 13CO again close to the bar edges, due to the crowding of elliptical () streamlines, resulting in increased cloud collisions and the formation of dense shocked gas. Further high sensitivity studies are needed to clarify this point.
Still, very dramatic changes in the 12CO to 13CO line intensity ratio are evident, both in the central region and along the bar. These changes, which are indicators of changing gas properties, will be discussed in detail in the subsequent section.
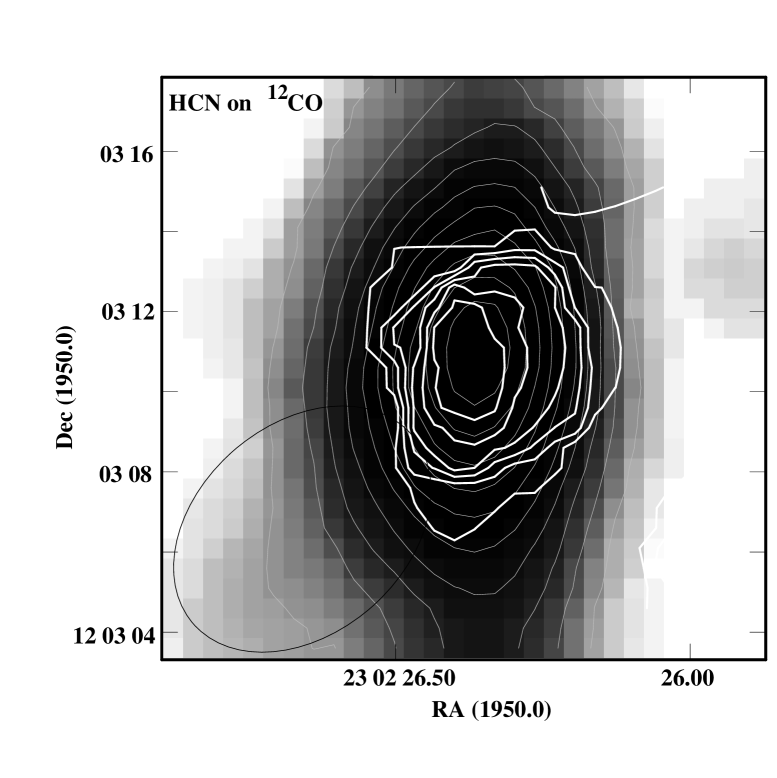
HCN is clearly detected only in the very center of the 12CO distribution (Fig. 7). It is unresolved and its position is consistent with the 12CO peak, i.e. offset from the maximum 13CO intensity. The total HCN flux in this central structure is 1.6 Jy kms .
3.3 Line intensity ratios

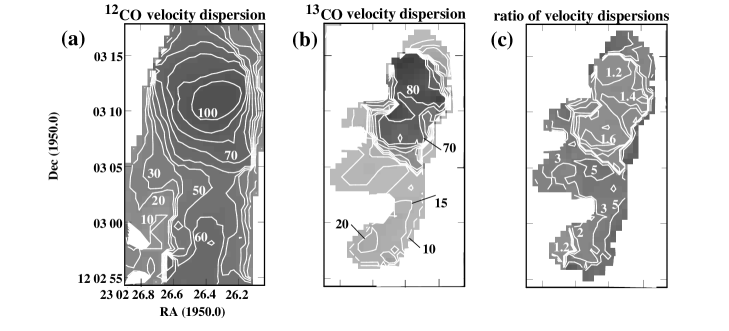
We present line intensity ratios taken between 12CO and 13CO () in different positions and over different areas in Table 3. In this table, we have computed and its errors individually for the peak intensity, the integrated intensity as measured within the velocity window where 13CO is detected and the velocity range within which we find 12CO emission. The respective velocity ranges are given along with the values of . Again, it is obvious that the 13CO line usually is narrower than the 12CO line, especially at and close to the 12CO peak region along the bar. Moving away from this peak, the 12CO linewidth drops and approaches that of 13CO (see the dispersion maps for 12CO and 13CO (Fig. 4) and the spectra displayed in Fig. 6). Especially from Fig. 4c), which displays the ratio of the 12CO and the 13CO velocity dispersion, it is clear that the velocity dispersion of 13CO always is smaller than the velocity dispersion of 13CO. The dispersions are similar (ratio ) in the central , where the 13CO line is fairly wide ( ) and in the southern 13CO concentration, where the 12CO transition becomes narrow ( ). The ratio of the dispersion is high (3 – 6) close to the 12CO peak region along the bar, where the 12CO line is wide, while the 13CO line is narrow.
The global 12CO/13CO intensity ratio, i.e. the ratio we find when comparing the total fluxes for the entire map, is quite high at , certainly much higher than what is typical for gas in galactic disks or even ‘normal’ galactic nuclei (see Table 3 for typical values). It is very unlikely that this ratio is an artifact of missing flux, since almost all flux in 12CO is seen and we do not expect to miss more flux in the the more compactly distributed 13CO. However, lack of sensitivity to 13CO is a concern.
To evaluate the possible magnitude of this effect, we assume that 13CO emission in a velocity range of 200 is present at the 2 level in all places where 12CO is detected and we do not find 13CO. This (unlikely) scenario would result in an additional flux of 10.8 Jy , i.e. roughly double our 13CO flux and bring the global ratio down from 42 to 19, which we thus regard as a firm lower limit. We have also estimated the global value of using the global spectra of 12CO and 13CO, i.e. spectra constructed for the entire spatial extent of 12CO emission. Here, 13CO is only tentatively detected. Using a 3 limit and a velocity range of 450 , we obtain a ratio of 30, in full agreement with the ratio determined using integrated fluxes.
| Integrated Ratios | |||||
| Position | Peak Ratio | Region of | Rangea) | Region of | Rangea) |
| 13CO line | [km s-1] | 12CO line | [km s-1] | ||
| global (bar and center) | – | 42b) | |||
| 12CO maximum intensity | 27(7) | 19(2) | 320 | 25(3) | 440 |
| 13CO maximum intensity | 16(6) | 18(2) | 320 | 23(3) | 440 |
| cent. cond. (average) | 22(8) | 22(4) | 400 | 23(4) | 440 |
| central region (OSO) | 19(4) | 21(3) | 390 | 28(4) | 500 |
| cent. cond. (individual) | 10 – 30c) | ||||
| Peak of cut b | 27(9) | 25(5) | 220 | 29(7) | 400 |
| 12CO peak of cut c | 19(5) | 17(4) | 60 | 40(15) | 340 |
| 13CO peak of cut c (east) | 6.4(1.6) | 10(2) | 105 | 14(4) | 200 |
| 12CO peak of cut d | 11(3) | 10(2) | 80 | 28(6) | 200 |
| 13CO peak of cut d | 4.7(2.2) | 5.1(2.4) | 80 | 17(3) | 180 |
| 12CO peak of cut e | 24(10) | 22(5) | 100 | 73(37) | 260 |
| 13CO peak of cut e | 3.5(1.4) | 3.5(0.6) | 100 | 3.5(0.6) | 100 |
| northern 13CO peak | 12(4) | 10(2) | 140 | 14(3) | 220 |
| no 13CO detections: | |||||
| offset +10′′ along bar | – | – | – | 15d) | 220 |
| offset along bar | – | – | – | 25d) | 280 |
| offset along bar | – | – | – | 25d) | 160 |
| galactic disk | 6e) | ||||
| centers of ‘normal’ galaxies | 13 | ||||
a) The velocity range gives the region where the 12CO or 13CO
line is detected above the noise.
b) Under extreme assumptions, this can be brought down to 20 (see text)
c) Range encountered in the central , both in peak and integrated
ratios
d) 3 limit calculated over the range where 12CO is visible.
e) Polk et al. polk+ (1988); f) Aalto et al. aalto+ (1995)
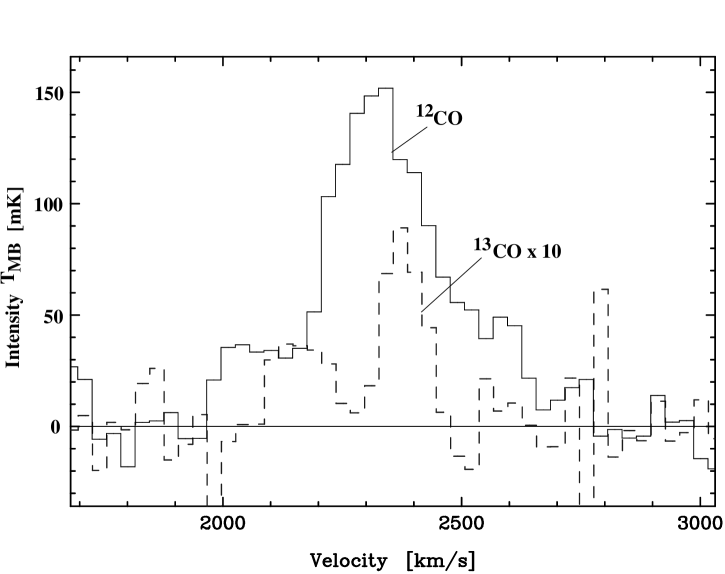
In the central condensation, the variation in goes along with the morphological shift described above. ranges from close to the 13CO ‘ridge’ to at distances of 5′′ or more from it. The average ratio over the central condensation is fully consistent with the ratio determined from the single dish spectra taken toward the central position (Fig. 8). Since we expect the central condensation to dominate the single dish flux in the central 33′′, this result confirms our prior conclusion that there is no missing flux in the interferometry maps.
The even more drastic variation of in the bar is evident from both Table 3 and Fig. 9. The latter presents another easy way of visualizing the changing line ratios. It shows cuts in integrated intensities (over a range of 450 , chosen to include all 12CO emission) along the bar minor axis at a number of offsets. Here, we focus on the southern 13CO extension. As the 13CO emission shifts eastward from 12CO when we move south along the bar, the line ratios change from values around 25 in the central condensation to (integrated intensity) at the 12CO maximum along the bar. The ratios calculated using the peak flux and the velocity range of the 13CO emission are often smaller than the referring to the velocity range of the 12CO line since in many places the 13CO lines are narrower than the 12CO lines. At the declination of the maximum of the southern 13CO distribution, drops from 7337 to 3.50.6 (integrated) or 2410 to 3.51.4 (peak) within ! Interestingly, in this position, off the 12CO peak, the widths of the two transitions are identical. These values of are put into perspective by noting that of 6 – 7 is typical for global ratios in galactic spiral arms (Polk et al. polk+ (1988)), which might already include the contribution of some diffuse gas, while Galactic GMCs typically show values of 3–5. An exceeding 30 is only seen in a few luminous mergers (Casoli et al. cas+ (1992), Aalto et al. aal2+ (1991)).
The central gas surface density of NGC 7479 ( pc-2, using the ‘standard’ CO to N(H2) conversion factor for comparison purposes only, see discussion below) is high enough to place the nuclear region in the range of IR-bright starburst galaxies (Scoville scoville (1991)), even though ultraluminous IR galaxies (ULIRGs) can have core gas surface densities up to an order of magnitude higher (e.g. Bryant & Scoville brysco (1999), who obtained exceeding 20000 pc-2 for NGC 2623, Mrk 231 and NGC 6240, assuming a standard conversion factor). However, the gas surface density in the bar of NGC 7479, where the most extreme values of are reached, is far smaller than in luminous starbursts, pointing to a different dominant mechanism accounting for the high value of .
The large changes of have to indicate a very significant change in the properties of the emitting gas, scenarios for which will be discussed below
HCN emission is detected only in the nucleus, with a 12CO/HCN line ratio .
4 Discussion
4.1 Gas Masses Based on CO Isotopomers
The total flux in our map would correspond to an H2 mass of M⊙ if the ‘standard’ CO to N(H2) conversion factor (SCF = cm-2 (K )-1, Strong et al. str+ (1988)) were applicable, which is, however, not the case (see discussion below). Instead of giving more masses based on the standard conversion factor, which are unlikely to be very meaningful, we compare the ‘standard’ mass derived from 12CO to masses from 13CO obtained with the simple LTE assumptions of optically thin emission and a kinetic gas temperature of 20 K. Globally, i.e. avaraged over the entire map, the 13CO-derived mass is a factor of 16 – 27 (for 12CO/13CO abundance ratios between 30 and 50) lower than the SCF mass. If the upper limit for the 13CO total flux (see below) is taken, the discrepancy decreases to 8 – 13, still remaining very substantial. A mass discrepancy of is also derived for the central condensation. In 12CO peaks along the bar, the disagreement between the SCF and the 13CO LTE mass reaches values exceeding 30, while in the 13CO maximum in the southern bar, it comes down to . Of course, these varying mass discrepancies simply reflect the changing line intensity ratios discussed above.
The SCF mass still exceeds the 13CO LTE mass by a factor 2 – 10 if the kinetic gas temperature is raised from 20 K to 100 K for the 13CO - based estimate. Only in the 13CO peak in the bar south of the central condensation the SCF mass drops to about half the 13CO LTE mass under these conditions, which are, of course, not realistic for a 13CO condensation, presumably consisting of dense gas. However, it seems that the SCF might be correct in this (and only in this) location, which has almost exactly the 12CO/13CO line ratio found in Galactic GMCs. This can be considered as a way to confirm the SCF for a normal spiral environment.
Of course, assuming LTE conditions when deriving (H2) from 13CO could underestimate the true (H2) when non-LTE conditions apply. Padoan et al. (pad+ (2000)) find a discrepancy of a factor 1.3 – 7 between ‘LTE masses’ and ‘true’ masses in their cloud models. This discrepancy is smaller than the difference between the 13CO LTE masses and the SCF masses we find both for the gas in the center and, even more pronounced, for the gas in 12CO peaks along the bar away from center. Still, the 13CO masses derived for LTE should be considered as a lower limit to the real mass, while the SCF masses are upper limits.
Simple non-LTE radiative transfer calculations (using the Large Velocity Gradient (LVG) assumption) reproduce the results of Padoan et al. to within roughly a factor of two and can thus serve as a guide to possible scenarios. These calculations show that the 12CO-to-H2 conversion factor can be brought down significantly (by a factor of ) in low density gas ( cm-3). Then, high 12CO/13CO 1 0 line intensity ratios of are predicted. Thus, this scenario points to the presence of ‘diffuse’ gas, discussed in detail in the next section.
When the density is reduced even further, in the LVG models the 12CO-to-H2 conversion factor rises again. The SCF can be recovered for a H2 density of cm-3, while remains high. We consider these extremely low densities required for the bulk of the gas unlikely for the following reasons: To reach a column density that is sufficient to ensure shielding of the molecules against UV radiation and to be consistent with the observed brightness of the lines, even for an extreme and very unlikely beam filling factor of unity, the models require an unrealistically low velocity dispersion for a given pathlength ( pc-1). This is in contradiction to the expectation that diffuse gas should be characterized by a large velocity dispersion (see below). Another argument against extremely low density gas is the expected very low 12CO(21)/(10) line intensity ratio (), in contradiction to single-dish (Sempere et al. sempere+ (1995)) and recent interferometric observations of 12CO(21) (Baker baker (2000)).
4.2 Physical Conditions – Diffuse Molecular Gas
In this section, we present simple scenarios that might explain the variations in . The key component of these scenarios is the presence of a diffuse or ‘intercloud’ molecular medium (ICM). This medium consists of low density ( cm-3), gravitationally unbound, molecular gas. For a given column density, , the 13CO 1 0 line emission from gravitationally unbound gas will be weaker than that from self-gravitating clouds, because the velocity dispersion, , is higher for unbound material and thus is lower for the unbound gas. A low results in a low optical depth and, in low-density gas, also results in a low excitation temperature of the transition because of reduced radiative trapping. Hence, the ICM will be difficult to detect in the 13CO line. One may see the ICM as somewhat analogous to high latitude molecular clouds detected in the disk of our Galaxy. These are also low density structures which, unlike most of the disk molecular clouds, are not in virial equilibrium.
While, under these conditions, 13CO is optically thin and subthermal, 12CO reaches a moderate optical depth close to unity. Thus, 12CO still radiates efficiently (and is self-shielding) while the 13CO intensity falls off. This moderate optical depth of the 12CO line is the main reason why the ‘standard’ conversion factor cannot be applied to regions where a significant amount of diffuse gas is found: the gas is neither optically thick nor virialized and the ‘standard’ overestimates the molecular gas mass by up to an order of magnitude. This situation is encountered, e.g., in our Galactic center (Dahmen et al. dah+ (1998)).
4.2.1 The Bar – Outside the Central 10′′ Diameter
The large variations in along the bar, with values ranging from 5 to (and even 73 in one extreme case) is best explained by the presence of a large amount of diffuse (thin, warm, unbound) ICM gas which dominates the 12CO 10 emission and is very distinctly different from the dense molecular clouds preferentially detected by 13CO. In the southern part of the bar, where 13CO is detected, the difference in linewidth is most dramatic close to the 12CO maxima. Here, the 12CO lines have a width of , compared to for 13CO. This explains the significant difference in depending on whether integrated or peak intensities are used (Table 3). The large linewidths of the 12CO spectra suggest large velocity dispersions at the 12CO maxima along the bar. This provides a strong argument in favour of a diffuse medium contrary to [12CO]/[13CO] abundance variations. While in a ‘standard’ 12CO emitting ISM, i.e. a medium where low 12CO lines are optically thick, the [12CO]/[13CO] abundance ratio is not traced by changes in , a change in the 13CO abundance itself could contribute to changes in . However, if such a variation reflects changes in [12C]/[13C] with galactocentric radius, it should not exceed a factor of two (Wilson & Matteucci wima (1992), Langer & Penzias lape (1990)). Even a gradient this small and insufficient to explain the observed changes in is almost impossible to maintain in the bar due to efficient mixing (see e.g. Friedli et al. frie+ (1994) for model calculations, Martin & Roy marroy (1994) and Zaritsky et al. zar+ (1994) for empirical studies). Thus, we consider diffuse gas to provide the only viable explanation for the large variations in we find along the bar of NGC 7479.
Of course, 13CO may be selectively photodissociated in the diffuse medium and thus really be underabundant, since it is not self-shielding. However, the efficiency of this mechanism also relies on the diffuse nature of the gas.
According to the single dish map of Sempere et al. (sempere+ (1995)), the 12CO(21)/(10) ratio along the bar is . This is, of course, a global value which is likely to vary at higher resolution. It is compatible with cold gas at moderate density ( cm-3) or warm, thin gas (density a few 100 cm-3). Given the evidence discussed aboved, we obviously favour the latter explanation for this line ratio.
The fact that the 13CO intensity maximum is clearly offset along the bar minor axis from the 12CO maximum in the southern bar indicates that 13CO traces a largely different component. The relation of the two tracers to dust, shocks and star formation will be discussed further in Section 4.3.
4.2.2 The Inner Region – Inside the Central 10′′
At first glance, the situation in the center of NGC 7479 might be taken to argue against the ICM scenario outlined above, since the HCN is coincident with the 12CO maximum and offset from 13CO. A situation like this was sometimes seen as suggesting abundance changes for the CO isotopomers (e.g. Casoli et al. cas+ (1992)), since HCN requires high gas densities of at least cm-3 to be significantly excited and may be identified with the region where most of the mass resides. In a turbulent environment like the nuclear region of NGC 7479, we consider the alternative explanation of a kinetic temperature gradient between the 13CO and HCN peaks to be more likely. For the high gas densities we expect in the central region (i.e. (H cm-3), the higher kinetic temperature would occur at the HCN peak rather than the 13CO peak because the brightness of the 13CO 10 line is a decreasing function of kinetic temperature (for temperatures above 8 K in the LTE, optically thin limit).
The HCN molecule has a high dipole moment and is thus much more sensitive to density variations than 12CO and 13CO. Thus the HCN peak is not expected to coincide with the 13CO peak if the latter is at lower densities than the HCN 10 critical density. This is true even if the HCN 10 transition is optically thin, due to the spreading of the molecules over many rotational levels that occurs at high densities (i.e. cm-3 for HCN) because of the high collision rates at these densities.
We can give an order-of-magnitude estimate of the gas density that is likely to occur at the HCN peak: Having the bulk of the gas in the central beam at densities of cm-3 requires a very low volume filling factor of , which seems unlikely in the center of a galaxy undergoing a mild starburst. Also, very high densities suggest a velocity dispersion per pathlength that is too high to be realistic (several 100 pc-1). If, on the other hand, the density was low enough for HCN to be subthermally excited, the HCN 10 line would be optically thick, because the molecules would pile up in the level. However, in this case (at peak densities of cm-3) we would expect the emission to be more widespread. Low densities close to cm-3 lead to very subthermal conditions and very weak HCN 10 emission. Thus, we consider cm-3 to be a reasonable density at the HCN peak.
In summary, since the HCN distribution is confined closely to the 12CO peak, we expect this region to also be a peak in density (but not necessarily in column density), in addition to being a peak in . In contrast, the 13CO 10 emission will preferentially trace cool and/or lower density gas.
A kinetic temperature gradient was also used to explain the different spatial extents of the 13CO(32) and HCN emission in NGC 253 (Wall et al. ww91 (1991)). The kinetic temperature gradient in NGC 7479 leads to the prediction that the 13CO(21)/(10) ratio should be higher in the HCN peak than in the 13CO peak, as is seen in the nucleus of IC 694 in the Arp 299 merger (Aalto et al. 1997b ). It also means that the nuclear 12CO(21)/12CO(10) ratio is expected to be high, at least close to unity; this seems to be the case (Baker baker (2000)). 13CO 21 observations will be crucial to further investigate the gas properties in the central 1.5 kpc of NGC 7479 and make comparisons to luminous mergers, where Casoli et al. (cas+ (1992)) and Taniguchi et al. (tani+ (1999)), based on data by Aalto et al. aalto+ (1995) and Casoli et al., have argued that 13CO 21 is also relatively faint and thus 13CO may be depressed, at least in some cases.
We note, however, 13CO 10 is not as faint at the 12CO maximum as under the extreme conditions of mergers: Fig. 5 shows the line to be as strong as HCN – it just peaks in a different position. The central 12CO/HCN line ratio of is on the high side if compared to the range found in the central region of a number of galaxies, where 10 is more typical; however the scatter is very large even among barred starburst spirals (Contini et al. con+ (1997)). Still, a value of 20 may be an indication that the amount of warm dense gas in the nuclear region of NGC 7479 is only moderate and confined to a small region.
Diffuse gas is likely to be also important even in the central condensation of NGC 7479. This is indicated by the high values reaches away from the curved ‘13CO- ridge’ in the central condensation. In these areas, the 13CO lines are much narrower than the 12CO transitions (150 – 300 for 12CO versus 50 – 80 for 13CO). These differences in line shape are also obvious from the global single dish spectra (Fig. 8).
Diffuse molecular gas has been detected in the centers of a large number of barred and starburst galaxies such as IC 342 (Downes et al. dow+ (1992)) or NGC 1808 (Aalto et al. aal94 (1994)) and, of course, in the bar region of the Milky Way (Dahmen et al. dah+ (1998)). It has also been detected in the center of the elliptical galaxy NGC 759 (Wiklind et al. wik+ (1997)) where a low line ratio of 0.4 is indicative of a two component medium made up of dense, cold clumps embedded in a warm, diffuse molecular medium. A scenario where 12CO and 13CO emission arises from separate components was suggested for IC 342 as early as 1990 by Wall & Jaffe. The idea that diffuse gas characterized by 12CO emission of moderate optical depth is important even in regions of extreme star formation, usually associated with large amounts of dense molecular gas, has recently gained credibility even for ultraluminous infrared galaxies (Aalto et al. aalto+ (1995), Downes & Solomon dowsol (1998)).
It is interesting to note that the 13CO ridge in the central condensation is precisely aligned with the steepest velocity gradient (derived from 12CO, Fig. 10).
4.3 Production of an ICM by tidal disruption and cloud collisions

Cloud disruption due to the tidal field along a bar is one mechanism that could produce a diffuse ICM, especially close to the central condensation. Another possible source of the ICM are off-center cloud collisions.
(i) Cloud evaporation due to the tidal field : As a bound cloud moves in a bar potential or elliptical orbit, the tidal field across it will vary in time. This produces both internal heating of the cloud and clump evaporation from the outer regions of the cloud (Das & Jog dasjog (1995)). The evaporated cloud mass will become part of the low density, molecular ICM, raising .
To get a lower estimate of how the tidal field changes over the bar, we first determined the potential of the galaxy from the deprojected K image data (Combes, private communication). The potential was azimuthally averaged to determine , which was fitted with a polynomial function that was used to derive a rotation curve for the galaxy. The mass to luminosity ratio was chosen so as to obtain the best fit of the derived rotation curve to that observed. We then used this azimuthally averaged potential to calculate the tidal field over the galaxy. Though this does not give the exact variation of the tidal field across a cloud in the bar potential, it will give a first appoximation as to how the tidal field varies. In Fig 11 we have plotted the tidal field per unit mass, across unit length, = against radial distance in kpc.
With a projected bar length of approximately 10.4 kpc and width 1.6 kpc (Fig. 1), an inclination angle of 41∘ and a position angle 25∘ for the bar (Sempere at al. sempere+ (1995)), the deprojected bar length is about 11 kpc and its width is about 2 kpc (Arnaboldi et al. arna+ (1995)). So at the semimajor axis distance of r=5.5 kpc, and at the semiminor axis distance of kpc, . Thus, the tidal field changes from being disruptive at the bar ends to compressive close to the bar center. This considerable change in tidal field, which is steepest in the central region, may produce significant cloud evaporation, thus leading to large amounts of diffuse gas.
(ii) Cloud Collisions: Hydrodynamic simulations have shown that off-center cloud collisions lead to gas being sheared off the colliding clouds, forming trailing extensions in the interstellar medium; the gas then dissipates into the ISM (Hausman haus (1981)). This gas may form part of the diffuse ICM. In bars, the crowding of closed orbits at the bar ends enhances the cloud collision frequency signigicantly and also produces shocked gas. Collisions also cause the clouds to lose angular momentum and sink inwards leading to the central buildup of gas. This increased concentration of gas in the centers of starburst galaxies and barred galaxies means the rate of formation of diffuse gas in these galaxies will also be high. NGC 7479 has a strong bar and may have undergone a recent minor merger (Laine & Heller laihel (1999)). Thus, the cloud collision rate should be high and there should be a considerable amount of diffuse gas in the central kpc.
Distinguishing between the two mechanisms observationally is not easy. The diffuse gas produced by cloud collisions may often be accompanied by shocked, dense gas. Tidally evaporated gas will not have this association. However, diffuse gas is expected to spread over the bar more quickly than dense gas, which will make it difficult to determine its origin. Still, in the future sensitive, high resolution observations of a shock tracer like SiO may be useful to decide this question.
4.4 The Relation between Tracers of Shocks and Star Formation
The S-shaped, complex velocity field of the gas in the bar of NGC 7479 (see Fig. 10) has been convincingly explained by e.g. Laine et al. (laine+ (1999)) as the result of gas streaming motions in a strong bar potential. They further argue that H, dust lanes, a large velocity gradient and strong 12CO emission more or less coincide. These are all taken to trace, in some sense, shocks, gas compression and star formation.
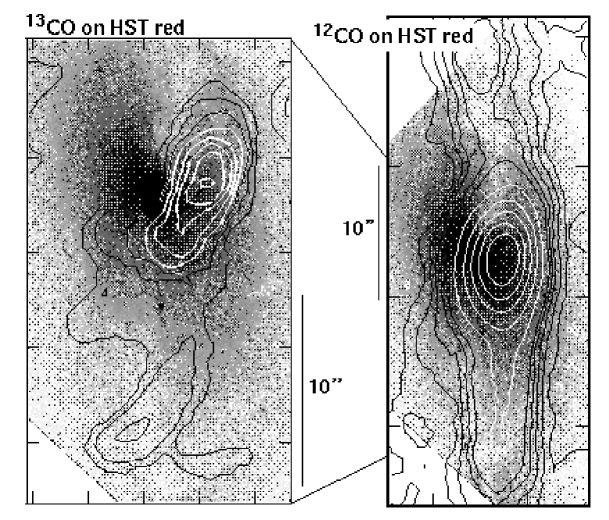
Including 13CO and the varying line ratios, indicative of at least two different components of molecular gas, (and seeing all the 12CO) leads to a more complex picture. In Fig. 12, we overlay the 12CO (right) and 13CO (left) intensity distributions on an HST red image retrieved from the archive. In the north, where no 13CO is detected outside the central region, 12CO follows the strong dust lane almost perfectly. In the south, the visual dust lane is weaker or more diffuse and the correlation with the 12CO distribution is much less evident. However, the southern 13CO peak coincides with a (faint) peak in a dust lane. South of the center, grows when we move upstream (west) across the bar (assuming that the spiral arms are trailing). In other words, the 13CO concentration is located downstream from the 12CO maximum, and possibly also downstream from the peak of the shock, if we identify the 12CO maximum with the shockfront. This may be justified by the close coincidence of the 12CO maximum with the optical dust lane in the north and also by the excellent agreement Laine et al. (laine+ (1999)) find between 12CO peaks (both in the north and in the south) and the maxima in a NIR color map that is an even better indicator of dust than an optical image.
In the central concentration, the course of the dust lanes is not clear. However, here it is the 13CO that very clearly follows the steepest velocity gradient (Fig. 10b), while 12CO is distributed fairly independently of the velocity gradient. 12CO-emitting gas at a velocity between 2280 and 2340 traces the velocity gradient somewhat more closely than gas at other velocities (Fig. 10c), but even in this restricted velocity range the 12CO emission does not follow the velocity field as clearly as the 13CO emission does. A number of spectra from the central 15′′ have their emission peak close to 2300 , and a narrow emission component may be associated with this peak (faintly visible in Fig. 4).
The velocity field based on 13CO is displayed in Fig. 10d). It is even more dramatically S-shaped than the 12CO velocity field. We further note that the 12CO velocity field determined by Laine et al. closely resembles our 13CO velocity field, and that their 12CO distribution in the central 15′′ appears more bent than ours.
This evidence leads us to the following scenario: The 13CO emission and a part of the 12CO emission, especially at mid-velocities, traces dense or at least high column density gas that follows the velocity field and is compressed in the region with the steepest velocity gradient. We suspect that this region coincides with the central dust lane, which is, however, not clearly visible in the HST image. In terms of 12CO emissivity, this gas component is not dominant enough to clearly reduce . Also, the dust lane may be fairly narrow and unresolved in our data. Thus, this component is seen most clearly in the 13CO data, but Laine et al. also trace it in 12CO since they are not sensitive to much of the extended emsission. The 12CO and 13CO distributions in our maps deviate because the 12CO emission, especially but not exclusively at non-central velocities, is due to diffuse gas that is far less confined to the shock region in the central (. The dramatic S-shape in the 13CO velocity field (Fig. 10d) indicates that the strong inner bar of NGC 7479 is the feature dominating the kinematics of the denser gas in this central region. As discussed earlier (Fig. 2), a rotating disk or gas on -orbits, perpendicular to the main bar axis, is interacting with the bar on the scale of a few hundred pc at the very center.
It is conceivable that the diffuse gas rises to higher altitudes above the plane of the galaxy than the dense gas, which may be less turbulent and more strongly dominated by the bar potential, which is defined by the stellar potential, since most of the dynamical mass is almost certain to be in the form of stars.
Outside the central 2 kpc, the relation between the various tracers changes: both the detached northern and the southern 13CO peaks are found close to, but not coincident with, regions of steep velocity gradients (Fig. 10). The dust lane (and presumably the region of the strongest shock) is now traced well by the 12CO emission. Possibly, the larger overall amount of gas in the central 2 kpc allows a diffuse component to spread throughout this region, while in the outer bar the gas associated with the shock remains diffuse.
It seems possible that the 13CO peaks in the outer bar indicate conditions that are more quiescent and favourable to the formation of bound clouds and ultimately star formation activity. The low value of in these complexes suggests that their properties are similar to GMCs in the spiral arms of normal galaxies. The cuts presented by Sempere et al. (sempere+ (1995)) indicate that the H emission peaks along with the 13CO in the southern condensation, i.e. is offset from the 12CO and main dust lane in this area. If the H traces star formation, this shift away from a region that seems to be totally dominated by diffuse gas may reflect that star formation occurs wherever the gas density is high enough, while the proximity to the shock front may play a secondary role. The fact that the 13CO condensations are close to (offset ) strong (12CO) velocity gradients need not be a contradiction to quiescent conditions. The peaks of the condensations are downstream of the strongest gradient by several hundred pc. In addition, the interiors of the condensations could be quiescent while the condensations themselves are following a strong overall large-scale flow. This question, however, requires further study on smaller spatial scales.
Offsets between molecular gas concentrations and dust lanes have recently been reported by Rand et al. (rand+ (1999)) for a part of a spiral arm in M 83. They used 12CO as a tracer, but see only 2% – 5% of the single dish flux in their interferometer map. Thus, they probably filter out the diffuse component, so their 12CO data might trace a dense, clumpy component similar to what we see in 13CO.
5 Conclusions
We have mapped the barred spiral galaxy interferometrically in the transitions of 12CO, 13CO and HCN. Our main results are as follows:
-
1.
The 12CO map shows a continuous gas distribution all allong the bar. Comparison to single dish observation shows that the interferometer does not miss a significant amount of flux. The velocity field derived from the 12CO map is complex, showing the S-shaped isovelocity contours typical of noncircular gas orbits in a strong bar.
-
2.
A high velocity feature is identified close to the center. This may be a ring associated with an Inner Lindblad resonance, a tilted rotating disk fed directly by mass infall along the bar or even an inner bar decoupled from the main bar.
-
3.
13CO emission is detected in the central condensation, the southern part of the bar and a single location in the northern part of the bar. HCN emission is only detected from the center. The 13CO central emission is offset by from the 12CO and HCN intensity maxima, which are coincident. Along the bar, the most prominent peak of southern 13CO condensation is also clearly offset from the 12CO distribution.
-
4.
The 12CO/13CO line intensity ratio, , varies dramatically. Globally (9 kpc 2.5 kpc), is 20 – 40, a high value compared to typical ratios found in the disk component of galaxies or even central regions of normal galaxies. This indicates a prominent contribution of diffuse, unbound molecular gas with a moderate optical depth in the 12CO(10) transition in both the bar and the center of NGC 7479.
-
5.
On smaller sizescales of pc, exceeds 30 in large parts of the bar, reaching values usually found in starburst mergers. Since values as low as 5 are also found in the bar, close to the 13CO condensation, and since a bar environment is very well mixed, we discard an underabundance of the 13C isotope as a possible explanation of the very high found in many places. Instead, this is explained by a dominant component of diffuse gas, readily produced by either tidal disruption or cloud collisions in the bar potential. The large variation in is reflected by large changes of likely values of the conversion factor from 12CO intensity ro H2 column density. In the central 1.5 kpc, the Galactic ‘standard’ conversion factor (SCF) overestimates the gas mass by a factor of up to 10; in 12CO peaks along the bar the discrepancy is even larger. Only in a 13CO complex in the bar we find the SCF to be correct.
-
6.
The offset in the central HCN (and 12CO) peak from the 13CO peak can be attributed to a gradient in kinetic temperature in which the highest gas kinetic temperature is at the position of the HCN peak. This leads to the prediction that the 13CO(21)/(10) intensity ratio should be higher at the HCN peak than at the 13CO peak.
-
7.
The region along the bar where is small might be an area where the conditions are more quiescent, which is also indicated by the narrowness of the lines, both in 12CO and 13CO, found here. If the 12CO ridge along the bar, which coincides closely with the dust lanes, is taken to be the location of the bar shock, the 13CO condensation is behind or downstream this shock, possibly in a region where the disrupted (but also compressed) gas emerging from the shock can form bound molecular complexes. However, the region where the velocity gradient is steepest along the bar does not coincide exactly with either the 12CO or the 13CO distribution. In the center, 13CO traces the steepest velocity gradient much more closely than 12CO. Thus, the relation between the molecular tracers and the shock is complex.
Acknowledgements.
The OVRO mm-array is supported in part by NSF grant AST 9314079 and the K.T. and E.L. Norris Foundation.References
- (1) Aalto S., Black J.H., Johansson L.E.B., Booth R.S., 1991, A&A 249, 323
- (2) Aalto S., Booth R.S., Black J.H., et al., 1994, A&A 286, 365
- (3) Aalto S., Booth R.S., Black J.H., Johansson L.E.B., 1995, A&A 300, 369
- (4) Aalto S., Hüttemeister S., Das M., Wall W.F., 1997, in: The central regions of the Galaxy and galaxies, ed. Y. Sofue (IAU Coll. 184), p. 251
- (5) Aalto S., Radford S., Scoville N.Z., Sargent A., 1997, in: Galaxy interactions at low and high redshifts (IAU Coll. 186), P. 70
- (6) Arnaboldi M., Capacciolo, Capellaro E., et al., 1995, AJ 110, 199
- (7) Athanassoula E., 1992, MNRAS 259, 345
- (8) Baker A., 2000, PhD Thesis, California Institute of Technology
- (9) Binney J., Gerhard O.E., Stark A.A., et al., 1991, MNRAS 252, 210
- (10) Bryant P.M., Scoville N.Z., 1999, AJ 117, 2632
- (11) Casoli F., Dupraz C., Combes F., 1992, 264, 55
- (12) Combes F., Dupraz C., Gerin M, 1990, in: Dynamics and Interactions of Galaxies, ed. R. Wielen (Berlin, Springer), p. 305
- (13) Contini T., Wozniak H., Considere S., Davoust E., 1997, A&A 314, L5
- (14) Dahmen G., Hüttemeister S., Wilson T.L., Mauersberger R., 1998, A&A 331, 959
- (15) Das M., Jog C.J., 1995, ApJ 451, 167
- (16) Downes D., Solomon P.M., 1998, ApJ 507, 615
- (17) Downes D., Radford S., Guilloteau S., et al., 1992, A&A 262, 424
- (18) Friedli D., Benz W., 1993, A&A 268, 65
- (19) Friedli D., Benz W., Kennicutt R., 1994, ApJ 430, L105
- (20) García-Burillo S., Guélin M., 1995, A&A 299, 657
- (21) Groosbol P.J., 1985, A&AS 60, 261
- (22) Hausman M.A., 1981, ApJ 245, 72
- (23) Hüttemeister S., Aalto S., Wall W.F., 1999, A&A 346, 45
- (24) Kenney J.D.P., Wilson C.D., Scoville N.Z., et al., 1992, ApJ 395, L79
- (25) Laine S., Heller C.H., 1999, MNRAS 308, 557
- (26) Laine S., Shlosman I., Heller C.H., 1998, MNRAS 297, 1052
- (27) Laine S., Kenney J.D.P., Yun M.S., Gottesman S.T., 1999, ApJ 511, 709
- (28) Langer W.D., Penzias A.A., 1990, ApJ 357, 477
- (29) Martin P., Roy J.-R., 1994, ApJ 424, 599
- (30) Neff S.G., Hutchings J.B., 1992, AJ 103, 1746
- (31) Nilson P., 1973, Uppsala Ganeral Catalogue of Galaxies, Acta Universitatis Upsaliensis, Nova Regiae Societatis Upsaliensis, Series V: A Vol. 1
- (32) Padoan P., Juvela M., Bally J., Nordlund A., 2000, ApJ 529, 259
- (33) Polk K.S., Knapp G.R., Stark A.A., Wilson R.W., 1988, ApJ 332, 432
- (34) Quillen A.C., Frogel J.A., Kenney J.D.P., et al., 1995, ApJ 441, 549
- (35) Rand R.J., Lord S.D., Higdon J.L., 1999, ApJ 513, 720
- (36) Regan M.W., Sheth K., Vogel S.N., 1999, ApJ 526, 97
- (37) Reynaud D., Downes D., 1998, A&A 337, 671
- (38) Sakamoto K., Okumura S.K., Ishizuki S., Scoville N.Z., 1999, ApJ 525, 691
- (39) Scoville N.Z., 1991, In: Combes F., Casoli F. (eds.) Dynamics of galaxies and their molecular cloud distributions. IAU Symp. 146, p. 315
- (40) Sempere M.J., García-Burillo S., 1997, A&A 325, 769
- (41) Sempere M.J., Combes F., Casoli F., 1995, A&A 299, 371
- (42) Strong A.W., Bloemen J.B.G.M., Dame T.M., et al., 1988, A&A 207, 1
- (43) Taniguchi Y., Ohyama Y., Sanders D.B., 1999, ApJ 522, 214
- (44) Wall W.F., Jaffe D., 1990, ApJ 361, L45
- (45) Wall W.F., Jaffe D.T., Bash F.N., Israel F.P., 1991, ApJ 380, 384
- (46) Wiklind T., Combes F., Henkel C., Wyrowski F., 1997, A&A 323, 727
- (47) Wilson T.L., Matteucci F., 1992, A&ARv 4, 1
- (48) Zaritsky D., Kennicutt R.C., Huchra J.P., 1994, ApJ 420, 87