The compact core-jet region of the superluminal quasar 3C 216
1. Introduction
The central region of radio-loud active galactic nuclei (AGN) can be studied with sub-milliarcsecond (mas) resolution using the space very long baseline interferometry (space VLBI) technique; this corresponds to only a few parsecs projected linear size even for the highest redshift sources. The inclusion of an orbiting element into the VLBI array is important because the achievable resolution increases without using higher observing frequencies. As theory predicts that the size of the optically thick region of compact jets is inversely proportional to the frequency (Blandford & Königl 1979), sources that are too compact for ground VLBI arrays can only be resolved by space VLBI. The other advantage of this technique over ground-based VLBI is that higher brightness temperatures can be measured. The maximum achievable brightness temperature (for an isotropic source) is limited by inverse Compton scattering to K (Kellermann & Pauliny-Toth 1969); values exceeding K indicate Doppler-boosting of the emission. Observational evidence for Doppler-boosting and investigation of parsec-scale jet misalignments at sub-mas resolution (e.g. Tingay et al. 1998) help us to refine orientation-based unification models.
Below we present results of our VLBI Space Observatory Programe (VSOP) observations of 3C 216 (0906+430). The source (, Spinrad et al. 1985) shows high optical polarization and variability, typical of the class of blazars (Angel & Stockman 1980). It was classified as a compact steep spectrum (CSS) quasar as well (e.g. Fanti et al. 1985; Pearson & Readhead 1988), though this classification may not be entirely correct as the observed small source size (15 kpc) is probably not intrinsic, and within mas of the centre the radio structure is reminiscent of core dominated sources (Fejes et al. 1992). There are slightly misaligned radio lobes on arcsecond scales oriented to South-West and North-East directions from the centre (Pearson et al. 1985; Fejes et al. 1992); the latter seems to align with the barely-resolved optical structure observed by the Hubble Space Telescope (de Vries at al. 1997). Images made by the VLA at 1.4 GHz (Barthel et al. 1988) and by the MERLIN array at 408 MHz (Fejes et al. 1992) reveal the presence of a low surface brightness halo about 8” in size – there is no evidence for larger scale emission at lower frequencies, according to 81.5 MHz long baseline interferometric observations (Hartas et al. 1983). Regardless of the strong lobes that dominate the spectrum at low frequencies, 3C 216 shows the structural properties of a core dominated source at centimeter wavelengths on VLBI scales. It has a bright core component and a jet that is perpendicular to to the arcsecond-scale radio lobes (Fejes et al. 1992). The jet follows a gently curved path, with underlying wiggles, and ends in a sharp bend at 140 mas from the centre (Fejes et al. 1992; Akujor et al. 1996). In the innermost part of the source, components emerge at superluminal speeds (Barthel et al. 1988). Venturi et al. (1993) showed that deceleration takes place in the inner few mas (10-20 parsecs). There is also a quasi-stationary component at mas from the radio core at 5 GHz. Our main goal was to investigate this region in more detail.
Table 1. Characteristics of radio antennas used in our VSOP experiment.
| Name | Diameter (m) | SEFDa (Jy) |
|---|---|---|
| Effelsberg | 100 | 20 |
| Westerbork | 93b | 70 |
| Jodrell Bank | 25 | 320 |
| Noto | 32 | 260 |
| Onsalac | 25 | 600 |
| Torun | 32 | 250 |
| Medicina | 32 | 296 |
| Green Bank | 43 | 120 |
| HALCA | 8 | 15300 |
-
a
System Equivalent Flux Density.
-
b
Used in phased array mode, an equivalent diameter is given.
-
c
Did not observe due to high winds.
2. Observations, data reduction and imaging
The source was observed at 5 GHz with the array of the VSOP satellite HALCA, the 43m Green Bank telescope and the western part of the European VLBI Network (EVN) on 14/15 February 1999. Characteristics of the radio antennas are listed in Table 1. There were three tracking passes during the 8.5 hour experiment using the Green Bank, Tidbinbilla and Goldstone tracking stations. The data were recorded in left circular polarization in VLBA mode, and correlated at the NRAO VLBA correlator in Socorro (USA). We used AIPS (Cotton 1995; Diamond 1995) version 15OCT98 for data processing at the FÖMI Satellite Geodetic Observatory, Hungary. The measured antenna system temperatures () were used for a-priori amplitude calibration where available. We used nominal values for Green Bank and HALCA. Fringes were found with high signal-to-noise ratio for space baselines during the experiment, except in the short third tracking pass. We averaged data in frequency and time (one minute integration time) and performed imaging in DIFMAP (Shepherd et al. 1994).
We experimented with a variety of cut-offs and data weighting in imaging, in order to image the source structure on different spatial scales. We were able to reconstruct the jet bend at mas from the core using natural weighting – this feature was resolved out using uniform weighting, when ground-space baselines dominate in imaging. We found that the gain of the EVN telescopes – which have baselines sensitive to the 100 mas scale structure – could be better self-calibrated if we added clean components from the large scale emission ”manually”, when performing imaging with uniform weighting.
The process is described below. 1) A self-calibration and imaging cycle was carried out using natural weighting. 2) The source model file obtained was edited so that clean components within 5 mas from the phase centre were deleted (emission from larger scales do not have a significant contribution to the correlated flux density on the Earth-space baselines). 3) A new self-calibration and imaging cycle was started with uniform weighting of the data. After the starting phase self-calibration to a 1 Jy point source model, the edited model file from 1) was appended to the clean component model. Imaging of the inner few mas region of the source was then continued in the usual way. This method should be applied with caution but proved to be useful in our case. While the basic structure of the source obtained as described above was not different from what can be achieved by the standard way, we were able to improve the dynamic range of the final space VLBI map.
3. Results
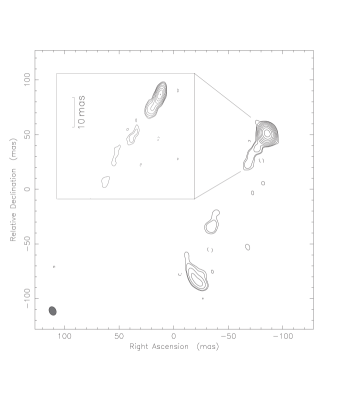
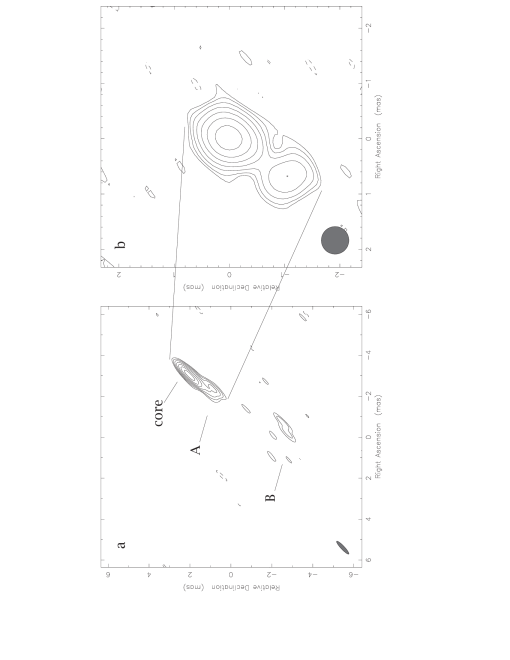
Contour representations of the resulting images – according to the various imaging strategies – are shown in Fig. 1. and Fig. 2. The bright knot at the jet bend can be identified at 140 mas from the core in Fig. 1., where the inset shows the wiggling jet in more detail. Components in the full resolution space VLBI image (Fig. 2a) are labelled in the same way as in Venturi et al. (1993). The core region is resolved; however, the clean beam is highly elongated roughly along the jet direction. The results of model fitting of the self-calibrated data are listed in Table 2. Using a 0.5 mas circular restoring beam, Component A is apparently well separated from the core (Fig. 2b). The separation is estimated as 1.250.05 mas. This is not in agreement with the results of model fitting; an elongated component closer to the core (0.87 mas) gives the best fit to the data (see Table 2.). Component B is clearly resolved, and seems to be edge brightened on the western side. It is difficult to estimate the positional uncertainty of component B; we will use 0.2 mas in further analysis (as well as for other epochs). The position angle of the inner jet components () is slightly misaligned with respect to the 100 mas scale jet ().
In order to scale angular sizes to projected linear sizes, we used km s-1 Mpc-1 and ; 1 mas corresponds to pc at the distance of 3C 216. We also calculated the observed brightness temperatures of the source components in the core region, after correction for the cosmological redshift, using the formula given by Kellermann and Owen (1988):
| (1) |
where is the flux density in Jy, and are the sizes of the major and minor axes of the fitted Gaussian component in mas, and is the observing frequency in GHz. These values are listed in Table 2. For the radio core, K, which is comparable to the inverse Compton limit (Kellermann & Pauliny-Toth 1969).
4. Discussion
The overall radio structure of 3C 216 can be modelled with either helical flows or precessing beams in which jet components move ballistically, but a unique solution cannot be found (Fejes et al. 1992). Helical jets are proposed to exist in some radio-loud AGN (e.g. Conway & Murphy 1993, and references therein) e.g. due to Kelvin-Helmholtz instabilities introduced by a driving mechanism such as precession of the central engine. Note that precessing jet models invoking ballistic ejection of plasmons are less favoured at present as it would require two orders of magnitude higher density of the jet with respect to the ambient medium, which is not observed in AGN (Hardee et al. 1994).
In the case of 3C 216, Akujor et al. (1996) noted that the edge brightened structure and the flattened spectrum of the component near the jet bend may indicate interaction with the interstellar medium. Such jet-ISM interaction is proposed to be a general phenomenon in the sample of CSS sources (including 3C 216) investigated by de Vries et al. (1999) with the Hubble Space Telescope, which gives evidence for the presence of emission-line gas aligned with the radio structures. The very high rotation measure observed in the jet bend (Venturi & Taylor 1999) and the recently discovered H i absorption in the source (Pihlström et al. 1999) indicate that the jet is indeed deflected by an interstellar cloud in the host galaxy. High resolution H i observations have been carried out in the UHF band with the EVN to identify the location of the absorbing gas (Y. Pihlström, priv. comm.).
Table 2. Fitted elliptical Gaussian model parameters of the source components. : flux density, : separation, : position angle, : major axis, : ratio of minor and major axes, : position angle of the major axis, : brightness temperature.
| Component | |||||||
|---|---|---|---|---|---|---|---|
| (mJy) | (mas) | (∘) | (mas) | (∘) | ( K) | ||
| Core | 381.6 | 0.00 | – | 0.36 | 0.31 | 32 | 0.79 |
| A | 122.8 | 0.87 | 151.5 | 1.37 | 0.21 | 62 | 0.03 |
| B | 45.1 | 5.16 | 152.3 | 1.93 | 0.14 | 31 | 0.01 |

The position of component B from earlier VLBI measurements is shown in Fig. 3. These data are consistent with a constant proper motion of mas/yr between 1979 and 1999. But note that the higher resolution observations (the two 8 GHz data points and our 5 GHz space VLBI measurement) show significantly larger separations of the component from the centre. The ground only data points obtained at 5 GHz are still indicative of jet deceleration or orientation changes, if we compare the trend in the component separation evolution before and after 1988. It may be misleading to compare component separations measured with instruments of different resolution or measured at different frequencies, which may result in a shift of the reference point (the location of the observed brightness peak). This can happen in a case e.g. when a jet component is blended with the core in a lower resolution observation. But the reference point is also expected to shift with the observing frequency due to a change in synchrotron self-absorption opacity, if the core region can be described with compact jet models (Lobanov 1988 and referencies therein, see below). Such a shift was recently detected e.g. in the BL Lac objects 1803+784 (Pérez-Torres et al. 2000) and 1823+568 (Paragi et al. 2000). The latter was observed at four-frequencies (5–22 GHz) with the VLBA; these observations show a systematic increase of core–jet component separation with increasing frequency.
The topic of constant component speed vs. jet deceleration scenario for 3C 216 will be investigated further by T. Venturi et al. (in preparation). For the present discussion we assumed the most simple case of constant component speed, and calculated the apparent transverse velocity with the following formula (e.g. Pearson & Zensus (1987)):
| (2) |
The observed proper motion corresponds to apparent transverse velocity.
The nature of component A is rather unclear. Its separation from the core is 1.25 mas (see the super-resolved image in Fig. 2b), compared to the earlier reported quasi-stationary position of 1.4–1.6 mas (Venturi et al. 1993). The beam orientation is not suitable to decide whether this feature is a separate component, or just an extension to the core emission. As we could not model the source structure with a stable component at a distance of 1.25 mas in the model-fitting process, the latter seems more favourable. It is very probable that the ”core” and ”component A” together form the so-called ultracompact jet region of 3C 216 (see Lobanov 1998). In this case we can apply the equipartition jet model of Blandford and Königl (1979) in which the limiting brightness temperature is about K. A comparison with the observed value results in a lower limit to the Doppler factor: . The Lorentz factor of the jet () and the viewing angle to the line of sight () can be given by (e.g. Daly et al. 1996):
| (3) |
and
| (4) |
Using the calculated values of and the lower limit of , and assuming our results are and . Much higher Doppler factors for 3C 216 have been determined by other methods ( in Ghisellini et al. 1992 and in Güijosa & Daly 1996). These Doppler factors would result in very large Lorentz factors of and much smaller angles to the line of sight (), unless represents a jet pattern speed instead of bulk motion. Note that the estimations from the literature mentioned above made use of VLBI data taken during an outburst, when the flux density of the source core was much higher (cf. Barthel et al. 1988).
5. Conclusions
The blazar type core of the source can be interpreted in terms of compact jets. We estimate that the inner jet is oriented close to the line of sight with , and the radio emission is Doppler-boosted by a factor of at the epoch of observations. We conclude that the observed small projected size of 3C 216 is probably caused by both interaction of the radio beams with the interstellar medium and a projection effect. The nature of the core region should be investigated in more detail in future high resolution multi-frequency VLBI experiments, which would allow us to compare the observed spectral distribution with physical models.
We gratefully acknowledge the VSOP Project, which is led by the Japanese Institute of Space and Astronautical Science in cooperation with many organizations and radio telescopes around the world. This research was supported in part by the Netherlands Organization for Scientific Research and the Hungarian Scientific Research Fund (grant no. N31721 & T031723), as well as the Hungarian Space Office. The National Radio Astronomy Observatory is operated by Associated Universities, Inc. under a Cooperative Agreement with the National Science Foundation. We thank the anonymous referee for useful comments.
References
Angel J.R.P., Stockman H.S. 1980, ARA&A 18, 321
Akujor C.E., Porcas R.W., Lüdke E., Shone D.L. 1993, in Davies E., Booth R.J. (eds.) Sub-arcsecond Radio Astronomy, Cambridge University Press, p. 265
Akujor C.E., Porcas R.W., Fejes I. 1996, in Ekers R., Fanti C., Padrielli L. (eds.) Extragalactic Radio Sources, Dordrecht: Kluwer, p. 83
Blandford R.D., Königl A. 1979, ApJ 232, 34
Barthel P.D., Pearson T.J., Readhead A.C.S. 1988, ApJ 329, L51
Conway J.E., Murphy D.W. 1993, ApJ 411, 89
Cotton W.D. 1995, in Zensus J.A., Diamond P.J., Napier P.J. (eds.) Very Long Baseline Interferometry and the VLBA, ASP Conference Series Vol. 82, p. 189
Daly R.A., Guerra E.J., Güijosa A. 1996, in Hardee P.E., Bridle A.H., Zensus J.A. (eds.) Energy Transport in Radio Galaxies and Quasars, ASP Conference Series Vol. 100, p. 73
Diamond P.J. 1995, in Zensus J.A., Diamond P.J., Napier P.J. (eds.) Very Long Baseline Interferometry and the VLBA, ASP Conference Series Vol. 82, p. 227
Fanti C., Fanti R., Schilizzi R.T., Spencer R.E., van Breugel W.J.M. 1985, A&A 143, 292
Fejes I., Porcas R.W., Akujor C.E. 1992, A&A 257, 459
Ghisellini G., Celotti A., George I.M., Fabian A.C. 1992, MNRAS 258, 776
Güijosa A., Daly R.A. 1996, ApJ 461, 600
Hardee P.E., Cooper M.A., Clark D.A. 1994, ApJ 424, 126
Hartas J.S., Rees W.G., Scott P.F., Duffett-Smith P.J. 1983, MNRAS 205, 625
Kellermann K.I., Owen F.N. 1988, in Verschuur G.L., Kellermann K.I. (eds.) Galactic and Extragalactic Radio Astronomy, Springer, p. 577
Kellermann K.I., Pauliny-Toth I.I.K. 1969, ApJ 155, L71
Lobanov A.P. 1998, A&A 330, 79
Paragi Z., Fejes I., Frey S. 2000, in Vandenberg N.R., Baver K.D. (eds.) International VLBI Service for Geodesy and Astrometry 2000 General Meeting Proceedings, NASA/CP–2000–209893
Pearson T.J., Readhead A.C.S. 1988, ApJ 328, 114
Pearson T.J., Zensus J.A. 1987, in Zensus J.A., Pearson T.J. (eds.) Superluminal Radio Sources, p. 1
Pearson T.J., Perley R.A., Readhead A.C.S. 1985, AJ 90, 738
Pérez-Torres M.A., Marcaide J.M., Guirado J.C. et al. 2000, A&A 360, 161
Pihlström Y.M., Vermeulen R.C., Taylor G.B., Conway J.E. 1999, ApJ 525, L13
Shepherd M.C., Pearson T.J., Taylor G.B. 1994, BAAS 26, 987
Spinrad H., Djorgovski S., Marr J., Aguilar L. 1985, PASP 97, 932
Tingay S.J., Murphy D.W., Edwards P.G. 1998, ApJ 500, 673
Venturi T., Pearson T.J., Barthel P.D., Herbig T. 1993, A&A 271, 65
Venturi T., Taylor G.B. 1999, AJ 118, 1931
de Vries W.H., O’Dea C.P., Baum S.A. et al. 1997, ApJS 110, 191
de Vries W.H., O’Dea C.P., Baum S.A., Barthel P.D. 1999, ApJ 526, 27