Far-Ultraviolet Spectra of AGN: First Results from FUSE
Abstract
Composite spectra derived from HST observations of moderate redshift () quasars show that the peak of the spectral energy distribution is at 1000 Å, and that the ionizing continuum falls off smoothly to shorter wavelengths as . HUT and FUSE observations of nearby AGN (e.g., 3C 273) show similar results. FUSE spectra reveal a wealth of detail in the 912–1200 Å spectral range, including multi-component intrinsic absorption in the O vi doublet and Ly, and surprisingly strong narrow-line emission from O vi . Monitoring observations of AGN below 1200 Å are feasible, and such experiments could help to unravel the structure of intrinsic absorbers in AGN as well as the highest ionization portions of the broad-line region.
Space Telescope Science Institute, 3700 San Martin Drive, Baltimore, MD 21218
1. Introduction
The far-ultraviolet wavelength range spans the peak of the intrinsic spectral energy distribution of active galactic nuclei (AGN). Thus, it is important for understanding the energy generation mechanism and the processes that govern accretion onto massive black holes. At low to moderate redshift, the low-energy portion of the ionizing continuum enters the far-UV spectral range, and it can be observed with spectrographs on board the Hubble Space Telescope (HST) and instruments such as the Hopkins Ultraviolet Telescope (HUT) (Davidsen et al. 1992) and the Far Ultraviolet Spectroscopic Explorer (FUSE) (Moos et al. 2000). Since this portion of the spectrum determines the radiative input to the broad-line region (BLR) and the narrow-line region (NLR) in AGN, as well as the surrounding host galaxy and the intergalactic medium (IGM), determining the spectral shape in individual objects as well as on average is a crucial input for understanding the physical conditions of the gas in surrounding regions.
The 900–1200 Å spectral range contains numerous diagnostic spectral features that can be applied to AGN physics. The most prominent emission line is the O vi resonance doublet , which, as shown in Fig. 1, is particularly strong in the spectra of low-redshift, low-luminosity AGN. This line can serve as a diagnostic of the energy input from the extreme ultraviolet to soft X-ray portions of the ionizing continuum. Likewise, the O vi doublet is a crucial diagnostic for the warm absorbing gas commonly seen as O vii and O viii absorption in X-ray spectra of AGN (Reynolds 1997; George et al. 1998). The high-order Lyman lines and the Lyman limit provide additional diagnostics of absorbing gas. In some cases (e.g., NGC 4151 or NGC 3516) the neutral hydrogen can be optically thick and thereby play a significant role in collimating the ionizing radiation that illuminates the NLR (Kriss et al. 1997). Finally, numerous ground-state transitions of molecular hydrogen in the Lyman and Werner bands provide a sensitive tracer of molecular gas. Under the right circumstances, one might expect to see associated with the obscuring torus in AGN in absorption against the continuum and broad emission lines.

2. The Ionizing Continuum Shape
The ionizing continuum shape in AGN is difficult to study directly. At low redshift it is mostly obscured by our own interstellar medium, and inferences must be made from the spectral shape observed in the far-UV and soft X-ray (on either side of the opaque interstellar absorption) as well as from clues provided by the emission lines observed. The notion that continuum radiation of AGN peaked in the unobservable extreme ultraviolet can be traced back to the accretion-disk fits of Malkan & Sargent (1982) as well as the “big blue bump” suggested by the UV and soft X-ray excesses of PG1211+143 (Bechtold et al. 1987). Accounting for the fluxes in the broad emission lines led Mathews & Ferland (1987) to adopt an ionizing spectral shape peaking in the extreme ultraviolet (see Fig. 2).

More recent work that uses ensembles of objects to produce a “composite” spectrum over the observable wavelength range suggests that there is no extreme ultraviolet peak. The UV composites of Zheng et al. (1997) for radio-loud (RL) and radio-quiet (RQ) objects, shown schematically in Fig. 2, have a blue far-UV continuum with a distinct break to a steeper spectral index () at 1000 Å. Soft X-ray spectral composites constructed by Laor et al. (1997) have slopes similar to the short wavelength end of the UV composites.
The Zheng et al. (1997) composite builds upon the earlier examples of Baldwin (1977) and Francis et al. (1992) to produce an average QSO spectrum from HST ultraviolet spectra of 100 different QSOs. This composite consists of all FOS observations of QSOs with prior to 1996 January 1. To construct the composite, the observed fluxes were first corrected for foreground Galactic reddening with a Seaton (1978) law using extinction as specified by Burstein & Heiles (1978). Strong Lyman lines and visible Lyman-limit systems were corrected in the individual spectra. (Objects with strong intrinsic absorption such as BALQSOs were simply omitted from the composite.) Fainter Ly forest lines and the “Lyman valley” (Møller & Jakobsen 1990) were corrected for statistically as a function of redshift. The result from Zheng et al. (1997) is shown in Fig. 3.
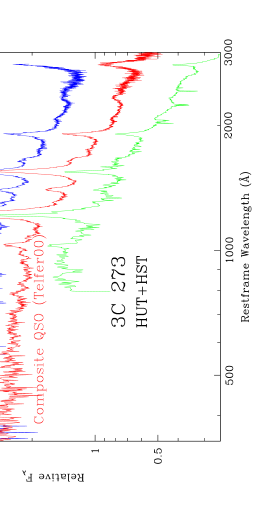
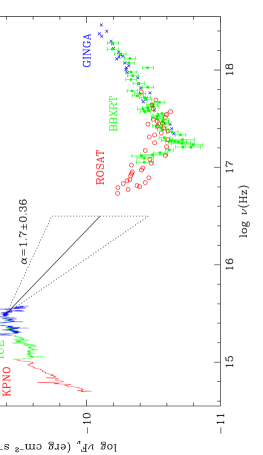
Work currently in progress by Telfer et al. (2000) is updating this composite spectrum using the same technique with a sample that is nearly three times larger. Containing spectra of 248 QSOs obtained prior to 2000 May 31, the Telfer et al. (2000) composite is nearly identical to the Zheng et al. (1997) result. A physical interpretation of the spectral shape observed by Zheng et al. (1997) is that the typical AGN spectrum is Comptonized radiation from an accretion disk. A spectral break near the Lyman limit is a characteristic expected in Comptonized accretion-disk spectra. Comptonization smears out the Lyman-limit edge of the intrinsic accretion-disk spectrum and produces a power-law tail at wavelengths shortward of Å. Although a simple model of a Comptonized disk provides a good fit to the Zheng et al. composite, there is the nagging question of how physical such a composite is, and whether its shape holds any physical meaning since the individual spectra of the sample QSOs vary in shape over quite a wide range. The study of the 3C 273 far-UV spectrum by Kriss et al. (1999) provides a firm physical basis for the interpretation of the Zheng et al. composite. In the 3C 273 spectrum (also shown in Fig. 3), one sees the same qualitative characteristics as in the composite spectrum—the spectral index steepens at 1000 Å in the rest frame. As shown further in Fig. 4, the shorter-wavelength UV spectrum extrapolates very well to the observed soft-X-ray spectrum. Both the composite spectra and the spectrum of 3C 273 leave little room in the extreme ultraviolet for a big bump in the QSO spectral energy distribution.
The apparent lack of an extreme ultraviolet peak in the ionizing spectrum now leaves us in a quandary. The analysis of Mathews & Ferland (1987) based on the broad emission line fluxes is still valid; Korista, Ferland, & Baldwin (1997) suggest that the BLR “sees” a different continuum shape than we do since the He ii 1640 equivalent widths in moderate redshift QSOs require more ionizing photons than are present in the Zheng et al. composite. On the other hand, the mean spectral index of the QSO composite matches the ionization requirements for H i and He ii absorption by the IGM (Zhang et al. 1997), so apparently the IGM is seeing the same average that we are. It may be that the answer lies in detailed studies of individual objects. Objects with high He ii equivalent widths may dominate the He ii average, but these same objects may not be represented in the sample of spectra contributing to the composite at short wavelengths. Far-UV and soft X-ray spectra of objects at moderate redshift that tightly constrain the possible EUV spectral shape (as shown above for 3C 273) may resolve this issue.
3. The FUSE AGN Program

The launch of the Far Ultraviolet Spectroscopic Explorer (FUSE) on 1999 June 24 provided a new tool in orbit for studying the far-UV spectra of AGN. FUSE observations cover the 905–1187 Å band with a resolving power of . The mission concept is described by Moos et al. (2000), and the initial in-flight performance is presented by Sahnow et al. (2000). Basically, four separate primary mirrors gather light for four prime-focus, Rowland-circle spectrographs. Two of the optical systems employ LiF coatings to cover the 990–1187 Å band, and the other two use SiC coatings to get reflectivity down to wavelengths as short as 905 Å. Holographically ruled gratings disperse the light entering through the selected entrance slit (a 30′′30′′ aperture for most observations) and form an astigmatic image on the two-dimensional photon-counting microchannel-plate detectors. The detectors have KBr photocathodes and delay-line anode readouts that provide the location and arrival time of each photon event.

FUSE began routine observations in December 1999, and here I will present the first results from the PI-team program directed toward the study of AGN. This program piggy-backs off data acquired as part of the larger PI-team study of O vi absorption in the Galactic halo and the study of the deuterium to hydrogen ratio along different sight lines through the Galactic halo and high-velocity clouds. As part of these programs, the UV-brightest AGN are being surveyed at low to moderate signal-to-noise (S/N) ratios to determine the best sight lines for further study. A few intrinsically interesting AGN are being observed at high S/N as part of the “medium-size” team project as are a few Seyfert 2 galaxies. In addition to the FUSE observations, an HST snapshot program is obtaining contemporaneous spectra at longer UV wavelengths using the STIS G140L and G230L gratings, and current-epoch ground-based optical spectra covering 3500–9000 Å are being obtained by R. Green and M. Brotherton at KPNO. The primary scientific goals of the FUSE AGN program are to (1) determine the far-UV continuum shape of low-redshift AGN; (2) examine the strength and profile of the broad O vi emission line; (3) search for intrinsic O vi and Lyman-limit absorbers and study their kinematics; (4) search for intrinsic absorption that may be associated with the obscuring torus; and (5) study the strengths of other far-UV resonance lines such as C iii and N iii .
As of 2000 July 1 we have observed 47 AGN at . 46 of these are Type 1 AGN; one is the Seyfert 2 Mrk 463, which was not detected. Of the 28 Type 1s with (so that O vi falls in the FUSE bandpass), strong, broad O vi emission is visible in all but one (Pks ). Four of the 28 also show strong narrow O vi emission lines. Approximately 40% (11/28) show intrinsic O vi absorption. No intrinsic Lyman limits are detected, and no intrinsic molecular hydrogen absorption is visible. Representative spectral energy distributions for 4 of the AGN in this sample are shown in Fig. 5. Note the overall qualitative similarity of these AGN spectra to the Zheng et al. (1997) composite. While it is too early to draw definitive conclusions, this suggests that there is little evolution in mean spectral shape from redshifts of 1, as represented by the composite, to the current epoch.
4. FUSE Observations of NGC 4151

Turning to a more detailed discussion of individual objects observed by FUSE, let me start with the spectrum of a recurrent favorite: NGC 4151. This FUSE observation was obtained as part of a coordinated set that included Chandra grating spectra and HST/STIS echelle spectra. While our primary intent was to study the rich absorption-line spectrum of NGC 4151, we found to our surprise that NGC 4151 was fainter than in recent HUT (Kriss et al. 1995) and ORFEUS (Espey et al. 1998) observations. As shown in Fig. 6, the FUSE spectrum is dominated by narrow-line emission, rather than the usual bright continuum and broad O vi seen in this spectral range. The usual broad absorption lines, including the opaque Lyman limit, are not readily apparent. The narrow lines have a full-width-half-maximum of , and they are at the systemic velocity of the galaxy. Some residual broad O vi emission can be seen at the base of the narrow lines.
The HUT and ORFEUS observations of NGC 4151 showed that the Lyman absorption lines were broad and saturated, yet their relative equivalent widths suggested that they only partially covered the broad-line and continuum emission, with % of the flux leaking through or around (due to scattering) the absorbing material. The broad absorption that is present in the O vi region is not very deep in the FUSE spectrum, and its profile never drops below the current continuum flux level. This suggests that the little continuum emission we do see ( at 1030 Å) may be completely dominated by scattered light, and that the current low flux state of NGC 4151 is not due to intrinsic dimming of the central engine, but rather heavier-than-usual obscuration that is completely opaque at UV wavelengths. Note that the red and blue-shifted “satellite” lines often visible around C iv in earlier low states of NGC 4151 (Ulrich et al. 1985; Clavel et al. 1987) do not appear to have any counterparts in the current O vi profile. (See the paper by M. Crenshaw in this volume for a possible explanation of the C iv satellite lines.)

The prominent narrow lines we see in the spectrum are very reminiscent of the HUT spectrum of NGC 1068, where the high excitation lines of C iii and N iii were particularly prominent (Kriss et al. 1992b; Grimes, Kriss, & Espey 1999). In Fig. 7 we have used a Gaussian kernel to smooth the FUSE spectrum of NGC 4151 down to the Å resolution of HUT and overlayed it directly on the HUT spectrum of NGC 1068. The correspondence is quite remarkable. Whether one thinks the narrow-line emission is powered predominantly by kinetic energy in shocks or photoionization by the central engine, it is clear that the same mechanism is at work in the NLRs of both NGC 1068 and NGC 4151. This provides even more support for unified models of Seyfert 1s and Seyfert 2s based on the obscuration, orientation, and reflection paradigm (Antonucci 1993).
5. Narrow O vi Lines in FUSE AGN Spectra
NGC 4151 is not the only AGN to show prominent narrow emission lines in its FUSE spectrum. So far, strong narrow O vi emission lines have been detected in 4 out of 28 objects with : NGC 4151, NGC 3516, NGC 5548, and IRAS . Such a high percentage is a bit surprising since strong narrow-line emission in lower-excitation UV lines such as C iv is rarely seen in HST spectra. The one well-known exception is the HST/FOS spectrum of NGC 5548 in a low state (Crenshaw, Boggess, & Wu 1993). The FUSE observations suggest that there is a very high ionization component of the NLR present in many AGN.
The physical conditions in this region are unclear. While in three of the present cases they are easily seen because the galaxy is in a low flux state (NGC 4151, NGC 3516, and NGC 5548), as shown in Fig. 8 for IRAS , the narrow O vi components are quite visible superposed on a strong broad O vi profile. In three of these cases the narrow lines also have the usual 2:1 flux ratios indicative of optically thin gas. However, as shown in Fig. 9, the lines in NGC 3516 have a 1:1 ratio more indicative of optically thick gas.

6. FUSE Observations of Warm Absorbers
The “warm” (or, ionized) absorbing gas that is common in the X-ray spectra of low-redshift AGN is a major new component of their near-nuclear structure. About half of all low-redshift AGN show absorption by ionized gas (Reynolds 1997; George et al. 1998), and a similar fraction show associated UV absorption in highly ionized species such as C IV (Crenshaw et al. 1999). For AGN that have been observed at moderate to high spectral resolution in both the X-ray and the UV, there is a one-to-one correspondence between objects showing X-ray and UV absorption, suggesting that the phenomena are related in some way (Crenshaw et al. 1999). The gas has a total mass exceeding (greater than the broad-line region, or BLR), and is outflowing at a rate ( the accretion rate in some objects) (Reynolds et al. 1997).
The role played by the ionized absorbing gas in AGN at the moment is unclear. The UV-absorbing gas lies exterior to the BLR, as revealed by the depth of the absorption lines in many cases (Crenshaw et al. 1999). This gas could either arise in winds from the molecular torus (Weymann et al. 1991; Emmering et al. 1992), the accretion disk (Königl & Kartje 1994; Murray et al. 1995), or stripped stellar envelopes in the BLR (Alexander & Netzer 1994; Scoville & Norman 1996). Or, the X-ray heated winds that provide the reflecting medium in Type 2 AGN (Krolik & Begelman 1986) may be seen as the warm absorbing medium in Type 1 AGN (Krolik & Kriss 1995). Understanding the absorbing gas in nearby AGN may help us to understand how radiation is collimated (Kriss et al. 1997). This goes not only to the heart of understanding the structure of AGN, but is also a crucial element in understanding the ionizing radiation field at high redshifts and links between AGN and the X-ray background. If the obscuration/orientation paradigm for AGN unification is correct, then the solid angle subtended by unobscured lines of sight from an active nucleus is a crucial parameter in determining the fraction of ionizing radiation that illuminates the surrounding IGM. Obscured Type 2 AGN may also comprise a significant fraction of the point sources producing the X-ray background. Understanding the intrinsic structures that lead to the Type 1/Type 2 distinction is a vital clue in our overall understanding of these phenomena.
A key question for understanding warm absorbers is how the X-ray and UV spectral domains are related. In some cases, UV absorbing gas may be directly associated with the X-ray warm absorber (3C351: Mathur et al. 1994; NGC 5548: Mathur et al. 1995). In other cases, however, the UV gas appears to be in an even lower ionization state, and there is no direct relation between the X-ray absorption and the UV absorption (NGC 4151: Kriss et al. 1995; NGC 3516: Kriss et al. 1996a, 1996b; NGC 7469: Kriss et al. 2000a). High spectral resolution observations of O vi absorption in AGN with X-ray warm absorbers is proving to be an invaluable tool for definitively analyzing these issues.
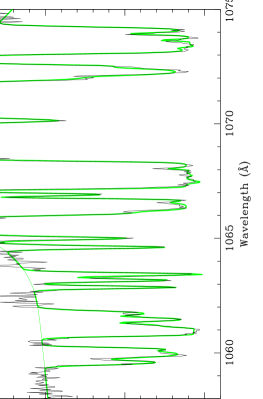
The disparity between the UV and X-ray absorbers is illustrated most clearly by FUSE observations of the Seyfert 1 galaxy Mrk 509 (Kriss et al. 2000b). As shown in Fig. 10, this observation resolves the UV absorption into seven kinematic components. In addition to the O vi and Ly absorption shown here, C iii lines are seen in the lowest-ionization components, and Lyman-line absorption up to Ly permits an accurate measure of the neutral hydrogen column density and its covering fraction. Comparison of the O vi, H i, and C iii column densities to photoionization models permits one to independently assess the total column density of each kinematic component. Table 1 summarizes the physical properties of each of the seven components. Of the seven systems present, only #5, a system near the systemic velocity of Mrk 509, stands out clearly as having a level of ionization and total column density compatible with an X-ray warm absorber. Note, however, that the total equivalent width of the UV absorption is dominated by the other six components, yet the X-ray absorption that would be associated with them is negligible.
The O vi and O vi edges seen by Reynolds (1997) in ASCA spectra of Mrk 509 imply column densities for the ionized gas of and . The photoionization model for the UV-absorbing component #5 computed by Kriss et al. predicts and . Given the large uncertainties in the X-ray columns and the temporal difference between the X-ray and UV observations, the agreement is remarkably close, and it is quite likely that component #5 is same gas as that absorbing the X-ray radiation. It is puzzling, however, that this component lies so close to the systemic velocity. Most absorbers in other AGN (including most of the other components in this one) are blue-shifted relative to the host galaxy, and this is true for the high-resolution X-ray spectra obtained so far with Chandra: the X-ray absorption lines in NGC 5548 are blue-shifted by (Kaastra et al. 2000) and by in NGC 3783 (Kaspi et al. 2000). Clearly a larger sample of objects that would permit us to assess these differences is essential.
| # | log U | |||||
|---|---|---|---|---|---|---|
| 1 | 0.37 | |||||
| 2 | 1.51 | |||||
| 3 | 0.48 | |||||
| 4 | 0.19 | |||||
| 5 | 13.9 | |||||
| 6 | 2.14 | |||||
| 7 | 2.76 |
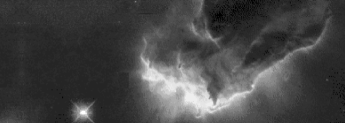
The multiple kinematic components frequently seen in the UV absorption spectra of AGN clearly show that the absorbing medium is complex, with separate UV and X-ray dominant zones. One potential geometry is high density, low column UV-absorbing clouds embedded in a low density, high ionization medium that dominates the X-ray absorption. This is possibly a wind driven off the obscuring torus or the accretion disk. What would this look like in reality? Detailed modeling of dense molecular gas irradiated by the ionizing continuum of an AGN is likely to miss the complexities that arise as material is ablated from the surface and flows away. We will not soon get a close-up look at this aspect of an AGN, so it is instructive to look at nearby analogies. The HST images of the pillars of gas in the Eagle Nebula, M16, show the wealth of detailed structure in gas evaporated from a molecular cloud by the UV radiation of nearby newly formed stars (Hester et al. 1996). Fig. 11 shows what this might look like in an AGN—a dense molecular torus surrounded by blobs, wisps, and filaments of gas at various densities. It is plausible that the multiple UV absorption lines seen in AGN with warm absorbers are caused by high-density blobs of gas embedded in a hotter, more tenuous, surrounding medium, which is itself responsible for the X-ray absorption. Higher density blobs would have lower ionization parameters, and their small size would account for the low overall column densities.
At sight lines close to the surface of the obscuring torus, one might expect to see some absorption due to molecular hydrogen. Given the dominance of Type 1 AGN in our observations so far, the lack of any intrinsic absorption is not too surprising since our sight lines are probably far above the obscuring torus. NGC 4151 and NGC 3516 are examples where the inclination may be more favorable since these objects have shown optically thick Lyman limits in the past (Kriss et al. 1992; Kriss et al. 1995; Kriss et al. 1996a), but our FUSE observations do not show such high levels of neutral hydrogen at the current epoch. Molecular hydrogen will not survive long in an environment with a strong UV flux. Given this, one might think that any sightline in an AGN in which a strong UV continuum was visible could not show absorption since the would not be optically thick enough to be self shielding. However, if the is contained in small, dense blobs that have ablated from the obscuring torus, these blobs could be thick enough to shield their cores and small enough that they do not completely obscure the central radiation source. Thus, the absorption, if present, is likely to show up as optically thick, high-column-density components that only partially cover the continuum or broad lines. Our best prospects for seeing such material are in upcoming FUSE observations of NGC 1068.
As I’ve shown here, FUSE offers numerous advantages for the study of absorbing gas in AGN. First, since the Ly absorption in the HST bandpass is often saturated, it is difficult to deblend the various velocity components and obtain accurate H i column densities. The unsaturated high-order Lyman lines in the FUSE bandpass make accurate measurement of the H i column density straightforward. Second, the O vi resonance lines are a key link between the lower-ionization species seen in the UV and the higher-ionization gas observed with Chandra. The presence of different, adjacent ionization states in the two bandpasses makes it possible to ascertain the ionization structure in a more model-independent way. One need not make assumptions about abundances or use photoionization models, for example, as would be required in comparing C iv in the HST band to O vii and O viii in the Chandra spectrum. Similarly, the ionization state of the UV-absorbing gas can be obtained more directly without recourse to assumptions about abundances by comparing the C iii opacity in the FUSE bandpass at 977 Å to C iv as observed with HST. Finally, after using O vi to identify the kinematic components in the absorbing gas associated with the X-ray warm absorber, the FUSE observations can be used to trace the kinematics of the X-ray absorbing gas at higher velocity resolution than is possible with the Chandra grating observations.
7. Monitoring Low-Redshift AGN Below 1200 Å
Not much is known about the variability of nearby AGN in the 912–1200 Å bandpass since observations at these wavelengths have been sparse. The Astro and ORFEUS shuttle missions have provided some insights, but FUSE promises to give the first real opportunity to study short and longer term variability in this band.
To date, the only repetitive observations of an AGN below 1200 Å have been the HUT and ORFEUS observations of NGC 4151 (Kriss et al. 1992a; Kriss et al. 1995; Kriss et al. 1997; Espey et al. 1998). These showed that broad O vi emission responds immediately to continuum changes, to within a resolution of 1–2 days. The saturated broad absorption lines such as Ly and O vi show little response to continuum changes, presumably because the changes in column density required to produce noticeable changes in equivalent width are larger than those induced by the varying continuum. However, weaker absorption features such as C iii and the high-order Lyman series (which is optically thick at the Lyman limit in these observations of NGC 4151) respond to continuum changes with a delayed response of 5 days, reflecting the recombination timescale of the photoionized gas. Observations proposed with FUSE to monitor the Seyfert 1 galaxy NGC 3783 contemporaneously with HST and Chandra grating observations could give the first glimpse of the response of the gas in a warm absorber to changes in the ionizing continuum at both X-ray and far-UV wavelengths.
Potential future monitoring experiments such as Kronos could profit from an ability to observe in the 912–1200 Å spectral range. As noted earlier, O vi is bright in low-redshift AGN; it is nearly as bright as C iv. While it probes a zone in the BLR similar in ionization to He ii, it is much brighter than He ii . For studies of warm absorbers, the O vi lines and the higher-order Lyman lines offer several advantages, as noted earlier.
Observing in this bandpass requires some observational trade-offs, however. Good throughput requires LiF coatings on the optics and open-window detectors. Both of these features entail significant costs in development and in contamination management throughout the instrument development and integration process. Sealed detectors and coatings are easier to manage, and their use can improve the throughput at longer UV wavelengths (e.g., C iv ) by up to a factor of 2.
8. Summary
I’ve reviewed the continuum, emission-line, and absorption-line properties of primarily low-redshift AGN, concentrating on the first observations available from FUSE. Composite far-UV spectra of QSOs developed from a sample now consisting of over 200 AGN (Telfer et al. 2000) confirms the result of Zheng et al. (1997) that the continuum spectral index breaks at Å to a steep power law of spectral index . Observations of individual objects such as 3C 273 (Kriss et al. 1999) show a qualitatively similar feature. Initial results from FUSE (with contemporaneous HST and ground-based observations) also show that the spectral energy distributions of low-redshift AGN are peaking in the 1000–1200 Å range. This implies that there is little evolution in the mean shape of the ionizing continuum from to the current epoch.
Nearly all Type 1 AGN observed with FUSE show strong, broad O vi emission. The broad O vi emission of AGN as revealed by HUT and FUSE is significantly stronger in low-redshift objects. The FUSE observations also show that strong, narrow O vi emission is prominent in several Type 1 AGN. In most cases this appears to be emission from the narrow-line region made relatively more prominent because the continuum and broad lines are in a relatively low state. However, NGC 3516 presents an interesting (and not yet understood) exception since the narrow O vi doublet has an optically thick 1:1 intensity ratio.
FUSE observations of O vi and high-order Lyman-line absorption in AGN with warm absorbers offers a powerful new tool for the study of the warm absorbing gas. The FUSE resolution reveals multiple kinematic components, and the O vi absorption lines often identify the highest ionization system likely to be directly associated with the warm absorber. Proposed monitoring observations may help to pinpoint the location and physical conditions in this important structural component of the nuclear region in AGN.
Acknowledgments.
The FUSE results are due in large part to the help of the FUSE Team and the FUSE AGN Working Group, particularly M. Brotherton and W. Zheng. R. Telfer, J. Kim, and A. Koratkar also made significant contributions. This work was supported in part by NASA contract NAS5-32985 for the FUSE project, NASA Long Term Space Astrophysics grant NAGW-4443, and grant GO-08144.01-97A from the Space Telescope Science Institute, which is operated by the Association of Universities for Research in Astronomy, Inc., under NASA contract NAS5-26555.
References
Alexander, T., & Netzer, H. 1994, MNRAS, 270, 781
Antonucci, R. 1993, ARA&A, 31, 473
Baldwin, J. 1977, MNRAS, 178, 67P
Bechtold, J., Czerny, B., Elvis, M., Fabbiano, G., & Green, R. F. 1987, ApJ, 314, 699
Burstein, D., & Heiles, C. 1978, ApJ, 225, 40
Clavel, J., et al. 1987, ApJ, 321, 251
Crenshaw. D. M., Boggess, A., & Wu, C.-C. 1993, ApJ, 416, L67
Crenshaw. D. M., Kraemer, S. B., Boggess, A., Maran, S. P., Mushotzky, R. F., & Wu, C. C. 1999, ApJ, 516, 750
Davidsen et al. 1992, ApJ, 392, 264
Emmering, R. T., Blandford, R. D., & Shlossman, I. 1992, ApJ, 385, 460
Espey, B.R., Kriss, G.A., Krolik, J. H., Zheng, W., Tsvetanov, Z., & Davidsen, A.F. 1998, ApJ, 500, L13
Francis, P., Hewett, P. C., Foltz, C., Chaffee, F. H., Weymann, R. J., & Morris, S. L. 1991, ApJ, 373, 465
George, I. M., Turner, T. J., Netzer, H., Nandra, K., Mushotzky, R. F., & Yaqoob, T. 1998, ApJS, 114, 73
Grimes, J. P., Kriss, G. A., & Espey, B. R. 1999, ApJ, 526, 130
Hester, J. J., et al. 1996, AJ, 111, 2349
Kaastra, J. S., Mewe, R., Liedahl, D. A., Komossa, S., & Brinkman, A. C. 2000, A&A, 354, L931
Kaspi, S., Brandt, W. N., Netzer, H., Sambruna, R., Chartas, G., Garmire, G. P., & Nousek, J. A. 2000, ApJ, 535, L17
Königl, A., & Kartje, J. F. 1994, ApJ, 434, 446
Korista, K., Ferland, G., & Baldwin, J. 1987, ApJ, 487, 555
Krolik, J. H., & Begelman, M. C. 1986, ApJ, 308, L55
Krolik, J. H., & Kriss, G. A. 1995, ApJ, 447, 512
Kriss, G. A., Davidsen, A. F., Blair, W. P., Ferguson, H. C., & Long, K. S. 1992b, ApJ, 394, L37
Kriss, G. A., Davidsen, A. F., Zheng, W., Kruk, J. W., & Espey, B. R. 1995, ApJ, 454, L7
Kriss, G. A., Davidsen, A. F., Zheng, W., & Lee, G. 1999, ApJ, 528, 123
Kriss, G. A., et al. 1992a, ApJ, 392, 485
Kriss G. A., et al. 1996a, ApJ, 467, 622
Kriss G. A., et al. 1996b, ApJ, 467, 629
Kriss, G. A., Peterson, B. M., Crenshaw, D. M., & Zheng, W. 2000a, ApJ, 535, 58
Kriss, G. A., et al. 2000b, ApJ, 538, L17
Kriss, G., Krolik, J., Grimes, J., Tsvetanov, Z., Zheng, W., & Davidsen, A. 1997, in ASP Conf. Ser. Vol. 113, Emission Lines in Active Galaxies: New Methods and Techniques, eds. B.M. Peterson, F.-Z. Cheng, & A.S. Wilson (San Francisco: ASP), 453
Krolik, J. H., & Kriss, G. A. 1995, ApJ, 447, 512
Laor, A., et al. 1997, ApJ, 477, 93
Malkan, M. A., & Sargent, W. L. W., 1982, ApJ, 254, 22
Mathews, W. G., & Ferland, G. J. 1987, ApJ, 323, 456
Mathur, S., Wilkes, B., & Elvis, M. 1995, ApJ, 452, 230
Mathur, S., Wilkes, B., Elvis, M., & Fiore, F. 1994, ApJ, 434, 493
Møller, P., & Jakobsen, P. 1990, A&A, 228, 299
Moos, W., et al. 2000, ApJ, 538, L1
Murray, N., Chiang, J., Grossman, S. A., Voigt, G. M. 1995, ApJ, 451, 498
Nandra, K., & Pounds, K. 1994, MNRAS, 268, 405
Reynolds, C. S. 1997, MNRAS, 286, 513
Sahnow, D., et al. 2000, ApJ, 538, L7
Seaton, M. 1979, MNRAS, 187, 73P
Scoville, N., & Norman, C. 1995, ApJ, 451, 510
Telfer, R. C., Kriss, G. A., Zheng, W., & Davidsen, A. F. 2000, in preparation
Ulrich, M.-H. 1985, Nature, 313, 745
Weymann, R. J., Morris, S. L., Foltz, C. B., & Hewett, P. C. 1991, ApJ, 373, 23
Zhang et al. 1997, ApJ, 485, 496
Zheng, W., Kriss, G. A., & Davidsen, A. F. 1995, ApJ, 440, 606
Zheng, W., Kriss, G. A., Telfer, R. C., Grimes, J. P., & Davidsen, A. F. 1997, ApJ, 475, 469