CLUSTER GALAXIES: CONTRIBUTION TO THE ARC STATISTICS
We present the results of a set of numerical simulations aiming at evaluating the effects of cluster galaxies on the arc statistics. At this goal we use nine different galaxy clusters obtained from N-body simulations. We mimic the presence of a population of galaxies inside each cluster, trying to reproduce the observed luminosity function and the spatial distribution. We compare the statistical distributions of the properties of the gravitational arcs produced by our clusters with and without galaxies. We find that the cluster galaxies do not introduce perturbations strong enough to significantly change the number of arcs and the distributions of the properties of long arcs.
1 Introduction
The statistics of arcs is a potentially very sensitive probe for the cosmological matter density parameter and for . Theoretical studies showed that more arcs can be expected in a universe with low density and small cosmological constant. In fact, low density makes clusters form earlier, and a low cosmological constant makes them more compact individually. Previous analyses (e.g. Bartelmann et al. 1998) neglected the granularity of the gravitational cluster potentials due to the presence of galaxies which can be considered using numerical simulations.
2 The cluster sample
The simulated clusters used as lenses in the present analysis are presented in Tormen et al. . The sample is formed by the nine most massive clusters obtained in a cosmological simulation of an Einstein-de Sitter universe, evolved using a P3M code. The original box-size is Mpc (a Hubble constant of 50 km s-1 Mpc-1 is used). The initial conditions have a scale-free power spectrum , very close to the behaviour of the standard CDM model on the scales relevant for cluster formation. The normalization is chosen to roughly match the observed local abundance of clusters and corresponds to , where is the r.m.s. matter density fluctuation in spheres of radius Mpc. Each cluster was obtained using a tree/SPH code adopting a re-simulation technique , which allows a much higher spatial and mass resolution. The masses of these clusters are in the range .
3 Lensing properties of the clusters
We centred each cluster in a cube of side Mpc, where we placed a regular grid of cells. For each of them we extracted three different surface-density fields , by projecting the 3-D density field (obtained by Triangular Shape Cloud method) along the three cartesian axes. This produces three lens planes, which we consider as independent cluster models for the purpose of this study. This made possible to perform 27 different lensing simulations starting from our sample of 9 clusters. We fix the redshifts of the lens and of the source planes equal to and respectively, leading to a value of the critical density for our clusters of Mpc2. We shot a bundle of rays across the central fourth of the lens plane, where most of the cluster mass is projected. In fact, our goal is to study the strong lensing properties of the clusters. The deflection angle of each ray is computed by summing the contribution from all the cells of the grid on which is defined. Finally, solving the lens equation, the arrival positions of the rays on the source plane are calculated. Once the deflection angles are known, all the lensing properties of the cluster can be easily evaluated.
4 Simulating the galaxy distribution inside the cluster
To simulate a population of galaxy lenses inside the cluster, in such a way that their observational properties are well reproduced, we start from the luminosity function of the Coma cluster, whose mass is similar to that or our simulated clusters. This luminosity function has been recently derived in the V-band by Lobo et al. . In the magnitude range (corresponding to the absolute magnitude range ) it is well described by the combination of a steep Schechter function and of a Gaussian function.
Using Monte Carlo methods, we generate a sample of galaxies with luminosities distributed in a way close to the Coma cluster galaxies. To convert the luminosity to masses, we take the average relation (see ). In this procedure the total number of galaxies to place into each simulated cluster is determined by imposing a baryonic fraction equal to that estimated by White et al. for the Coma cluster (, where is the baryonic mass in galaxies and the total mass within the Abell radius). Moreover, to consider the presence of a dark matter halo around each galaxy, we obtain the total (virial) masses by multiplying the baryonic masses previously obtained by the factor , where represents the average baryonic fraction inside single galaxies. As this quantity is not well known observationally, we take a fiducial value (), close to the value predicted by the standard model of primordial nucleosynthesis. To place galaxies inside the cluster in a realistic way, we made the assumptions that the galaxy number density should follow the total density field and that the most massive galaxies should be placed at the centre of the cluster or in other large subclumps.
The galaxies are modelled as spheres with a NFW density profile , truncated at a cut-off radius, where the galaxy density falls below the local cluster density. In fact, for lensing analysis we are interested only to the galaxy mass which emerges from the mean local density of the cluster. Galaxies placed close to the cluster centre have a smaller radius because the cluster density is higher there, so only a small part of the galaxy profile can emerge. The galaxy contribution to the deflection angles can be analytically computed and summed to the contribution from the remaining dark matter in the cluster.
5 Properties of arcs and results
We use our clusters to lens a large number of elliptical sources (with axial ratios randomly drawn in the interval [0.5,1] and area equal to that of a circle of diameter ) on the source plane. Following the method introduced by Miralda-Escudé and developed by Bartelmann & Weiss , we find and classify the images of all these sources, measuring their lengths , widths , curvature radii and length to width ratios . We then perform a statistical analysis of the distributions of the arc properties (more details are presented in ).
The results obtained from the first set of 27 simulations using the original simulated clusters (i.e. without galaxies inside, hereafter “DM” simulations) are compared to those obtained after the introduction of the galaxies in the lens clusters (hereafter “GAL” simulations).
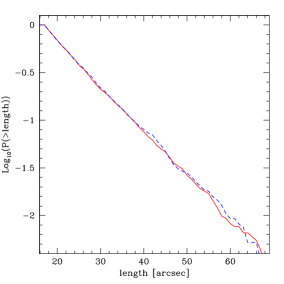
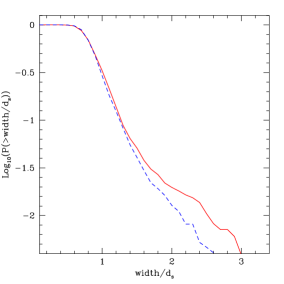
The total number of arcs in the DM and GAL simulations is quite similar: 447112 and 448927 respectively. The majority of these arcs are quite short. Considering only giant arcs with the sample reduces to 1823 and 1721 arcs for DM and GAL simulations. In Figure 1 we show the cumulative distributions of lengths and widths for arcs longer than . The distributions of arc length do not seem to be sensitive to the inclusion of the galaxies in the clusters. We found a similar result also for the distributions of arc curvature radii. On the other hand, the distributions of arc widths show some differences between simulations DM and GAL. Such differences are partially found also between the distributions of arc length to width ratios.
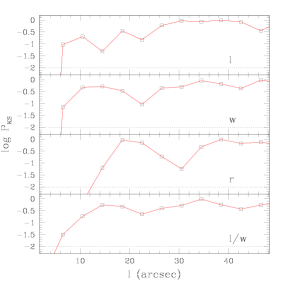
Considering arcs with a given length , we perform the Kolmogorov-Smirnov test to evaluate the significance of the differences between the distributions of the arc properties. The significance level obtained from the test as a function of is also shown in Figure 1 for all the considered arc properties. Concerning arc widths, the probability that the data sets obtained from simulations DM and GAL are drawn from the same distribution becomes slightly lower for arcs with . On the other hand, the differences between the other property distributions become significant only when very short arcs are included in the sample.


6 Conclusions
We expected these effects by cluster galaxies: a) they tend to increase the cluster cross section for strong lensing by wiggling the cluster critical curves, increasing their length; b) because of the larger curvature of the critical lines, they can perturb arcs, splitting them; c) the local steepening of the density profile near cluster galaxies tends to make arcs thinner.
The results of the KS test indicate that, concerning the arc lengths, curvature radii and length to width ratios, the effect of cluster galaxies on arc statistics is negligible if very short arcs are excluded. This means that the first two effects previously mentioned are almost exactly counter-acting and that the splitting of some arcs is partially compensated for the increased strong lensing ability of the clusters (Figure 2). The results show also that, as expected, the galaxies tend to make arcs thinner. This effect becomes evident for arcs shorter than .
The longest arcs, which form in the central regions of the clusters, where most of the mass is concentrated, are not sensitive to cluster galaxies. We think that this is due to the fact that in these dense regions only a small fraction of the total galaxy mass emerges from the underlying dark matter distribution.
References
References
- [1] Bartelmann M. & Weiss A., 1994, A&A, 297, 1
- [2] Lobo C., Biviano A., Durret F., Gerbal D., Le Fevre O., Mazure A. & Slezak E., 1997, A&A, 317, 385
- [3] Meneghetti M., Bolzonella M., Bartelmann M., Moscardini L. & Tormen G., MNRAS, 314, 338
- [4] Miralda-Escudé J., 1993, ApJ, 403, 497
- [5] Navarro J.F., Frenk C.S.& White S.D.M., 1997, ApJ, 490, 493
- [6] Tormen G., Bouchet F.R., White S.D.M., 1997, MNRAS, 286, 865
- [7] Van der Marel R.P., 1991, MNRAS, 273, 710
- [8] White S.D.M., Navarro J.F., Evrard A.E., Frenk C.S., 1993, Nat, 366, 429