email: luett@astro.ruhr-uni-bochum.de
Box- and peanut-shaped bulges ††thanks: Based on observations collected at ESO/La Silla (61.A-0143), DSAZ/Calar Alto, and TIRGO/Gornergrat.
Abstract
We have observed 60 edge-on galaxies in the NIR in
order to study the stellar distribution in galaxies with box/peanut-shaped
bulges.
The much smaller amount of dust extinction at these wavelengths
allows us to identify in almost all target galaxies with
box/peanut-shaped bulges an additional thin, central component in
cuts parallel to the major axis.
This structure can be identified
with a bar.
The length of this structure scaled by the length of the bulge
correlates with the morphologically classified
shape of the bulge. This newly established correlation is therefore
mainly interpreted
as the projection of the bar at different aspect angles.
Galaxies with peanut bulges have a bar seen nearly edge-on and
the ratio of bar length to thickness, ,
can be directly measured for the first time.
In addition, the correlation of the boxiness of bulges
with the bar strength indicates that the bar characteristic could partly
explain differences in the bulge shape.
Furthermore, a new size relation between the box/peanut
structure and the central bulge is found.
Our observations are discussed in comparison to a N-body
simulation for barred galaxies (Pfenniger & Friedli pfe (1991)).
We conclude that the inner region of barred disk galaxies are build up
by three distinct components:
the spheroidal bulge, a thin bar, and a b/p structure most likely
representing the thick part of the bar.
Key Words.:
Galaxies: evolution – Galaxies: spiral – Galaxies: statistics – Galaxies: structure1 Introduction
Our statistical study of 1350 edge-on galaxies derived from the RC3 (Third Reference Catalogue of Bright Galaxies, de Vaucouleurs et al. rc3 (1991)) (Lütticke et al. 2000a , hereafter Paper I) has revealed that 45 % of all bulges (S0-Sd galaxies) are box- and peanut-shaped (b/p). This high frequency must be considered in a theory of bulge formation and especially in scenarios explaining the formation process of b/p bulges.
Currently discussed theories of bulge formation are primordial or secular evolution scenarios. While monolithic collapse (Eggen et al. ELS (1962) (ELS)), clumpy collapse (Kauffmann et al. kau (1993), Baugh et al. bau (1996)), and inside-out formation (van den Bosch bosch (1998), Kepner kep (1999)) are proposed for primordial bulge formation, merging processes (Wyse et al. wys (1997) and references therein) and dynamical evolution triggered by bars (e.g. Combes et al. com90 (1990)) are the basis of secular evolution scenarios. However, combinations of both scenarios are also possible (Combes com99 (2000)).
In the last 20 years several working hypothesis about the origin of b/p bulges have been developed. External cylindrically symmetric torques can act on an initially non-rotating triaxial spheroidal stable system so that it becomes box-shaped (May et al. may (1985)). However, such torques are “problematical to relate to some astrophysical counterparts” (Combes et al. com90 (1990)). Mergers of two disk galaxies are proposed by Binney & Petrou (bin (1985)) and Rowley (row (1988)) as a possible formation process of b/p bulges. However, such a scenario requires very special conditions such as the precise alignment of the spin and orbital angular momenta of the two galaxies (Bureau bur (1998)). A more common process to form b/p bulges could be the accretion of satellite galaxies, although an oblique impact angle of the satellite is needed (Binney & Petrou bin (1985), Whitmore & Bell whi (1988)) and the mass of the accreted satellite is constrained. If it is too large, the stellar disk would be disrupted (Barnes bar (1992), Hernquist her (1993)). The origin of b/p bulges by bars was first proposed by Combes & Sanders (com81 (1981)). This theory was strongly supported ten years later by the studies of Combes et al. (com90 (1990)), Raha et al. (rah (1991)), and Pfenniger & Friedli (pfe (1991)) dealing with N-body simulation of disk galaxies.
The connection between b/p bulges and the presence of a bar is difficult to prove by surface photometry, because b/p bulges are observable only in almost edge-on galaxies. However, there is photometric evidence in a few edge-on galaxies from cuts parallel to the major axis (de Carvalho & da Costa deca (1987), Dettmar & Ferrara df (1996)) and in two intermediately inclined galaxies (Bettoni & Galletta bet (1994), Quillen et al. qui (1997)) pointing to bars. Additionally, kinematic observations of around 20 b/p bulges with characteristic bar signatures in velocity fields and in orbit analyses (e.g. Kuijken & Merrifield kui (1995)) are reported. In addition, our statistics (Paper I) have shown that the overall frequency of barred galaxies ( 55 %, Paper I, Knapen et al. kna2000 (2000)) is able to explain the high fraction of b/p bulges.
On the other side observational evidence for accreted material in b/p bulges is found by Bureau & Freeman (bf (1999)) for a few b/p bulges. Indirect evidences are substructures and asymmetries in some special b/p bulges (Dettmar det89 (1989), Dettmar & Barteldrees 1990a , Lütticke et al. 2000b , hereafter Paper III). Combes et al. (com90 (1990)) and Shaw (sha93 (1993)) conclude from their investigation of b/p bulges, listed by Jarvis (jar (1986)), de Souza & dos Anjos (sa (1987)), and Shaw (sha93 (1993)), that they show less evidence for significant merging and are likely not the result of recent accretion events. However, b/p bulges can indirectly originate from interaction and finally accretion by triggering the formation of bars (Noguchi nog (1987), Gerin et al. ger (1990), Walker et al. wal (1996)), which then actually build up the b/p structures (Fisher et al. fis (1994), Mihos et al. mih (1995)). Therefore the search for bars is one of the best ways to discriminate between the proposed evolutionary scenarios of b/p bulges.
The essential advantage of investigations in the NIR is the small extinction by dust at these wavelengths (Rieke & Lebowsky rie (1985), Knapen et al. kna91 (1991)). Therefore the influence of the dust lane in the plane of edge-on galaxies is largely reduced by NIR observations, especially in the -band. In this way the structure of a galaxy near the plane in radial as well as in vertical direction can be analysed and thereby bars detected (Dettmar & Ferrara df (1996)). In addition it is even possible to determine parameters of bars, e.g. their thickness and projected length. Therefore it is possible to investigate the connection between bars and shapes of bulges.
2 Observation and data reduction
Observations were carried out at the 1.5m TIRGO/Gornergrat in 1994/95 (run identification: TI) with NICMOS3 ARNICA (0.92/pixel), the 1.2m telescope at Calar Alto in June 1996 (CA4) and June 1997 (CA2) with MAGIC (Rockwell NICMOS3 array) using the high resolution mode (1.2/pixel), the 2.2m telescope at Calar Alto during two runs in January 1997 (CA3) and March 1998 (CA1) also equipped with MAGIC (hr mode: 0.64/pixel), and at ESO/La Silla with the 2.2m telescope in May 1998 (E1) with IRAC-2b (NICMOS3 array) using the LC objective (0.49/pixel). To the resulting sample of 56 galaxies four galaxies kindly provided by Emsellem (E2: ESO/La Silla 2.2m telescope, April 1998, IRAC-2b, LC objective) are added. The sample was selected from the list of edge-on galaxies with bulge classification (Paper I) according to the allocated observing time, matching the field size, and covering all bulge types. Filters and typical on-source integration times for each observing run are listed in Table 1 and the final sample is given in Table 2. At ESO/La Silla and TIRGO the - resp. -band filters were used. Due to large thermal emission in for MAGIC we observed at Calar Alto mainly in . Using different filters we can show that the bulge shape in the NIR is independent from the observed wavelengths (Paper I).
| (1) | (2) | (3) | (4) | (5) |
|---|---|---|---|---|
| obs. run | f | int. time | seeing | num. of gal. |
| TI | 40 | 1.8 | 10 | |
| CA1 | 20 | 1.5 | 2 | |
| CA1 | 32 | 1.5-2.5 | 20 | |
| CA1 | 25 | 1.5 | 2 | |
| CA2 | 22 | 2-3 | 18 | |
| CA3 | 5 | 1.8 | 4 | |
| CA3 | 5 | 1.8 | 4 | |
| CA3 | 6 | 1.8 | 4 | |
| CA4 | 30 | 2.8 | 4 | |
| E1 | 20 | 1.5 | 5 | |
| E2 | 12 | 1.5 | 4 |
Notes:
Col. (1): Observing run; abbreviation see text.
Col. (2): Filter.
Col. (3): Typical integration time on source in minutes.
Col. (5): Number of observed galaxies; some galaxies were observed twice.
Data reduction is performed with standard techniques for NIR images: dark subtraction, sky background subtraction, bad pixel correction, and flatfielding (CA1-4: sky flats, E1+2: dome flats) (see e.g. MAGIC Observer’s Guide 111http://www.caha.es/CAHA/Instruments or ESO-MIDAS User Guide, Volume B 222http://www.eso.org/projects/esomidas). The sky background frames are determined by offsets, after each object frame, integrating sky images with the same time as used for the object images. Combining the individually reduced object frames leads to the final image of the galaxy. For the photometric calibration of the images infrared standard stars (Elias et al. eli (1982); Persson et al. per (1998)) are used giving a photometric error of mag. The data obtained at TIRGO are calibrated using published integrated aperture data.
3 Analysis of the data
Following Wakamatsu & Hamabe (wak (1984)) “bumps”, which are symmetric to the minor axis, in cuts along or parallel to the major axis of edge-on disk galaxies can be associated with bars. This is indicated by the fact that the bump becomes more and more insignificant at larger distances from the plane (D’Onofrio et al. dono (1999)). Using this technique bars in edge-on galaxies NGC 4762 (Wakamatsu & Hamabe wak (1984)), NGC 1381 (de Carvalho & da Costa deca (1987)), NGC 5170 (Dettmar & Barteldrees 1990b ), NGC 4302 (Dettmar & Ferrara df (1996)), NGC 3250B, NGC 5047, NGC 6771, IC 4767 (Lütticke lue99 (1999)), and at a marginal level in NGC 128 (D’Onofrio et al. dono (1999)) have been found. However, for edge-on galaxies these radial cuts are obviously hampered by dust near the plane. Therefore previous studies using optical observations are limited to early type galaxies with low dust content or the resulting evidence for a bar remain uncertain (NGC 5170). The influence of dust is significantly reduced in the NIR enabling the identification of bars also in late type spirals (Dettmar & Ferrara df (1996)).
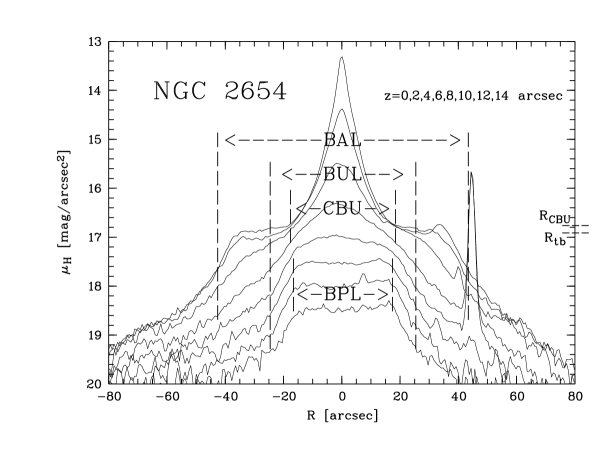
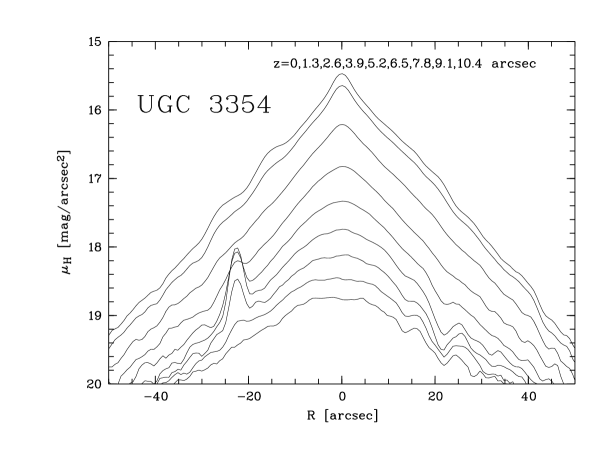
Therefore we have searched for bumps, which are signatures of a bar, in radial cuts of the galaxies in our NIR-sample. Additionally, the shape of the bumps in the cuts along and parallel to the major axis can be divided in profiles with a flat part and in profiles decreasing from the center of the galaxy throughout. For these purposes we have determined the surface brightness at the radial position of the top of the bump () and at the end of the central bulge (). We call the feature in the cuts “strong bar signature”, if the gradient
is smaller than 0.015 mag arcsec-1 (Fig. 1 and 5). Otherwise the bump is called “weak bar signature” (Fig. 2). The error of this gradient is 0.003 mag arcsec-1. An example for a galaxy without a bar signature is given in Figure 3.
For galaxies showing a bar signature several characteristic quantitative parameters are derived from the cuts parallel to the major axis (for illustration see Fig. 1):
-
•
BAL: The projected bar length is marked in the cut along the major axis by an increasing light distribution towards the center compared to the radial exponential light distribution (Pohlen et al. poh (2000)) of the disk.
-
•
BAT: The bar thickness is defined by the vertical extent of cuts showing the bar signature.
-
•
CBU: We introduced the length of the central bulge as the length of the structure being brighter than the bar signature.
-
•
BUL: The bulge length is marked by the increasing light distribution over the exponential disk well above the bar.
-
•
BPL: The length of the b/p structure is distance between the maxima of the b/p distortion. This parameter is obviously only definable for peanut bulges.
However, taking into account seeing effects the measured values are only upper limits.

For 17 galaxies of our sample it is not possible to search for bar signatures. Sometimes the heavy dust extinction near the plane, even in the NIR, prevents a final analysis. In other galaxies extra features (e.g. stars or possible spiral arms), asymmetrical structures, or low signal-to-noise ratios would lead to a too uncertain verification of a bar. Therefore the resulting sample is reduced to 43 galaxies.
4 Results
| (1) | (2) | (3) | (4) | (5) | (6) | (7) | (8) | (9) | (10) | (11) | (12) |
| Object | bulge | bar | BAL | BAT | BUL | CBU | BPL | BAL/ | BAL/ | BAL/ | CBU/ |
| type | [] | [] | [] | [] | [] | BAT | BUL | BPL | BPL | ||
| IC 2233 | 3 | ? | |||||||||
| NGC 2683 | 2 | ? | |||||||||
| NGC 3628 | 1 | ? | |||||||||
| NGC 4026 | 4 | WB | 64 | 6 | 62 | 26 | 10.7 | 1.0 | |||
| NGC 4217 | 4 | – | |||||||||
| NGC 4302 | 2 | SB | 76 | 8 | 46 | 22 | 9.5 | 1.7 | |||
| NGC 4634 | 4 | ? | |||||||||
| NGC 4762 | 4 | WB | 120 | 8 | 104 | 30 | 15 | 1.2 | |||
| NGC 5908 | 4 | – | |||||||||
| NGC 5775 | 3 | ? | |||||||||
| UGC 3354 | 4 | – | |||||||||
| UGC 3458 | 3 | – | |||||||||
| NGC 2654 | 1 | SB | 86 | 6 | 50 | 36 | 34 | 14.3 | 1.7 | 2.5 | 1.1 |
| NGC 2862 | 1 | SB | 74 | 5 | 42 | 24 | 26 | 14.8 | 1.8 | 2.8 | 0.9 |
| NGC 2939 | 3 | WB | 34 | 4 | 26 | 12 | 8.5 | 1.3 | |||
| UGC 5904 | 3 | ? | |||||||||
| NGC 3669 | 2 | ? | |||||||||
| NGC 3986 | 1 | ? | |||||||||
| NGC 3987 | 1 | ? | |||||||||
| IC 755 | 3 | ? | |||||||||
| NGC 4469 | 1 | SB | ? | 24 | 96 | 60 | 60 | 1.0 | |||
| NGC 5014 | 4 | ? | |||||||||
| NGC 5166 | 1 | SB | 44 | 3 | 26 | 16 | 14 | 14.7 | 1.7 | 3.1 | 1.1 |
| UGC 8737 | 3 | ? | |||||||||
| NGC 5470 | 4 | – | |||||||||
| NGC 5492 | 4 | – | |||||||||
| UGC 9759 | 2 | – | |||||||||
| UGC 9841 | 2 | WB | 46 | 4 | 28 | 18 | 11.5 | 1.6 | |||
| UGC 10205 | 3 | – | |||||||||
| NGC 6310 | 2 | SB | 62 | 7 | 34 | 24 | 8.9 | 1.8 | |||
| NGC 5859 | 2 | SB | 52 | 8 | 34 | 20 | 6.5 | 1.5 | |||
| NGC 5864 | 3 | WB | 66 | 10 | 50 | 36 | 6.6 | 1.3 | |||
| UGC 9853 | 4 | – | |||||||||
| UGC 9858 | 4 | WB | 30 | 4 | 26 | 10 | 7.5 | 1.2 | |||
| NGC 5981 | 4 | – | |||||||||
| UGC 10227 | 3 | WB | 34 | 4 | 20 | 14 | 8.5 | 1.7 | |||
| UGC 10447 | 4 | – | |||||||||
| NGC 6361 | 4 | ? | |||||||||
| UGC 11455 | 4 | – | |||||||||
| UGC 11893 | 4 | – | |||||||||
| UGC 11973 | 2 | ? | |||||||||
| NGC 7264 | 4 | – | |||||||||
| NGC 7339 | 3 | ? | |||||||||
| UGC 12506 | 4 | – | |||||||||
| NGC 7640 | 2 | ? | |||||||||
| NGC 1175 | 2+ | SB | 54 | 5 | 36 | 20 | 10.8 | 1.4 | |||
| NGC 2424 | 1∗ | SB | 76 | 6 | 36 | 28 | 32 | 12.7 | 2.1 | 2.4 | 0.9 |
| NGC 3098 | 3 | WB | 30 | 3 | 26 | 18 | 10 | 1.2 | |||
| NGC 3762 | 3∗ | – | |||||||||
| NGC 5707 | 4 | – | |||||||||
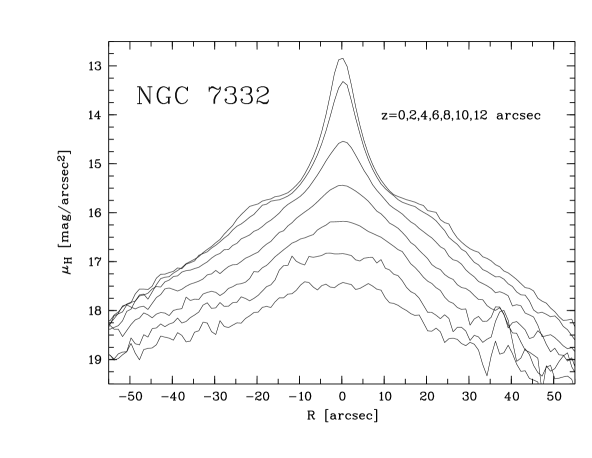
| NGC 7332 | 3 | WB | 56 | 6 | 40 | 24 | 9.3 | 1.4 |
Table 2 continued.
| (1) | (2) | (3) | (4) | (5) | (6) | (7) | (8) | (9) | (10) | (11) | (12) |
|---|---|---|---|---|---|---|---|---|---|---|---|
| Object | bulge | bar | BAL | BAT | BUL | CBU | BPL | BAL/ | BAL/ | BAL/ | CBU/ |
| type | [] | [] | [] | [] | [] | BAT | BUL | BPL | BPL | ||
| ESO 560- 13 | 2+ | ? | |||||||||
| NGC 2788A | 1 | SB | 90 | 6 | 38 | 30 | 28 | 15 | 2.4 | 3.2 | 1.1 |
| ESO 506- 3 | 3∗ | – | |||||||||
| ESO 443- 42 | 1 | SB | ? | 5 | 46 | 24 | 24 | 1.0 | |||
| IC 4745 | 3∗ | – | |||||||||
| IC 760 | 3 | WB | 36 | 3 | 26 | 16 | 12 | 1.4 | |||
| NGC 2310 | 2 | SB | ? | 5 | 44 | 30 | |||||
| NGC 3203 | 3 | SB | 50 | 4 | 34 | 24 | 12.5 | 1.5 | |||
| NGC 6771 | 1 | SB | 70 | 5 | 44 | 28 | 32 | 14 | 1.6 | 2.2 | 0.9 |
Notes:
Col.(1): Galaxies are ordered by RA for each observing run separated
by lines (TI, CA1, CA2, CA3,
CA4, E1, and E2 ).
If a galaxy is observed twice, only the data with higher quality
are listed.
Col.(2): Bulge type as defined in Paper I
in the NIR, except ∗:
optical bulge type (Paper I), because signal-to-noise ratio in the NIR image
is too low.
Col.(3): Bar signatures: – = no signature, WB = weak bar signature,
SB = strong bar signature, ? = uncertain (see text)
Col.(4) - (7):
Abbreviations see text. ? = BAL is larger than
the size of the image.
Errors of the measurements : BAL and BUL 20 %,
BAT 30 %, CBU and BPL 10 %.
The derived bar signatures and parameters for our sample are presented in Table 2. Furthermore, we have computed characteristic ratios of the parameters (Table 2).
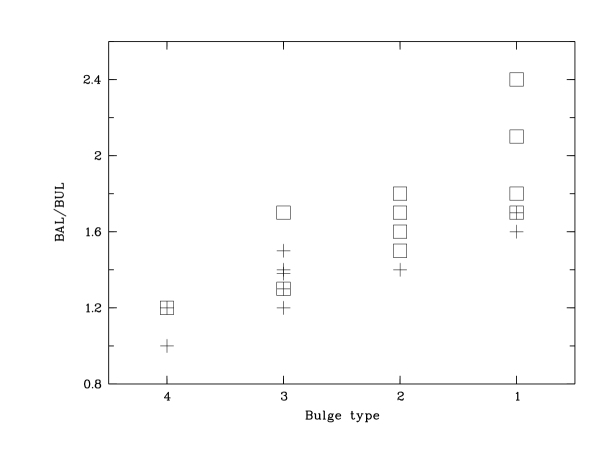
In Paper I we have visually classified bulge shapes in three types of b/p bulges (1: peanut-shaped, 2: box-shaped, 3: nearly box-shaped) and one elliptical type (4). Regarding the ratio of the projected bar length to the bulge length (BAL/BUL) we measure a clear trend with the bulge type (Fig. 4): The more prominent the b/p type, the larger the ratio. The mean value for type 1 bulges is BAL/BUL , type 2: , type 3: , and type 4: . However, we are dealing with small number statistics, , and the scatter is relatively high. This could be explained by the different morphological types contributing to these statistics, because early type galaxies have smaller ratios than late types (Fig. 4). Additionally, according to Martin (mar (1995)), Elmegreen & Elmegreen (2elm95 (1995)), and Elmegreen et al. (elm (1996)) the relative bar length () has also a high scatter pointing to a large range of bar lengths.
Two other characteristic ratios, CBU/BPL and BAL/BPL, are only related to peanut bulges. They can be compared with predictions of N-body simulations and thereby test the evolution scenario of b/p bulges proposed in these simulations (see next section). The mean value of BAL/BPL is (Table 2). A surprising result for CBU/BPL is the mean value of 1.0 with the small scatter of 0.1 (Table 2 and Fig. 1).
| classified | number of galaxies with | ||
|---|---|---|---|
| bulge type | no sig. | WB 1 | SB 2 |
| 1 | 0 | 0 | 8 |
| 2 | 0 (1) | 2 | 5 |
| 3 | 1 (4) | 5 | 1 |
| 4 | 13 | 3 | 0 |
Notes:
galaxies in brackets are excluded (see text)
1: Weak bar signature
2: Strong bar signature
Five out of the six galaxies without a bar signature (Table 3), but with a b/p bulge are thick boxy bulges (TBBs) (Dettmar & Lütticke dl (1999)). This group of galaxies shows remarkable morphological features such as large asymmetries and substructures and the box-shape is more prominent in the outer part of the bulge, possibly pointing to a different formation scenario. Therefore this group of b/p bulges will be studied separately in a forthcoming paper (Paper III). The remaining galaxy (NGC 3762) without bar signature and b/p bulge is classified as a weak type 3 bulge on an optical image (Paper I). Excluding the five TBBs from Table 3 there is an almost one-to-one correspondence between b/p bulges and bar signatures. The fraction of b/p bulges with such a signature is 95 % whereas over 80 % of the non-b/p bulges show no bar signature. Additionally, it should be mentioned that the three galaxies (NGC 4026, NGC 4762, and UGC 9858) with a bar signature and without a b/p bulge have the smallest BAL/BUL ratios in our sample (Table 2 and Fig. 4). Table 3 reveals a significant correlation on one side between strong bar signatures and prominent b/p bulges (type 1 + 2) and on the other side between weak bar signatures and less pronounced b/p bulges of type 3. This strong dependence is shown on a 1.0 % significance-level by a -test. We do not find a correlation between the Hubble type and the weak or strong bar signature.
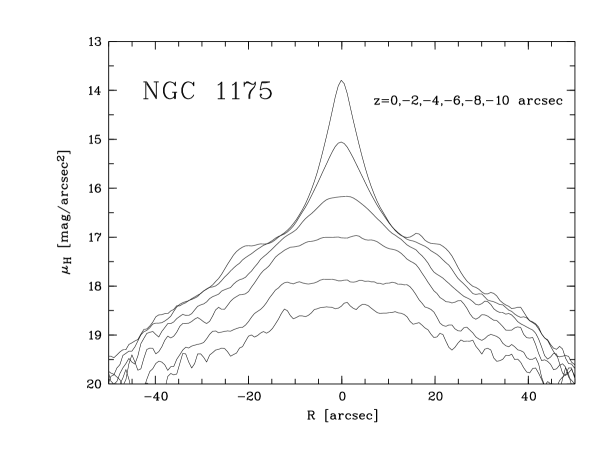
For NGC 1175 (Fig. 5) and NGC 3203 we measure a strong bar signature. Therefore the classification as unbarred systems within the RC3 can be replaced. Since the bar classification for edge-on galaxies is difficult and lead to misclassifications in galaxy catalogues based on photographic plates, our method of bar detection points at a solution for this problem.
5 N-body simulation
5.1 Model
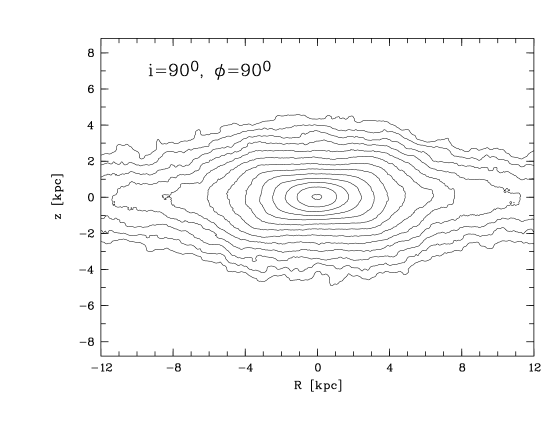
The origin of b/p bulges based on the evolution of bars is shown in several N-body simulations (e.g. Combes et al. com90 (1990), Pfenniger & Friedli pfe (1991)). To check the consistency of simulations with the results of our observations, we have investigated a representative simulation of a barred galaxy. For this purpose a particle position file of the final stage of a N-body simulation of a barred galaxy in three dimensions was kindly made available by Daniel Pfenniger. The simulation uses a particle-mesh code with 200.000 particles described in Pfenniger & Friedli (pfe (1991)). They choose axisymmetric initial conditions which are likely to develop a bar instability on their own and an initial mass distribution corresponding to a superposition of two axisymmetric Miyamoto-Nagai disks. The provided binary file represents the final time step of their simulation at T = 5000 ( 5 Gyrs) in which a bar is formed. The length unit is chosen to be one kpc (Pfenniger & Friedli pfe (1991)). For the transformation of the three-dimensional mass distribution of the particles to a two-dimensional surface brightness distribution we assume a constant M/L ratio and take into account the inclination () of the galaxy and the aspect angle () of the bar. An edge-on bar is denoted with , while refers to an end-on bar.
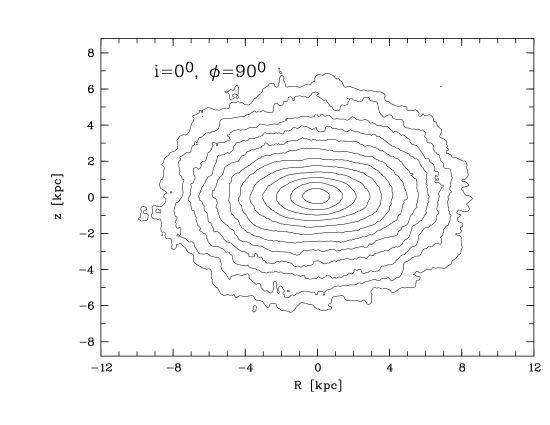


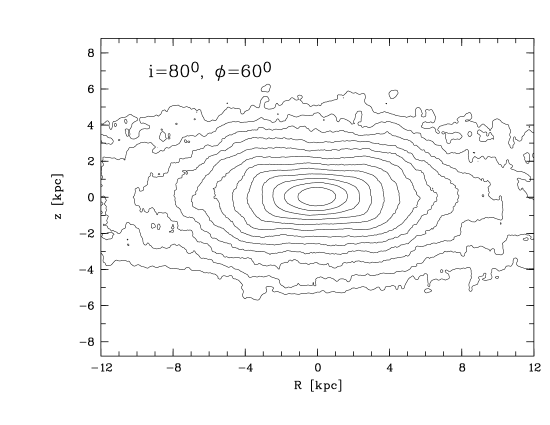
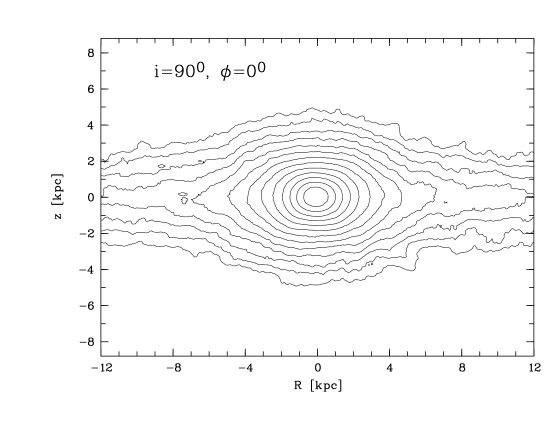
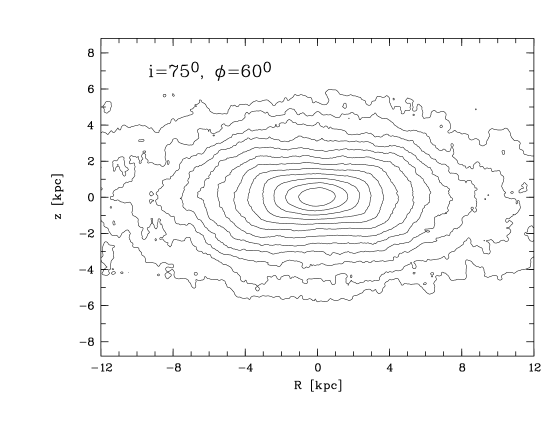
5.2 Classification of the bulges
In the investigated N-body simulation the peanut shape of bulges can be detected down to a galaxy inclination of , if the bar is edge-on. If the galaxy is exactly edge-on, peanut bulges can be seen down to an aspect angle of the bar of . In general the simulation shows that the degree of boxiness of the bulge, reflected by the bulge type, is weakened with decreasing inclination of the galaxy (Fig. 6, Table 4). At inclinations lower than 75∘ it is not possible to distinguish between structures perpendicular to the galactic plane and the bar itself. This value was also previously found by Shaw et al. (sdb (1990)) as limit for the observation of b/p bulges. Regarding galaxy inclinations above this limit the b/p morphology is detected in the simulation whenever is larger than 20∘. In this way 77 % of projection angles of bars result in b/p bulges (Table 4). Combes et al. (com90 (1990)) find in their simulations a similar percentage (85 %) for “favourable” projection angles to see b/p bulges in galaxies with an inclination between 80∘ and 90∘.
Since the frequencies of the simulated bulge types (Table 4, Col. 4) are derived only from a barred galaxy, these frequencies must be modified to compare them with our statistics of bulge types (Paper I) derived from all edge-on galaxies, with bar and without. Taking this into account the percentages for the bulge types of the simulated galaxy have to be multiplied with the observed fraction of barred galaxies. Adding afterwards the fraction of unbarred galaxies to the percentage of bulge type 4 — N-body simulations (Pfenniger & Friedli pfe (1991)) suggest that unbarred galaxies have such a bulge type — leads to the modified frequencies of the bulge types (Table 4, Col. 5 and 6). The errors of these frequencies depend on the uncertainties of the limits in the aspect angle of the bar () (up to ) and have values of 2.5 % for type 1 and 4 bulges and 5 % for type 2 and 3 bulges. The observed frequencies of the bulge types (Paper I; type 1: 4.1 %, type 2: 15.7 %, type 3: 25.2 %, and type 4: 55.0 %) are very similar (inside the errors) to the modified frequencies computed with a fraction of 55 % barred galaxies. This percentage is revealed by studies from optical surveys (e.g. RC3) (Ho et al. ho (1997), Knapen et al. kna2000 (2000), Paper I). However, the higher percentage of 70 % derived from NIR studies (Mulchaey & Regan mul (1997), Knapen et al. kna2000 (2000), Eskridge et al. esk (2000)) seems to be more reliable, since the NIR-light traces the dominant, old stellar population and is relatively unaffected by dust. Using this fraction for computing the modified frequencies, there is a difference of 10 % between observed and modified frequencies of galaxies with b/p bulges (type 1-3). There are less b/p bulges observed as computed from the investigated simulation coupled with NIR observations.
The existence of galaxies with non-b/p bulges, but with bars (Tab. 2) are consistent with the simulation where almost end-on orientated bars lead to elliptical bulges.
| (1) | (2) | (3) | (4) | (5) | (6) |
| bulge | fre- | mod. | mod. | ||
| type | quency | frequency | frequency | ||
| 1 | 90∘ | 77∘-90∘ | 14.4 % | 7.9 % | 10.1 % |
| 2 | 90∘ | 47∘-76∘ | 33.3 % | 18.3 % | 23.3 % |
| 3 | 90∘ | 16∘-46∘ | 34.5 % | 19.0 % | 24.1 % |
| 4 | 90∘ | 0∘-15∘ | 17.8 % | 54.8 % | 42.5 % |
| 1 | 85∘ | 81∘-90∘ | 10.0 % | 5.5 % | 7.0 % |
| 2 | 85∘ | 52∘-80∘ | 32.2 % | 17.7 % | 22.5 % |
| 3 | 85∘ | 18∘-51∘ | 37.8 % | 20.8 % | 26.5 % |
| 4 | 85∘ | 0∘-17∘ | 20.0 % | 56.0 % | 44.0 % |
| 1 | 80∘ | 85∘-90∘ | 5.6 % | 3.1 % | 3.9 % |
| 2 | 80∘ | 57∘-84∘ | 31.1 % | 17.1 % | 21.8 % |
| 3 | 80∘ | 20∘-56∘ | 41.1 % | 22.6 % | 28.8 % |
| 4 | 80∘ | 0∘-19∘ | 22.2 % | 57.2 % | 45.5 % |
| 1 | 75∘ | 89∘-90∘ | 1.1 % | 0.6 % | 0.8 % |
| 2 | 75∘ | 66∘-88∘ | 25.6 % | 14.1 % | 17.9 % |
| 3 | 75∘ | 30∘-65∘ | 40.0 % | 22.0 % | 28.0 % |
| 4 | 75∘ | 0∘-29∘ | 33.3 % | 63.3 % | 53.3 % |
Notes:
Col. (1): Bulge type as defined in Paper I.
Col. (2): Inclination of the simulated galaxy.
Col. (3): Aspect angle of the bar ( = edge-on and
= end-on).
Col. (4): Frequency of the bulge type of the simulated galaxy,
viewed under different
aspect angles, at a constant inclination.
Col. (5): Modified frequency of the bulge type of the simulated galaxy,
viewed under different aspect angles, at a constant inclination
taking into account
that only 55 % of all galaxies are barred
and the remaining galaxies
without a bar (45 %) have a bulge of type 4.
Col. (6): As Col. (5), but with 70 % barred and 30 % unbarred galaxies
5.3 Quantitative parameters
Along the bar major axis of the simulated galaxy, measured in the face-on case (), the decrease of the surface density is exponential (Pfenniger & Friedli pfe (1991)) and the length of the bar can be determined to 20 kpc. This length exactly fits inside the radius of corotation which occurs at 10 kpc (Pfenniger & Friedli pfe (1991)). The axis ratio of the bar is (Fig. 4, top right) and is inside the range of observed values (0.2 - 1) (Martin mar (1995)).
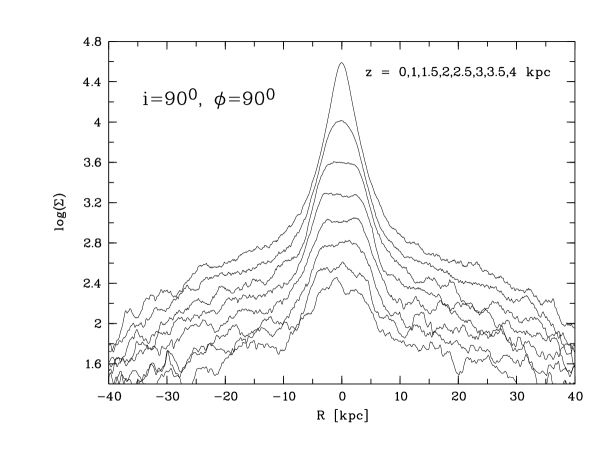
Regarding the galaxy edge-on () with an edge-on orientated bar () is the best way to derive the quantitave bar parameters (introduced in section 3) of the simulated galaxy, because bar and b/p structures are most prominent at this geometry. However, the cuts along and parallel to the major axis do not reveal the typical bar signature (Fig. 7) which is visible in the NIR observations. The three components bulge, bar, and central part of the bulge cannot be distinguished as it is possible in the observations (cf. Fig. 1, 2, and 5). Due to the lack of a bar signature the bar thickness as well as the central bulge length (CBU) cannot be determined. The ratio of BAL/BUL , taking into account BAL kpc and BUL kpc (Fig. 7), is not consistent with the observed ratios for peanut bulges () (Fig. 4), while BAL/BPL (BPL 8 kpc; Fig. 7) is consistent with observed ratios in peanut bulges (BAL/BPL ). While in observations the positions of the maxima of the b/p distortion coincide with the limits of the central bulge, in the N-body simulation the positions of the maxima are not related to any other features in the profiles.
5.4 Relevance of the simulated galaxy for observations
The differences between the galaxy derived from the N-body simulation and the observed galaxies likely result from the initial conditions of the simulated model. Pfenniger & Friedli (pfe (1991)) are just using two merged disks with the same rotation properties instead of an independent bulge component in their simulation. The inner disk represents the “bulge” and is chosen with the main purpose “to have sufficient freedom to shape the initial rotation curve”. Therefore the initial resemblance with a real bulge is only approximate. Using such a bulge component in the simulation could also be the reason for the lack of the bar signature when the galaxy is seen edge-on, since the inner disk could cover the signature. Another explanations for the fact that no bar signature is visible could lay in the limited spatial resolution or in the lack of gas in the simulation, which influences the bar structure. It is also possible that the exponential decrease of the bar surface brightness and the smooth end of the bar prevent the detection of a bar signature.
Additionally, the investigated simulated galaxy is only a single, although representative, example of a barred galaxy. Variations of the initial conditions such as the bulge-to-disk ratio, Q parameter, gas fraction and distribution, and halo structure end up in different bar strenghts, shapes, thickness, lenghts, and density profiles in N-body simulations (e.g. Friedli & Benz friben (1993)). Therefore conclusions drawn from comparisons between our statistics of observed bulge types (Paper I) and results from the simulated galaxy, which is investigated in this study, are limited. Future studies have to analyse recently published simulations of barred galaxies (e.g. Pfenniger pfe2000 (1999)) to get more relevant comparisons with observations.
6 Discussion
6.1 Bars and b/p bulges
The strong correlation of the bar signature with b/p bulges in our study shows that b/p bulges are well explained by dynamical processes in bar potentials. The ratio of the bar length to the length of the b/p distortion (BPL) () in the simulated barred galaxy and the observed ratio of BAL/BPL () in galaxies with peanut bulges is consistent with such a scenario.
The correlation of the bar signature with b/p bulges is previously claimed, using the same detection method, by the investigations of individual galaxies, namely NGC 1381 (de Carvalho & da Costa deca (1987)), NGC 5170 (Dettmar & Barteldrees 1990b ), and NGC 4302 (Dettmar & Ferrara df (1996)). Many further evidences for the connection between bars and b/p bulges are reported in the literature: Bettoni & Galletta (bet (1994)) and Quillen et al. (qui (1997)) find them in their investigation of the intermediately inclined galaxies NGC 4442 resp. NGC 7582. Furthermore, N-body simulations (e.g. Combes et al. com90 (1990), Raha et al. rah (1991), Pfenniger & Friedli pfe (1991)) show that the evolution of a b/p bulge is coupled with the development of a bar.
Independent evidence is obtained by observing the gas kinematics in N II and H. The characteristic “figure-of-eight” rotation curve which is a strong signature for the presence of a bar and is detected in many b/p bulges: e.g. NGC 5746, NGC 5965 (Kuijken & Merrifield kui (1995)), NGC 2683 (Merrifield mer96 (1996)), and additional ten further galaxies by Bureau & Freeman (bf (1999)) and five by Merrifield & Kuijken (mer (1999)). Control samples of non-b/p bulges show no kinematical signature of a bar (Bureau & Freeman bf (1999), Merrifield & Kuijken mer (1999)). In two b/p bulges (ESO 597- 36 and NGC 3390) without kinematic bar signature Bureau & Freeman (bf (1999)) find indications for accretion events. However, since the positioning of the slit was difficult (Bureau & Freeman bf (1999)), dust in the galactic plane could affected their observations. Therefore bars can not be excluded in these two galaxies. A merger-induced bar formation with a resulting b/p bulge (Mihos et al. mih (1995)) could be a possible scenario for these galaxies. The four detected non-b/p bulges: NGC 5907 (Miller & Rubin mil (1995)), IC 5096, ESO 240- 11 (Bureau & Freeman bf (1999)), and NGC 681 (Merrifield & Kuijken mer (1999)) with a bar signature in the gas kinematics can be explained by our analysis of the N-body simulation with bars which are nearly end-on (see next subsection).
Signatures of the gas kinematics in barred potentials are also detected in retrograde orbits of NGC 128 (Emsellem & Arnault ems (1997)), the galaxy with one of the most prominent b/p bulges (D’Onofrio et al. dono (1999)). Direct kinematic evidence for bar streaming motions in two galaxies with b/p bulges (NGC 3079 and NGC 4388) is presented by Veilleux et al. (vei (1999)). Furthermore, in H I the presence of a bar is also verified in one galaxy with a peanut bulge analysing the position velocity diagram (IC 2531: Bureau & Freeman bur97 (1997)). The gas kinematics in the central region obtained in CO ( line) in the case of NGC 3628 (Reuter et al. reu (1991)), NGC 891 (Garcia-Burillo & Guelin gar (1995)), and NGC 4013 (Garcia-Burillo et al. gar99 (1999)) again point to the presence of a bar.
The conclusion (often given in the literature, e.g. Pfenniger & Friedli pfe (1991)), that b/p bulges are thick bars, cannot be supported. From the observational point of view bars and bulges, if b/p-shaped or not, are obviously individual components with different lengths (e.g. Fig. 1). Stellar orbits in a barred potential build up b/p structures and the bar itself. Therefore b/p bulges are the composition of a spheriodal bulge and a b/p structure representing the thick part of the bar.
The non-detection of bars (Table 3) in all observed TBBs ( 5 % of all b/p bulges belong to this group, Paper III) is an indication for the hypothesis that the boxiness of these bulges is not related to the the presence of a bar. This idea gets more convincing support from the fact that the extent of the box shape is too large to result from an usual bar potential (Paper III). However, the lack of a bar signature does not necessarily mean that there is no bar, since weak bars, which have exponential surface brightness profiles (Elmegreen & Elmegreen 2elm89 (1989)), could remain undetecable by the here presented search for a bar signature.
In this way also the missing bar signature in the simulated barred galaxy is explainable, because the surface density distribution along the simulated bar is exponential and additionally, the bar axis ratio of this galaxy points to a weak bar (, Martinet & Friedli marfri (1997)).
6.2 Explanations for various bulge shapes
The connection between b/p bulges and bars can be understood as interplay between resonant bending fed by vertical diffusion of orbits and instabilities similar to the fire-hose one (Bureau bur (1998), Friedli fri (1999)). While there is evidence for this connection in the most galaxies with b/p bulges, the question for the different shape of the b/p bulges remains to be answered.
A correlation between a strong signature of a bar, marked by constant surface brightness in radial direction (cf. section 3), and prominent b/p bulges is found in our study. Thereby the strong bar signature can be associated with a flat bar, which is known to be strong (Elmegreen & Elmegreen 2elm89 (1989)). Therefore the correlation can be interpreted by the assumption that strong barred galaxies are responsible for prominent b/p bulges, while galaxies with a weak bar have bulges with a lower degree of boxiness. N-body simulations by Friedli (fri (1999)) support this explanation for different bulge shapes. In this way it is also possible to explain partly the observed correlation of BAL/BUL with the bulge type (cf. section 4) by larger bars in galaxies with prominent b/p bulges, because flat bars tend to be larger (Elmegreen & Elmegreen 2elm95 (1995), Elmegreen et al. elm (1996)). Since this correlation holds for early as well as for late types, it cannot be explained by the fact that the same bar will produce more pronounced b/p bulges, the smaller the pre-existing spheroidal bulge is. However, having this in mind it is not surprising that the weak bar of the here investigated simulated galaxy can produce a peanut bulge. Furthermore, one could expect that peanut bulges more often occur in late type spirals, but the observed fraction of peanut bulges in galaxies in the range of S0-Scd is rather constant and equal to zero in spirals later than Sc (Paper I). This result could be interpreted by a dependence of the bar strength on the Hubble type. Such a correlation of bars is found by Elmegreen & Elmegreen (2elm (1985)) and Elmegreen et al. (elm (1996)). However, in contrast to them Seigar & James (sei (1998)) do not find that flat (strong) bars are more common in early Hubble types and exponential (weak) bars in later types. This statement is in agreement with our results for the profiles of bar signature concerning the Hubble type, but it is uncertain, if their results concerning bar morphology detected in face-on galaxies can be transformed to bar signatures in edge-on galaxies.
Additionally, for the explanation of bulge shapes it has to be taken into account that gas mass and a central black hole effect the shape of bulges. A significant fraction of gas mass (Berentzen et al. ber98 (1998)) or a supermassive central black hole can weaken the b/p structure (Friedli fri (1999)).
Explaining bulge shapes by aspect angles of bars was introduced by N-body simulations (Combes et al. com90 (1990), Pfenniger & Friedli pfe (1991)). Kinematical bar diagnostics in edge-on spiral galaxies using simulations of families of periodic orbits and hydrodynamical simulations are also consistent with observations. They confirm the dependence of the boxiness on the aspect angle of the bar (Bureau & Athanassoula ba (1999), Athanassoula & Bureau ab (1999)). An exact determination of aspect angles is not possible, because the envelope of the signature of the outer bar region in the position-velocity diagram is too faint (Athanassoula & Bureau ab (1999)).
The strong correlation of BAL/BUL with the bulge type and the agreement of the observed ratio BAL/BUL only of the most prominent b/p bulges, , with that ratio obtained for face-on galaxies, (Athanassoula & Martinet ath (1980), Baumgart & Peterson baum (1986), Martin mar (1995)), shows that the differences in BAL/BUL can be interpreted by different aspect angles of bars. Therefore our analysis points also to a dependence of the shape of a bulge on the aspect angle of the bar. In this way and consistent with our investigation of the simulated barred galaxy peanut bulges result from bars seen nearly edge-on (large projected bar length, BAL), boxy bulges from intermediately inclined bars, and elliptical ones from end-on bars (small BAL) or they have no bar at all. Thereby bars detected in non-b/p bulges can be explained as well as differences between the fraction of barred galaxies (70 % in the NIR) and galaxies with b/p bulges (45 %), although also other parameters might play a role (weak bar, large gas mass, or dominant bulge component). The dependence of the bulge shape on the aspect angle of the bar is also supported in our study by the modified frequencies of the bulge types derived in the simulation. These frequencies are consistent with the observed frequencies of the bulge types, if one keeps in mind that only a single simulated barred galaxy is compared with all morphological types of disk galaxies. Larger bulge components in the simulation would weaken the b/p structures and thereby reduce the modified frequency of b/p bulges. Stronger bars would have the contrary effect on the modified frequency. Additionally, many galaxies of our investigated sample with peanut bulge and strong bar signature show features at the ends of the bumps, which can be associated with spiral arms extending outward from the ends of a bar (Baggett & MacKenty bag (1996)). Therefore it can be suggested that bars of these galaxies are indeed nearly edge-on.
There exists only a few rough estimates of aspect angles of bars in edge-on galaxies from observations. Wakamatsu & Hamabe (wak (1984)) adopt for NGC 4762 (bulge type 3 in the optical, type 4 in the NIR; Paper I) an aspect angle of the bar of (although a lower limit of 21∘ is also possible from their argumentation) and Garcia-Burillo & Guelin (gar (1995)) for NGC 891 (bulge type 2) . These results are in agreement with a dependence of the bulge shape on the bar aspect angle.
6.3 A new correlation
The coincidence of the positions of the maxima of the b/p distortion with the limits of the central bulge, which is found here for the first time, cannot finally be explained (). Selection effects due to different aspect angles of the bar, which would influence the length of the b/p distortion (BPL), can be neglected, since we have shown that peanut bulges, for which BPL is defined only, can be associated with nearly edge-on bars. The coincidence points also to a possible connection between the bar length and the length of the central bulge (CBU), since BPL is connected with BAL.
Therefore possible explanations could be related to secondary bars (e.g. Friedli fri (1999), Greusard et al. gre (2000)). This idea is supported by the result from N-body simulations (Friedli & Martinet frimar (1993)) that the corotation of the inner bar roughly coincides with the location of the horizontal inner Lindblad resonance (ILR). At this position also the maximum of the elevation of the peanut structure occurs, because the vertical ILR is very close to the horizontal ILR and the conjunction of these two resonances build up the peanut structure (Combes et al. com90 (1990)). However, the observed ratio of the bar lengths of the primary to the secondary, which ends near corotation (Greusard et al. gre (2000)), varies between 4.0 and 13.4 (Friedli et al. fri96 (1996)), respectively 2.7 and 7.1 (Greusard et al. gre (2000)), while the ratio of bar length to length of the central bulge is much smaller and varies only between 2.4 and 3.1.
The central bulge could also be associated with a primordial bulge, which influences the bar structure and the position of the horizontal ILR. Since at this location also the peanut structures is most prominent, the extent of the b/p distortion would depend on the mass and length of the primordial bulge. Such a hypothesis is supported by N-body simulations in which the size of the evolving bar is directly related to the initial size of the bulge (Pfenniger pfe2000 (1999)). In this way the nearly constant ratio of bar length or BPL to CBU would be a natural result.
The correlation between CBU and BPL and especially the CBU/BPL ratio of 1 could also be explained by nuclear rings. They correspond to the horizontal ILR of bars (Buta & Crocker but (1993), Buta & Combes butcom (1996)) and therefore occur at the same radial position as the maximum of the elevation of the peanut structure. A nuclear ring could be responsible for the increase of the surface brightness, which we observe in radial cuts near the plane (Fig. 1, 2, 5), or the ring is only the border for the central bulge. However, we have not seen any structure inside the central bulge pointing to rings, but it is likely that our resolution is too low to detect them.
6.4 Bar thickness
Since we know now with high probability the fact that bars in peanut bulges are edge-on orientated, it is for the first time possible to determine the thickness of bars by observations. From the mean value of BAL/BAT for the galaxies with peanut bulges a ratio of bar length to thickness of (taking the error in BAL and BAT into account) is derived. This value is at the upper limit of the values estimated in the literature (ranging from 4 to 15, Sellwood & Wilkinson sel (1993)). It must be mentioned that bars are more extended in the NIR than in the optical (Friedli et al. fri96 (1996), Chapelon et al. cha (1999)). However, from a sample of nine barred galaxies (Wozniak et al. woz (1995), Friedli et al. fri96 (1996)) investigated in the - and -band we have computed that this effect is only of the order of 5%. Therefore our rather large value for the ratio is not an effect of the observed wavelengths.
7 Conclusion
We have analysed a sample of edge-on disk galaxies in the NIR and images derived from a N-body simulation of a barred galaxy using cuts parallel to the major axis and our classification of bulge shapes introduced in Paper I. Our main conclusions are:
-
•
Cuts along and parallel to the major axis of edge-on galaxies show a strong correlation between bars and b/p bulges. This correlation is for the first time verified in a larger sample of galaxies (N ).
-
•
The investigation of the bar signatures in the NIR reveals a correlation between prominent b/p bulges and strong bar signatures pointing to a dependence of the boxiness of a galaxy on the bar strength.
-
•
The ratio of the projected bar length (BAL) to the length of the bulge (BUL) correlates with the bulge types, i.e. with the bulge shape. This correlation is the first evidence from surface photometry for an explanation of the different degree of boxiness by the aspect angle of a bar. The maximum of this ratio for galaxies with peanut bulges is consistent with ratios observed in face-on galaxies.
-
•
The ratio of BAL to the length of the b/p distortion (BPL) has a mean value for the observed peanut bulges of . This value is consistent with the investigated N-body simulation where a ratio of can be derived for an edge-on galaxy with an edge-on bar.
-
•
The frequencies of bulge types in the simulated galaxy, seen under different aspect angles of a bar and under high inclinations, are consistent with the observed frequencies corrected for the total fraction of barred galaxies. These results support the interpretation that bars viewed under different angles in edge-on galaxies play a major role for the bulge shape. However, the viewing angle is not the only parameter, since the size of the pre-existing spheroidal bulge and various bar shapes and types also influence the bulge shape.
-
•
Interpreting galaxies with peanut bulges as galaxies with a bar seen edge-on the ratio of bar length to thickness, , can be directly measured for the first time.
-
•
From the observational point of view bars and b/p bulges are different components revealed by their different lengths. The inner part of barred disk galaxies can be described by three components: the spheroidal bulge (including the central bulge), the bar (=thin bar), and the b/p structure (=thick bar).
-
•
We have found a new size relation of the positions of the maxima of the b/p distortion with the extent of the central bulge (). This size relation is most likely related to the in-plane ILR of the bar.
Acknowledgements.
Part of this work was supported by the Deutsche Forschungsgemeinschaft, DFG. Furthermore the authors want to thank Daniel Pfenniger who provided the particle position file, Andreas Schröer for helping with IDL programming, and the referee F. Combes for constructive comments.References
- (1) Athanassoula E., Bureau M., 1999, ApJ 522, 699
- (2) Athanassoula E., Martinet L., 1980, A&A 87, L10
- (3) Baggett S.M., MacKenty J.W., 1996, Box/Peanut Galaxies in the Near-IR. In: Buta R., Crocker D.A., Elmegreen B.G (eds.), ASP Conference Series, Volume 91, p. 224
- (4) Barnes J.E., 1992, ApJ 331, 699
- (5) Baugh C.M., Cole S., Frenk C.S., 1996, MNRAS 283, 1361
- (6) Baumgart C.W., Peterson C.J., 1986, PASP 98, 56
- (7) Berentzen I., Heller C.H., Shlosman I., Fricke K.J., 1998, MNRAS 300, 49
- (8) Bettoni D., Galetta G., 1994, A&A 281, 1
- (9) Binney J., Petrou M., 1985, MNRAS 214, 449
- (10) Bureau M., 1998, Bars in Edge-On Spiral Galaxies, Ph.D. Thesis, The Australian National University
- (11) Bureau M., Athanassoula E., 1999, ApJ 522, 686
- (12) Bureau M., Freeman K.C., 1997, PASA 14, 146
- (13) Bureau M., Freeman K.C., 1999, AJ 118, 126
- (14) Buta R., Combes F., 1996, Fundamentals of Cosmic Physics, Volume 17, p. 95
- (15) Buta R., Crocker D.A., 1993, AJ 105, 1344
- (16) Chapelon S., Contini T., Davoust E., 1999, A&A 345, 81
- (17) Combes F., 2000, Bulge Formation. In: Hammer F., Thuan T.X., Cayatte V., Guiderdoni B., Tran Thanh Van J. (eds.), Building Galaxies: from the Primordial Universe to the Present, Proceedings of Rencontres de Moriond, Ed. Frontieres, p. 413
- (18) Combes F., Sanders R.H., 1981, A&A 96, 164
- (19) Combes F., Debbasch F., Friedli D., Pfenniger D., 1990, A&A 233, 82
- (20) de Carvalho R.R., da Costa N.L., 1987, A&A 171, 66
- (21) de Souza R.E., dos Anjos S., 1987, A&AS 70, 465
- (22) Dettmar R.-J., 1989, Box- and Peanut-Shaped Bulges of Disk Galaxies. In: Corwin H.G., Bottinelli L. (eds.), The World of Galaxies, Springer, p.229
- (23) Dettmar R.-J., Barteldrees A., 1990a, Substructure and asymmetries in bulges. In: Jarvis B.J., Terndrup D.M. (eds.), ESO/CTIO Workshop on Bulges of Galaxies, ESO, p. 255
- (24) Dettmar R.-J., Barteldrees A., 1990b, Observational evidence for a relation of box- and peanut-shaped bulges to bars. In: Jarvis B.J., Terndrup D.M. (eds.), ESO/CTIO Workshop on Bulges of Galaxies, ESO, p. 259
- (25) Dettmar R.-J., Ferrara A., 1996, NIR imaging of the box/peanut bulge in NGC 4302. In: Bender R., R.Davis R. (eds.), IAU Symp. 171, New Light on Galaxy Evolution, Kluwer, p. 362
- (26) Dettmar R.-J., Lütticke R., 1999, Do some bulges result from merging ? In: Gibson B.K., Axelrod T.S., Putman M.E. (eds.), ASP Conference Series, Volume 165, p. 95
- (27) de Vaucouleurs G., de Vaucouleurs A., Corwin Jr. H.G., Buta R.J., Fouqué P., 1991, Third Reference Catalogue of Bright Galaxies (RC3), Springer
- (28) D’Onofrio M., Capaccioli M., Merluzzi P., Zaggia S., Boulesteix J., 1999, A&AS 134, 437
- (29) Eggen O., Lynden-Bell D., Sandage A., 1962, ApJ 136, 748
- (30) Elias J.H., Frogel J.A., Matthews K., Neugebauer G., 1982, AJ 87, 1029
- (31) Elmegreen B.G., Elmegreen D.M., 1985, ApJ 288, 438
- (32) Elmegreen B.G., Elmegreen D.M., 1989, ApJ 342, 677
- (33) Elmegreen B.G., Elmegreen D.M., Chromey F.R., Hasselbacher D.A., Bissell B.A., 1996, AJ 111, 2233
- (34) Elmegreen D.M., Elmegreen B.G., 1995, ApJ 445, 591
- (35) Emsellem E., Arsenault R., 1997, A&A 318, 39
- (36) Eskridge P.B., Frogel J.A., Pogge R.W., Quillen A.C., Davies R. L., DePoy D.L., Houdashelt M.L., Kuchinski L.E., Ramirez S.V., Sellgren K., Terndrup D.M., Tiede G.P., 2000, AJ 119, 536
- (37) Fisher D., Illingworth G., Franx M., 1994, AJ 107, 160
- (38) Friedli D., Benz W., 1993, A&A 268, 65
- (39) Friedli D., Martinet L., 1993, A&A 277, 27
- (40) Friedli D., Wozniak H., Rieke M., Martinet L., Bratschi P., 1996, A&AS 118, 461
- (41) Friedli D., 1999, Birth, Aging, and Death of Bars. In: Beckman J.E., Mahoney T.J. (eds.), ASP Conference Series, Volume 187, p. 88
- (42) Garcia-Burillo S., Guelin M., 1995, A&A 299, 657
- (43) Garcia-Burillo S., Combes F., Neri R., 1999, A&A 343, 740
- (44) Gerin M., Combes F., Athanassoula E., 1990, A&A 230, 37
- (45) Greusard D., Friedli D., Wozniak H., Martinet L., martin P., 2000, A&A sub.
- (46) Hernquist L., 1993, ApJ 409, 548
- (47) Ho L.C., Filippenko A.V., Sargent W.L.W., 1997, ApJ 487, 591
- (48) Jarvis B.J., 1986, AJ 91, 65
- (49) Kauffmann G., White S.D.M., Guiderdoni B., 1993, MNRAS 264, 201
- (50) Kepner J.V., 1999, ApJ 520, 59
- (51) Knapen J.H., Hes R., Beckman J.E., Peletier R.F., 1991, A&A 241, 42
- (52) Knapen J.H., Shlosman I., Peletier R.F., 2000, ApJ 529, 93
- (53) Kuijken K., Merrifield M.R., 1995, ApJ 433, L13
- (54) Lütticke R., 1999, Box- and Peanut-Shaped Bulges, Ph.D. Thesis, Ruhr-Universität Bochum
- (55) Lütticke R., Dettmar R.-J., Pohlen M., 2000a, A&AS 145, 405 (Paper I)
- (56) Lütticke R., Dettmar R.-J., Pohlen M., 2000b, A&A in prep. (Paper III)
- (57) Martin P., 1995, AJ 109, 2428
- (58) Martinet L., Friedli D., 1997, A&A 323, 363
- (59) May A., van Albada T.S., Norman C.A., 1985, MNRAS 214, 131
- (60) Merrifield M., 1996, Buckling Bars and Boxy Bulges. In: Buta R., Crocker D.A., Elmegreen B.G. (eds.), ASP Conference Series, Volume 91, p. 179
- (61) Merrifield M., Kuijken K., 1999, A&A 345, L47
- (62) Mihos J.C., Walker I.R., Hernquist L., de Oliveira C.M., Bolte M., 1995, ApJ 447, L87
- (63) Miller B.W., Rubin V.C., 1995, AJ 110, 2692
- (64) Mulchaey J.S., Regan M.W., 1997, ApJ 482, L135
- (65) Noguchi M., 1987, MNRAS 228, 635
- (66) Persson S.E., Murphy D.C., Krzeminski W., Roth M., Rieke M.J., 1998, AJ 116, 2475
- (67) Pfenniger D., 1984, A&A 134, 373
- (68) Pfenniger D., 1999, Ap&SS 269/270, 149
- (69) Pfenniger D., Friedli D., 1991, A&A 252, 75
- (70) Pohlen M., Dettmar R.-J., Lütticke R., Schwarzkopf U., 2000, A&AS 144, 405
- (71) Quillen A.C., Kuchinski L.E., Frogel J.A., Depoy D.L., 1997, ApJ 481, 179
- (72) Raha N., Sellwood J.A., James R.A., Kahn F.D., 1991, Nature 352, 411
- (73) Reuter H.-P., Krause M., Wielebinski R., Lesch H., 1991, A&A 248, 12
- (74) Rieke G.H., Lebofsky, M.J., 1985, ApJ 288, 618
- (75) Rowley G., 1988, ApJ 331, 124
- (76) Seigar M.S., James P.A., 1998, MNRAS 299, 672
- (77) Sellwood J.A., Wilkinson A., 1993, Reports on Progress in Physics 56, 173
- (78) Shaw M.A., 1993, MNRAS 261, 718
- (79) Shaw M.A., Dettmar R.J., Barteldrees A., 1990, A&A 240, 36
- (80) van den Bosch F.C., 1998, ApJ 507, 601
- (81) Veilleux S., Bland-Hawthorn J., Cecil G., 1999, AJ 118, 210
- (82) Wakamatsu K., Hamabe M., 1984, ApJS 56, 283
- (83) Walker I.R., Mihos J.C., Hernquist L., 1996, ApJ 460, 121
- (84) Whitmore B.C., Bell M., 1988, ApJ 324, 741
- (85) Wozniak H., Friedli D., Martinet L., Martin P., Bratschi P., 1995, A&AS 111, 115
- (86) Wyse R.F.G., Gilmore G., Franx M., 1997, Annual Review of Astronomy and Astrophysics, Volume 35, 637