PHYSICAL DIAGNOSTICS FROM A NARROW EMISSION LINE DETECTED BY CHANDRA IN THE SEYFERT 1 GALAXY NGC 5548
Abstract
We report the detection of a narrow emission line in the Seyfert 1 galaxy NGC 5548 with the Chandra High-Energy Transmission Grating. In the galaxy frame we measure a center energy of keV, a FWHM of km/s, an intensity of , with an equivalent width of eV (errors are 90% confidence for one parameter). The line is only marginally resolved at the 90% confidence level. The line energy is consistent with an origin in cold, neutral matter, but ionization states up to are not ruled out. We cannot constrain the detailed dynamics but assuming Keplerian motion, the velocity width is consistent with the line being produced in the outer optical/UV broad-line region (BLR) at about a light-month from the central X-ray source. We cannot rule out some contribution to the narrow line from a putative, parsec-scale obscuring torus which is postulated to be a key component of AGN unification models. The continuum intensity during the Chandra observation was a factor less than typical historical levels. If the X-ray continuum was at least a factor of 2 higher in the recent past before the Chandra observation and the narrow intensity had not yet responded to such a change then the predicted line intensity and equivalent width for an origin in the BLR is within the 90% measurement errors. Anisotropic X-ray continuum illumination of the BLR and/or additional line emission from a torus structure would improve the agreement with observation. Two out of three archival ASCA data sets are consistent with the narrow line being present with the same intensity as in the Chandra observation. However, there is strong evidence that the narrow-line intensity varied and was unusually low during one of the ASCA campaigns. In general, inclusion of the narrow line to model the overall broad line profile in terms of a rotating disk plus black-hole model can have a non-negligible effect on the disk-line intensity and variability properties. Variability of the broad disk line in NGC 5548 is difficult to reconcile with the expectations of the simple disk model, even when the narrow-line component is accounted for. It will be important to ascertain the importance of a similar non-disk line in other Seyfert 1 galaxies. Future monitoring of the narrow component with large collecting area and high spectral resolution will enable reverberation mapping of the BLR region complementary to similar studies using the optical/UV lines and therefore provide independent constraints on the black-hole mass.
Accepted for Publication in the Astrophysical Journal (submitted July 5, 2000)
1 INTRODUCTION
The Advanced Satellite for Cosmology and Astrophysics (ASCA – Tanaka et al. 1994) found that the fluorescent emission line in Seyfert 1 galaxies is often very broad and is generally interpreted as the result of an origin in matter in an accretion disk rotating around a central black hole (see Fabian et al. 2000 and references therein). The line profile is sculpted by characteristic gravitational and Doppler energy shifts. Currently, study of the emission line is the only way to probe matter within a few to tens of gravitational radii of a black hole. There is an important caveat with respect to studying the relativistic line profiles with ASCA. The energy resolution of the CCD detectors is only (or FWHM eV, or km/s) in the band (6–7 keV). Thus, even for the highest signal-to-noise data, one could not unambiguously separate that part of the line which originates in the accretion disk, from any other component originating in matter beyond the accretion disk, further away (e.g. see Weaver and Reynolds 1998; Done, Madejski, and Zycki 2000). Such line components will be much narrower than the disk line, due to the lower Keplerian velocities and small gravitational shifts. Indeed, such a narrow emission line from the putative obscuring torus is thought to be the key for unifying type 1 and type 2 AGN, and is expected from Seyfert 1 galaxies (e.g. see Krolik, Madau, and Zycki 1994; Ghisellini, Haardt, and Matt 1994). The torus is extended on the parsec-scale and would lead to a FWHM for the narrow line from this region of km/s (assuming a virial relation and an r.m.s. velocity dispersion of ; see e.g. Netzer 1990). On the same scale, narrow-line emission may also originate in the extended warm scattering region which is also a feature of unified AGN models (e.g. see Krolik and Kallman 1987). A broader narrow-line contribution (1000s of km/s) might also be expected from the optical/UV broad-line region (BLR).
As we shall demonstrate in this paper, accurate measurements of the narrow line energy, width and intensity can provide a suite of powerful physical diagnostics of the central engine in AGN. Up to now, the expected narrow line has never been unambiguously detected in a Seyfert 1 due to limited instrumental energy resolution and sensitivity. However, strong evidence for its existence and physical parameters of the putative line have been deduced for several sources (e.g. Weaver et al. 1993; Yaqoob & Weaver 1996; Yaqoob et al. 1995,1996; Sulentic et al. 1998; Weaver & Reynolds 1998; Done et al. 2000). The narrow line appears to be most prominent in NELG such as NGC 2992 (Weaver et al. 1996), which may sometimes have an underlying broad component (e.g. MCG 5-23-16, Weaver et al. 1997). The above evidence for the narrow line in Seyfert 1 galaxies has been tempered by the case of MCG 63015 in which, during a flare, the entire broad line was highly redshifted, leaving no clear emission peak around 6.4 keV (Iwasawa et al. 1999). This has led to some debate about the existence of a narrow component.
In this paper we report the detection of a narrow line in the Seyfert 1 galaxy NGC 5548 from a Chandra observation. In §2 we present the data and describe the analysis procedures. In §3 we show that the line in NGC 5548 cannot be explained by emission from a relativistic disk alone and present the basic measurements of the narrow line parameters. In §4 we discuss all the different possible mechanisms contributing to the width of the narrow line and give our best estimate of its velocity width. We discuss the physical constraints imposed by the narrow line in §5, and in §6 we investigate the effect of the narrow line on the parameters derived for the relativistic broad line using archival ASCA data. In §7 we discuss some implications of the presence of a non-disk component on the interpretation of variability studies of the line and continuum. Finally, we present our conclusions in §8.
2 THE CHANDRA DATA
NGC 5548 was observed with Chandra starting on 2000 February 5, UT 15:38 for a total duration of 83 ks (continuous). The instrument used in the focal plane of the High Resolution Mirror Assembly (HRMA) was the High-Energy Transmission Grating (or HETG – Markert, et al. 1995). The HETG consists of two grating assemblies, a High-Energy Grating (HEG) and a Medium-Energy Grating (MEG). The HEG has a better efficiency than the MEG above keV. The spectral resolution of the HEG is roughly two times better than the MEG ( and for the HEG and MEG respectively). is roughly constant over the instrument bandpass (HEG: keV , MEG: keV). Events dispersed by the gratings are collected by a CCD array and can be assigned an energy based on the position along the dispersion axis. Since the CCDs have intrinsic energy resolution, background events can be rejected with a high efficiency, and different spectral orders can be easily discriminated.
Our Chandra observation of NGC 5548 yielded a net exposure time of 82,198.4 s. After accounting for a deadtime factor of 0.987337, the effective exposure time is 81157.6 s For our analysis we used data from events reprocessed using the latest software and calibration, as of 3 July 2000 111Details of the Chandra pipeline reprocessing and data analysis specifics can be found at http://asc.harvard.edu/ciao/threads/. Genuine photon events collected by the CCDs fall into specific pixel patterns classified by their grade and we retained only grades 0, 2, 3, 4, and 6; rejected grades correspond to non-X-ray events. We examined the radial profile of the zeroth-order image and found a single Gaussian to be a poor representation, due to the effects of pile-up broadening the profile (the best-fitting width was arcseconds). A double Gaussian model gave a good fit and the best-fitting widths of two Gaussian were and arcseconds, the ratio of the normalization of the narrow to broad Gaussian being 27.4. Since the zeroth order data suffer from pile-up we did not use these data for spectral analysis. For the grating data, in the cross-dispersion direction we found that the counts distribution as a function of cross-dispersion angle could be approximated by Gaussians with widths in the range 0.47–0.58 arcseconds for the four arms of first-order data ( orders for the HEG and MEG). We accumulated grating spectra from events along the dispersion direction, and within arcseconds of the peak in the cross-dispersion direction. In the first-order spectra we obtained total count rates (summed over the orders) of 0.19 cts/s and 0.43 cts/s for the HEG and MEG respectively. The count rates in the higher order spectra are at most 11.3% and 9.8% of the first order count rates for HEG and MEG respectively so in this paper we will restrict our analysis to the first order spectra only.
We do not expect further refinements to the CCD gain to affect the energy scale of the grating data since the energy assignment of events depends only on the position of the event on the CCD according to the dispersion relation. The CCD energy scale may, however affect the rejection of source events as background events and vice versa. Since we are most concerned with the band and this band will have the highest proportion of background in the data that is relevant for this paper, we checked how important background is for our data in the 5.5–7 keV band. We collapsed the 5.5–7 keV first-order HEG data in the dispersion direction and examined the count distribution as a function of cross-dispersion angle, which is again approximately Gaussian. We estimated the background level by fitting a model consisting of a Gaussian plus a constant and found that the background is of the total counts in the 5.5–7 keV band. The same procedure for the MEG showed that the background is of the total counts in the 5.5–7 keV band.
We made effective area files (ARF, or ancillary response file) using ciao v 1.1 (Chandra Interactive Analysis of Observations), which also takes account of the dithering of the satellite. We only used ciao for the reprocessing of the event data and to make the ancillary response files; the remaining data analysis (except for spectral fitting) was done using IDL routines written by ourselves. For the spectral fitting procedures described below, we used spectral response matrices acisheg1D1999-07-22rmfN0002.fits (HEG) and acismeg1D1999-07-22rmfN0002.fits (MEG). Note that absolute flux-calibration may be uncertain by as much as 30% at the time of writing (Marshall et al. 2000). However our principal results (i.e. center energy, width and equivalent width of the line) do not depend at all on the absolute flux calibration.
The spectral energy resolution is determined principally by the telescope response function but could be degraded by grating period variation (only at very low energies), incoherent dispersion ( of first order events), incorrect aspect solution, and defocussing. By examining the zeroth-order image from CCD frame-transfer events (which do not suffer pile-up), Paerels et al. (2000) determined from a HETG observation of Cyg X-3 that these effects do not compromise the spectral resolution within the measurement uncertainties. We also examined the frame-transfer events (or ‘streak data’) of our NGC 5548 data and found that the photon distribution in the dispersion direction could be approximated well with a single Gaussian, resulting in a best-fitting width of arcseconds (90% confidence errors), consistent with nominal expectations. This reassures us that there are no adverse effects on the spectral resolution of the gratings. The absolute calibration of the wavelength scale is typically (e.g. Paerels et al. 2000), much smaller than the statistical uncertainty in the emission line energy that we are concerned with in this paper.
3 DETECTION OF A NARROW LINE IN NGC 5548
We used XSPEC for spectral fitting the 2–7 keV HEG and MEG spectra (the signal-to-noise for both the HEG and MEG drops rapidly above keV). The and orders were summed for the HEG and MEG. The spectral bins had a width of which corresponds to the width of the spectral resolution of the HEG. For most of the 2–7 keV bandpass, in the HEG or MEG spectra, there were less than 10 counts per bin and at most 14 or 12 counts per bin (HEG and MEG respectively). Since the data are in the Poisson regime we performed the spectral fitting and error analysis using the C-statistic. Figure 1a shows the HEG and MEG spectra fitted with a simple power-law model, which describes well the overall spectra in the 2–7 keV band. The consistency between the HEG and MEG is good over most of this energy range, except that between keV the MEG shows systematic deviations of the order of . Figure 1a also shows that an emission line is clearly detected with high signal-to-noise in both the HEG and the MEG. The insets in Figure 1 show close-ups of the region for the HEG data, and also the region from an ASCA observation in July 1996. The ASCA line is broad, with no obvious signature of a narrow core (but note that the ASCA energy resolution in the Fe-K region is eV FWHM, a factor of worse than the HEG data in that band).
When we added a Gaussian to the power law continuum to model the emission line in the HEG plus MEG spectra, the C-statistic decreased by 25.6, which corresponds to a detection significance of nearly for three degrees of freedom. In this latter model, there were six free parameters in total; two independent normalizations for the continuum (one for the HEG and one for the MEG), the power-law photon index (), the line intensity, Gaussian width and center energy. The results of this spectral fit are shown in Table 1, along with the 90% confidence, one-parameter errors for the derived model parameters. Also shown in Table 1 for reference are the spectral fitting results obtained when the same model is applied to the HEG data only. These latter results are consistent with the joint fit so hereafter we will refer only to the parameters derived from the combined HEG and MEG fits. We obtain a photon index for the power law of and a 2–10 keV flux of . Historical 2–10 keV flux levels for NGC 5548 measured by EXOSAT, Ginga, and ASCA, according to the archival HEASARC databases and published results, span the range , with values in the upper third of this range being most common (e.g. see Turner & Pounds 1989; Nandra & Pounds 1994; Chiang et al. 2000). Thus it appears that the 2–10 keV flux during the Chandra observation was a factor of down from typical historical values.
Unless otherwise stated, we will refer all our measurements for X-ray line parameters to the galaxy frame, using a redshift of , obtained from the NASA/IPAC Extragalactic Database (NED). Note that the redshift of NGC 5548 is uncertain by the equivalent of , and the value refers to the value otained from optical emission-line measurements, whilst measurements give . See, for example, Mathur, Elvis, and Wilkes (1999) and references therein. Thus, our quoted galaxy-frame line-energy measurements carry additional uncertainties of the order of eV.
Table 1 shows that for the Gaussian fit we obtain a peak energy, intensity, and width of the narrow line detected by the HEG and MEG, of keV, , and km/s FWHM respectively. The equivalent width (EW) of the line is eV. Statistical errors are confidence for one parameter for all the above measurements. Yaqoob (1998) noted that, in the extreme Poisson limit, the -statistic can under-estimate the statistical errors on spectral features which are comparable to or narrower than the instrument resolution. Although our spectra are not in the extreme Poisson limit, we performed simulations (as described in Yaqoob, 1998) to check the reliability of the statistical errors derived from spectral fitting. Thus, we made a grid of simulated spectra in which the input line intensity was set at nine values in the range 1.5–6.0 and the input (Gaussian) line width was set at twelve values in the range 4–80 eV. The input line energy was set at 6.402 keV in the galaxy frame (the best-fit value from spectral fitting). Each grid point contained 1000 simulated spectra. All other model parameters (e.g. exposure time) were set at the values obtained from the Chandra data. The simulated spectra were fitted with the same power law plus Gaussian model and we found the statistical errors on the derived model parameters to be consistent with those obtained from spectral fitting. Our simulations also show that the HEG data contain a mean of only 70 photons in the line with a dispersion of photons. This is consistent with the mean number of line photons (72) we obtain from the product of the effective area at the observed line center energy, the exposure time and the best-fitting line intensity from Table 1. A similar calculation shows that the expectation value of the number of line photons detected by the MEG is 23.
We next addressed the question of whether the narrow line detected by Chandra is resolved. Note that the spectral resolution of the HEG at the observed line energy corresponds to eV FWHM, or km/s FWHM. Starting with the best-fitting power law plus Gaussian model to the HEG and MEG data we constructed confidence contours using the C-statistic for the line intensity versus the line width. Figure 2 shows the 68%, 90% and 99% joint confidence regions, from which it can be seen that the emission line is resolved at the 90% level but not at 99%.
3.1 RELATIVISTIC DISK LINE CONTRIBUTION
We note that the emission line detected by Chandra cannot be accounted for by a relativistic disk line alone. We fitted the HEG plus MEG data with a power-law continuum and a model of the broad line originating in an accretion disk rotating around a Schwarzschild black hole (e.g. Fabian et al. 1989). We fixed the disk power-law emissivity index at (close to the mean of a sample of Seyfert 1 galaxies – Nandra et al. 1997), and the energy of the line in the disk rest-frame at 6.4 keV. The inner and outer disk radii were fixed at and respectively, where , and is the radius of the last marginally stable orbit around a black hole of mass . The data are not very sensitive to the parameters that were fixed. The inclination angle () and the disk-line intensity were allowed to float. Including two independent continuum normalizations for the HEG and MEG, there are only a total of five free parameters, one less than the power law plus Gaussian line model. The best fit was much worse than the one in which the line was modeled only by a Gaussian (see Table 1); specifically the C-statistic was higher by 10.1 for the disk-line model, for one less degree of freedom. This means that the confidence level for the Gaussian model being a better description of the line is greater than 99.8%. The best-fitting disk inclination was degrees (90% confidence for one parameter), which is inconsistent with the best-constrained inclination derived from fitting ASCA data (see §6). Essentially, the narrow line detected by Chandra is too sharply peaked for even low-inclination disk-line models.
Next, we investigated the effect of including a broad, relativistic line in addition to the narrow Gaussian model. This time, in addition to the parameters which were fixed in the disk-line only fits, we also fixed the disk inclination angle at the best-constrained value from the ASCA data, of (see §6). All the Gaussian parameters were still free so there is only one additional degree of freedom in this composite, dual-line model. Spectral fitting the HEG and MEG data with this model reduces the C-statistic by only 0.1 relative to the power law plus Gaussian model. We note here that the Chandra data are insensitive to the disk inclination angle, with the C-statistic changing by less than 0.6 when the inclination angle is varied over the entire range of to . Since the relativistic line is so broad, its flux is spread out over a wide energy range and we found that it has a negligible effect on the derived parameters of the narrow line. In particular, the intensity of the narrow line decreased by and the width increased by when the disk line was included. The best-fitting intensity and equivalent width of the relativistic disk line was and eV respectively (errors are 90% confidence for three parameters). Thus, the broad component of the line is not detected due to the small effective area of the Chandra gratings but the statistical upper limits on its intensity are consistent with historical ASCA measurements (Chiang et al. 2000, and §6).
4 BROADENING MECHANISMS FOR THE NARROW LINE
The intrinsic width of the line, which results from a combination of the natural width and level width, is less than 1 eV (Bambynek 1972) so for our purpose it is negligible. The thermal width of the narrow line is km/s so this too is negligible. We can also neglect gravitational redshifts (these are of order for , where ) which will be less than 1 eV at a distance greater than four light days from a black hole with a mass of ). In §5 and Figure 3 we show that the narrow line originates at light month from the central X-ray source.
The line actually consists of two lines, K at 6.404 keV and K at 6.391 keV, with a branching ratio of 2:1. Therefore we investigated how this affects our results as follows. Using the 2–7 keV HEG and MEG data we fitted a model consisting of a power-law continuum plus two Gaussians, with the center energies fixed at the above energies, and the intensity of the Gaussian at higher energy was constrained to have twice the intensity of the other Gaussian. The widths of the two Gaussians were constrained to vary together. We obtained best-fitting values for the total line intensity (the sum of the two Gaussian intensities) and the width which were the same as those obtained from a single Gaussian model (Table 1), and also obtained similar statistical errors. In particular we obtained a width of the line of km/s FWHM (compare with the single-Gaussian measurement in Table 1).
If the narrow line is formed in Compton-thick material such as the putative obscuring torus, Compton down-scattering will also increase the apparent width of the line. However the Compton shoulder on the red side of the line peak due to the first scattering is already an order of magnitude down in intensity relative to the unscattered component (e.g. Matt, Brandt, and Fabian 1996; Iwasawa, Fabian, and Matt, 1997). The present data are not sensitive to this level of structure.
Another uncertainty arises from a possible contribution to the line from higher ionization states such as Fe II, which is expected if some of the line is coming from the putative obscuring torus. However, laboratory measurements of the energies of these higher ionization lines is uncertain and the HEG does not have sufficient energy resolution to place any tighter constraints other than the fact that the 90% confidence errors on the line center energy rule out a dominant contribution from ionization states higher than Fe XVIII (e.g. Makishima 1986). Thus, until better data are available we attribute the broadening of the narrow line in the Chandra data for NGC 5548 to the bulk velocity of the emitting gas but do not rule out some contribution from emission components with velocity widths less than our formal lower limits imply.
5 PHYSICAL DIAGNOSTICS FROM THE NARROW LINE
The narrow line discovered in NGC 5548 immediately enables some robust deductions to be made. We showed in §3.1 that line is too narrow to be the core of a relativistic disk line (e.g. see Fabian et al. 1989, 2000) in which the line-emissivity falls off with increasing distance from the continuum source. In the following sections we use the measurements of the peak energy, width, intensity and equivalent width of the narrow line to place physical constraints on the line-emission region.
5.1 PEAK ENERGY OF THE LINE
The peak energy of the line is keV, consistent with the rest-energy for cold, neutral iron. The upper limit on the energy corresponds to an ionization state of Fe XVIII and this is consistent with the ionization parameter for the optical/UV BLR deduced by Goad and Koratkar (1998) of from detailed modeling. As mentioned in §4, gravitational redshifts are not large enough to significantly shift back the line energy from ionized Fe to lower energies (the distance of the line-emitting region we deduce below produces energy shifts less than 1 eV). Therefore a dominant emission component from a warm scattering zone, consisting of He-like or H-like Fe, (a component of type 1 and type 2 AGN unification models, e.g. Krolik & Kallman, 1987) appears to be ruled out, at least in NGC 5548. Models in which the broad line is produced and broadened by Compton scattering in an optically thick medium (e.g. Misra and Kembhavi 1998; Mouchet et al. 2000) are likewise ruled out since the unscattered peak of the line would be at keV.
We can also rule out a scenario in which the narrow line is not seen directly but from reflection in optically thin cold gas out of the line-of-sight. Line photons of energy will be Compton down-scattered to a mean energy of . For keV this is eV lower than the peak energy we measure from the HEG data for NGC 5548. Of course if the scattering medium is hot, Fe XX could produce a line which is scattered back down to the observed energy. However, this requires a temperature of the order of 1 keV, and this would give rise to a Compton-broadened line with a FWHM eV, an order of magnitude larger than observed (see Pozdnyakopv, Sobol and Sunyaev, 1983). In fact, to obtain a line width consistent with the observed value, the gas electron temperature would have to be less than K.
5.2 LINE WIDTH
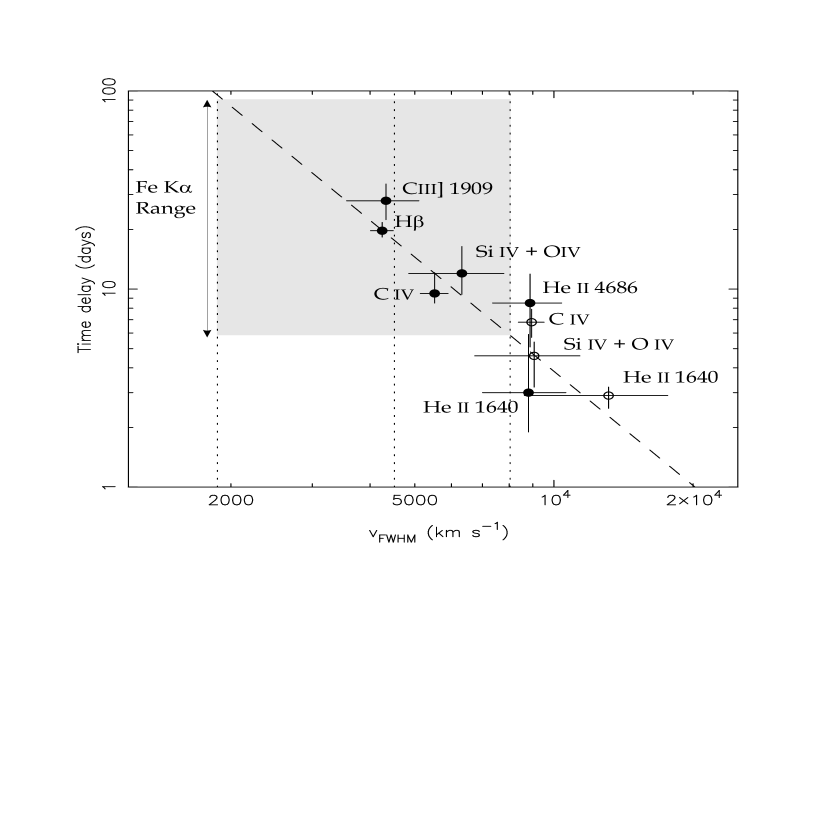
From a detailed study of the velocity widths and line/continuum time lags for optical/UV emission lines in NGC 5548, Peterson & Wandel (1999) found strong evidence for Keplerian motion of the line-emitting matter and estimated the central mass to be . As Peterson & Wandel (1999) caution, this mass estimate is subject to uncertainties in the geometry and kinematics of the BLR, and optical/UV line reprocessing physics. The actual mass may be as small as and as high as . A summary of estimates of the central mass in NGC 5548 using other methods can be found in Hayashida et al. (1998) and are consistent with this general range. In Figure 3 we plot the line width constraints (90% confidence range) that we measured from the Chandra data on a diagram of reverberation time-delays versus velocity widths of some of the BLR optical/UV emission lines measured by Peterson & Wandel (1999). Using their value of the central mass and our FWHM of we obtain a size of the line-emitting region of 23 light days ( confidence, one parameter limits: light days). This places the line-emitting region predominantly in the outer BLR and beyond (from Figure 3 the BLR extends from light days). Since we infer a low ionization state for the line-emitting region we would also expect from the same region. Indeed, Goad & Koratkar (1998) measure a FWHM of km/s for the broad core of . It is not clear why the innermost region of the BLR is apparently contributing little to the line. Perhaps the BLR covering factor increases radially and is significantly less in the inner BLR than it is in the outer BLR. The deduced location of the narrow line emission also implies that we might not expect the line intensity to respond to changes in the X-ray continuum intensity on timescales less than a week or so. Also, the energy resolution of the HEG does not allow us to rule out some additional contribution to the line from material further out, such as the putative obscuring torus.
Yaqoob et al. (1993) calculated the expected line profiles, equivalent widths, and transfer functions for an line formed in the BLR. For pure radial motion in a spherically symmetric cloud distribution (inflow or outflow), the line profile has almost vertical sides, nearly the same intensity on the red and blue sides for the narrow widths we are considering here. The full width of such a line profile corresponds to twice the maximum flow velocity. We fitted the HEG plus MEG data with a very simplistic rectangular model of the line profile and derive a flow velocity of km/s.
5.3 LINE INTENSITY AND EQUIVALENT WIDTH
We estimate the intensity and equivalent width of the line from the BLR following Krolik and Kallman (1987) but use updated Fe abundance and K-shell cross-section data. We assume a spherically symmetric cloud distribution and neutral iron for simplicity. The line intensity can be obtained by computing the number of photons removed from the continuum above the Fe-K edge threshold energy (at , or 7.11 keV for neutral Fe) and multiplying by the fluorescence yield ( for neutral Fe) and the fraction of the sky covered by BLR clouds (). If the observed power-law continuum is and is the K-shell photoelectric absorption cross-section as a function of energy, then the predicted observed intensity of the line is
| (1) |
where is the column density of each cloud, is the Fe abundance relative to Hydrogen, and is the fraction of emission-line photons appearing in the line (as opposed to Fe line), and we take (e.g. Bambynek 1972). Assuming the clouds are optically thin, we use a linear approximation for the exponential in equation 1. We fitted photoelectric absorption cross-section data from Henke tables222http://www-cxro.lbl.gov/optical_constants with a simple power-law and obtained
| (2) |
for . This is not as steep as the relation used in older work (e.g. Krolik and Kallman 1987; Yaqoob et al. 1993). Using an Fe abundance of (Anders and Grevesse 1989) the line intensity is then
| (3) | |||||
The equivalent width of the line is
| (4) | |||||
Here is the center energy of the line. All quantities in the above equations refer to the source frame. The above approximations are valid if the Fe-K absorption optical depth at all energies is much less than unity. Effectively this means (using the maximum optical depth, at ). Exact calculation using numerical integration showed that for , the approximations lead to underestimates of the line intensity and equivalent width of .
In a recent detailed study involving modeling the broad optical/UV emission lines in NGC 5548, Goad and Koratkar (1998) found that a covering factor of 35% and a column density of satisfy the observational constraints. These values, along with parameters measured for NGC 5548 from the Chandra data, namely , , give a predicted line intensity of and an EW of 36 eV. These both fall short of the observed values ( for the intensity and for the EW) by a significant factor. If the BLR is responsible for the production of the narrow line, the observed intensity and equivalent width could be reconciled with the predicted values if the continuum level was a factor of higher in the recent past before the Chandra observation such that the line had not responded to the decline in the continuum by the time of the Chandra observation. Historical values of the 2–10 keV flux range from (from HEASARC archives and Chiang et al. 2000 and references therein), so such a scenario is possible. There is of course the possibility that there is an additional contribution to the narrow line from the putative obscuring torus of a few tens of eV. A torus component of the line is not ruled out by our velocity-width measurements and would bring the observed and predicted strength of the line into better agreement with a more modest implied change in the continuum level. Another effect which would increase the predicted equivalent width of the line is anisotropic X-ray continuum illumination of the BLR (see Yaqoob et al. 1993 for details).
6 EFFECT OF THE NARROW LINE ON THE PARAMETERS OF THE RELATIVISTIC LINE
NGC 5548, like many other Seyfert 1 galaxies, is known to have a relativistically broadened line (Figure 1 (b); Mushotzky et al. 1995; Nandra et al. 1997). The broad line cannot be clearly seen in the Chandra grating data because of the small collecting area and in §4 we placed formal limits on the intensity of the broad component from the Chandra data. We now investigate the effect on the relativistic line parameters derived from the ASCA data when a narrow emission-line component is included. There have been three observing campaigns of NGC 5548 with ASCA in 1993, 1996 and 1998. The latter two consisted of multiple observations spaced over one to three weeks and we used the summed data in each campaign. We fitted the 3–10 keV spectra with a power law plus a model for the emission line originating in a disk rotating about a Schwarzschild black hole as described in §3.1. No additional narrow line was included at first. As in §3.1 we fixed the disk-line parameters to which the data are insensitive, namely the power-law emissivity index at , the inner and outer disk radii at and , respectively, and the energy of the line in the disk rest-frame at 6.4 keV. The inclination angle () and the disk-line intensity () were allowed to float. Acceptable fits were obtained for all three spectra and the results are shown in Table 2. It can be seen that is consistent with a single value (the weighted mean is ) but the EW during the July 1998 observation was almost a factor 2 less than that in the other two epochs, implying time delays between variation in the continuum and line intensity. Indeed the line intensity was less in this observation than in the previous two observations which both had a lower continuum flux.
Next, we added a narrow Gaussian to the model, with center energy and width fixed at the values derived from the HEG plus MEG measurements (Table 1). The intensities of both the broad and narrow components were allowed to float. The results are shown in Table 3. The disk inclination angle is consistent with the spectral fits which did not include a narrow line (Table 2) but it is poorly constrained in the 1993 and 1998 observations. The best constraint, from the 1996 observation is degrees. It can be seen from Table 3 that all the ASCA data for 1993 and 1998 are consistent with the existence of a narrow line with the same intensity measured by Chandra. However, for the 1996 observation, the 90% confidence, three-parameter errors on the narrow-line intensity do not formally overlap with the Chandra measurement. We conclude (with caution because of uncertainties in absolute calibration), that the narrow-line intensity is variable and was less during the 1996 ASCA observation than the values measured by Chandra and by ASCA in 1993 and 1998. This conclusion is supported by the fact that decreases by 8.1 and 76.9 (for an additional degree of freedom) when a narrow line is included in the 1993 and 1998 ASCA dual-line spectral fits but for the 1996 ASCA data (see Table 3).
7 IMPLICATIONS FOR VARIABILITY OF THE LINE IN SEYFERT 1 GALAXIES
The intensity of the disk line derived from the ASCA dual-line spectral fits (§6) appears to be variable, it naturally being less for larger values of the intensity of the best-fitting narrow-line component (Table 3). Although it appears that both the intensity and EW of the disk line may be variable amongst the three ASCA observations, the 90% confidence errors formally overlap so we cannot draw any firm conclusions. If the disk-line variability is real then the line intensity is not simply correlated with the observed continuum level because the 1998 observation, the one with the highest continuum flux, appears to have the smallest disk-line intensity. Time delays between the continuum and line variability are expected to be less than 10 hours for a black hole mass of (appropriate for NGC 5548; e.g. Peterson and Wandel, 1999) for line emission from within . Since the continuum does not vary significantly on this timescale during the observing periods this implies that the response time of the disk line may be longer than expected, implying more emission from larger radii than is assumed. Thus, the broad disk-line variability, if it is real, has difficulty being reconciled with the simple disk model. Chiang et al. (2000) actually found that the total Fe-K line intensity (as measured by RXTE) is anticorrelated with the X-ray continuum flux. Now we have shown that when one takes account of the narrow line the problem is worse, since Table 2 shows that even without a narrow line the disk line EW in July 1998 is already less than expected ( and any additional narrow line can only decrease the disk-line intensity).
Since the continuum level during the Chandra observation was at least a factor less than that during the ASCA observations we might expect the disk line to have a smaller intensity in the Chandra data. However, in §4 we showed that the Chandra data cannot constrain the broad-line component very well and obtained an upper limit of on its intensity, formally consistent with the values obtained from all the ASCA observations.
Recent campaigns to investigate the short-term variability of the line in Seyfert 1 galaxies and its relation to the continuum variability have been conducted for a handful of sources (NGC 7314, Yaqoob et al. 1996; MCG 6-30-15, Iwasawa et al. 1996, 1999, Reynolds 2000; NGC 3516, Nandra et al. 1999; NGC 4051, Wang et al. 1999; NGC 5548, Chiang et al. 2000; NGC 7469, Nandra et al. 2000). If one assumes that all or most of the line emission comes from the putative accretion disk then one expects the line intensity to track the continuum on timescales appropriate for the size and geometry of of the X-ray source and disk system. Evidence for this is found only in NGC 7314 and NGC 7469. The other sources show complex behavior which cannot be interpreted in terms of this simple model. Even in NGC 7314, only the broad wings of the line respond to the continuum, leaving a constant intensity core centered at 6.4 keV (Yaqoob et al. 1996). This implies that NGC 7314 also has a separate, non-disk narrow emission line component, just like NGC 5548. The NGC 7469 data were taken with RXTE so do not have the spectral resolution to identify a constant core component of the emission line. Moreover, no study has yet shown the expected correlation between the line intensity and the Compton-reflection continuum (which also comes from the accretion disk). This is such a fundamental prediction of the disk model for the line, yet when it has been tested either no correlation is found, or else an anti-correlation has been found (such behavior is actually found in NGC 5548; see Chiang et al. 2000 and §6). If a narrow, non-disk line component becomes important in general for low-flux states of Seyfert 1 galaxies, then variability studies need to take this into account. While discussions of a non-disk component to the lines have been around ever since their discovery in Seyfert 1 galaxies with early proportional counters in the late seventies, the Chandra observation of NGC 5548 now provides direct observational proof that this component exists, at least in one source.
8 CONCLUSIONS
Using the Chandra High-Energy Grating we detected a narrow emission line in the Seyfert 1 galaxy NGC 5548, with a center energy of keV, a FWHM of km/s and an equivalent width (EW) of eV (90% confidence errors, three parameters of interest; all quantities are in the galaxy frame). The line is only marginally resolved. This emission line is distinct from the broad line in NGC 5548 and other Seyfert 1 galaxies, thought to originate in a disk rotating around a central black hole. The Chandra data are inconsistent with the line originating only from a disk because it is too sharply peaked even for low-inclination disks. The narrow line center energy, velocity width and equivalent width measurements are consistent with the bulk of the line originating in cold, neutral matter in the outer BLR at about a light-week to a few light-months from the central source. We also do not, however, rule out ionization states up to about Fe XVIII.
The agreement of the line equivalent width and intensity with predicted values assumes a spherically symmetric distribution of BLR clouds with a covering factor of 35% and typical cloud column densities of (values consistent with optical/UV emission-line studies) and is conditional upon the X-ray continuum having been a factor higher in the immediate past prior to the Chandra observation. The 2–10 keV flux during the Chandra observation was a factor of 2.5 below typical historical values so this is not unreasonable. The continuum variability constraint would be relieved somewhat if there were a contribution to the narrow line from a putative, parsec-scale obscuring torus, which has been postulated as a key component of unification schemes of Seyfert 1 and Seyfert 2 galaxies. Indeed, such a contribution is not ruled out by the data. Anisotropic X-ray illumination of a spherical BLR would also increase the expected equivalent width of the narrow line. Considering its deduced location, the narrow line iteself may vary on timescales of weeks to months. Indeed, examination of archival ASCA data provides evidence for variability of the narrow line.
We do not yet know whether the narrow emission line is a common feature of Seyfert 1 galaxies. From a moderate sample of sources, Nandra et al. (1997) placed an upper limit on a narrow component in the overall line profile typically of eV, but some sources show stronger evidence for a separate, narrow line (e.g. Yaqoob & Weaver 1996; Weaver and Reynolds 1998; Done et al. 2000). In the case of NGC 5548 one of the likely reasons for the relatively large EW of the narrow component observed by Chandra is that the continuum intensity happened to be significantly lower during the Chandra observation compared to the upper range of historical values. It will be important to obtain Chandra data for a large sample of Seyfert 1 galaxies. However, studying the variability of the narrow line is rather expensive with Chandra . Monitoring the narrow line and using it for reverberation mapping with future X-ray astronomy missions with larger effective area will allow us to independently measure the central black-hole mass, complementing reverberation studies using optical/UV emission lines. Combining these future variability studies with spectral analysis with an energy of resolution of the order of 1 eV will allow us to constrain the details of the geometry and dynamics of the gas which are not accessible by current observations.
We thank Dr. Kimberly Weaver and Professor Julian Krolik for valuable discussions relating to this work. We also thank Drs. H. Marshall and F. Nicastro for their helpful advice on Chandra data analysis issues. We are grateful to an anonymous referee for reviewing the manuscript and making some important suggestions. This research made use of HEASARC online databases.
| Parameter | HEG only | HEG and MEG |
|---|---|---|
| Center Energy (keV) | ||
| Gaussian width (eV) | ||
| Intensity () | ||
| Equivalent Width (EW) | ||
| Velocity FWHM (km/s) | ||
| Photon Index () | ||
| C-statistic | 842.7 | 1332.8 |
| degrees of freedom | 1765 | 2648 |
| 2–10 keV flux () | 2.5 | 2.4 |
Note. — All line parameter values are referred to the rest frame of NGC 5548 (). Statistical errors are 90% confidence for one interesting parameter (). The 2–10 keV flux for the HEG plus MEG fit is the average from the two gratings.
| Parameter | July 1993 | July 1996 | July 1998 |
|---|---|---|---|
| Exposure (ks) | 29.6 | 56.9 | 130.0 |
| Disk inclination/ (degrees) | |||
| Disk-line intensity () | |||
| Disk-line EW (eV) | |||
| 2–10 keV flux () | 5.1 | 5.4 | 6.5 |
| 1016.3 | 1199.8 | 1483.9 | |
| degrees of freedom | 1004 | 1195 | 1466 |
Note. — 3–10 keV spectra fits using ASCA data (both SIS and GIS) for three observations of NGC 5548. The model consists of a power law plus an emission line (rest energy 6.4 keV) from a relativistic disk rotating around a Schwarzschild black hole. The inner and outer disk radii are fixed at 6 and 1000 gravitational radii respectively. The line emissivity is a power law with index fixed at . All the line parameters shown refer to the galaxy frame. All statistical errors on parameters are 90% confidence for three interesting parameters ().
| Parameter | July 1993 | July 1996 | July 1998 |
|---|---|---|---|
| Disk inclination/ (degrees) | |||
| Disk-line Intensity () | |||
| Disk-line EW (eV) | |||
| Narrow-Line Intensity () | |||
| Narrow-Line (eV) | |||
| 1008.2 | 1199.8 | 1407.7 | |
| degrees of freedom | 1003 | 1194 | 1428 |
Note. — Spectral fits to ASCA data for NGC 5548 using a composite model for the line, consisting of a relativistic disk line plus a narrow Gaussian. The Gaussian width of the narrow line is fixed at the best-fitting value obtained from the HEG plus MEG Chandra spectral fits ( eV, Table 1). All line parameters shown refer to the galaxy frame. All statistical errors are 90% confidence for three interesting parameters ().
References
- (1)
- (2) Anders, E., & Grevesse, N. 1989, Geochimica et Cosmochimica Acta 53, 197
- (3)
- (4) Bambynek, W., Crasemann, B., Fink, R. W., Freund, H.-U., Mark., H., Swift, C. D., Price, R. E., Rao, P. V. 1972, Rev. Mod. Phys., 44, 716
- (5)
- (6) Chiang, J., Reynolds, C. S., Blaes, O. M., Nowak, M. A., Murray, G., Madejski, G., Marshall, H. L., & Magdziarz, P. 2000, ApJ, 528, 292.
- (7)
- (8) Done, C., Madejski, G., & Zycki, P. T. 2000, ApJ, 536, 213
- (9)
- (10) Fabian, A. C., Iwasawa, K., Reynolds, C. S., & Young, A. J. 2000, (astro-ph/0004366)
- (11)
- (12) Fabian, A. C., Rees, M. J., Stella, L., & White, N. E. 1989, MNRAS, 238, 729
- (13)
- (14) Ghisellini, G., Haardt, F., & Matt, G. 1994, MNRAS, 267, 743
- (15)
- (16) Goad, M., & Koratkar, A. 1998, ApJ, 495, 718
- (17)
- (18) Hayashida, K., Miyamoto, S., Kitamoto, S., Negoro, H., & Inoue, H. 1998, ApJ, 500, 642
- (19)
- (20) Iwasawa, K., et al. 1996, MNRAS, 282, 1038
- (21)
- (22) Iwasawa, K., Fabian, A. C., and Matt, G. 1997, MNRAS, 289, 443
- (23)
- (24) Iwasawa, K., Fabian, A. C., Young, A. J., Inoue, H., & Matsumoto, C. 1999, MNRAS, 306, L19
- (25)
- (26) Krolik, J. H., & Kallman, T. 1987, ApJ, 320, L5
- (27)
- (28) Krolik, J. H., Madau, P., & Zycki, P. T. 1994, ApJ, 420, L57
- (29)
- (30) Makishima, K. 1986, in proc. The Physics of Accretion onto Compact Objects, eds. Mason, K. O., Watson, M. G., White, N. E., Springer-Verlag, p. 249
- (31)
- (32) Markert, T. H., Canizares, C. R., Dewey, D., McGuirk, M., Pak, C., & Shattenburg, M. L. 1995, Proc. SPIE, 2280, 168
- (33)
- (34) Marshall, L., H., Dewey, D., Canizares, C., & Schulz, N. S. 2000, in preparation
- (35)
- (36) Mathur, S., Elvis, M., & Wilkes, B. E. 1999, ApJ, 519, 605
- (37)
- (38) Matt, G., Brandt, W. N., & Fabian, A. C. 1996, MNRAS, 280, 823
- (39)
- (40) Misra, R., & Kembhavi, A. K. 1998, ApJ, 499, 205
- (41)
- (42) Mouchet, M., Abrassart, A., Porquet, D., Dumont, A.-M., & Collin, S. 2000, (astro-ph/0003168)
- (43)
- (44) Mushotzky, R. F., Fabian, A. C., Iwasawa, K., Kunieda, H., Matsuoka, M., Nandra, K., & Tanaka, Y. 1995, MNRAS, 272, L9
- (45)
- (46) Nandra, K., George, I.M., Mushotzky, R.F., Turner, T.J., & Yaqoob, T. 1997, ApJ, 477, 602
- (47)
- (48) Nandra, K., George, I.M., Mushotzky, R.F., Turner, T.J., & Yaqoob, T. 1999, ApJ, 523, L17
- (49)
- (50) Nandra, K., Le, T., Edelson, R., George, I. M., Mushotzky, R. F., Peterson, B. M., & Turner, T. J. 2000, ApJ, in press, (astro-ph/0006339)
- (51)
- (52) Nandra, K., & Pounds, K. A. 1994, MNRAS, 268, 405
- (53)
- (54) Netzer, H. 1990, in Active Galactic Nuclei, ed. R. D. Blandford, H. Netzer, & L. Woltjer (Berlin: Springer), 137
- (55)
- (56) Paerels, F., Cottam, J., Sako, M., Liedhal, D., Brinkman, A. C., van der Meer, R. L. J., Kaastra, J. S., & Predhel, P., ApJ, 533, L135
- (57)
- (58) Peterson, B., & Wandel, A. 1999, ApJ, 521, L95
- (59)
- (60) Pozdnyakopv, L. A., Sobol, M., & Sunyaev, R. A. 1983, in Soviet Scientific Reviews, Astrophysics and Space Physics, ed. R. A. Sunyaev (New York: Harwood Academic Publishers), Vol. II, 189
- (61)
- (62) Reynolds, C. S. 2000, ApJ, 533, 811
- (63)
- (64) Sulentic, J. W., Marziani, P., Zwitter, T., Calvani, M., & Dultzin-Hacyan, D. 1998, ApJ, 501, 54
- (65)
- (66) Tanaka, Y, Inoue, H., & Holt, S.S. 1994, PASJ, 46, L37
- (67)
- (68) Turner, T. J., & Pounds, K. A. 1989, MNRAS, 240, 833
- (69)
- (70) Wang, J. X., Zhou, Y. Y., Xu, H. G., & Wang, T. G. 1999, ApJ, 516, L65
- (71)
- (72) Weaver, K. A., et al. 1993, ApJ, 423, 621
- (73)
- (74) Weaver, K. A., Nousek., J., Yaqoob, T., Mushotzky, R. F., Makino, F., & Otani, C. 1996, ApJ, 458, 160
- (75)
- (76) Weaver, K. A., & Reynolds, C. S. 1998, ApJ, 503, L39
- (77)
- (78) Weaver, K. A., Yaqoob, T., Mushotzky, R. F., Nousek, J., Hayashi, I., & Koyama, K., 1997, ApJ, 474, 675.
- (79)
- (80) Yaqoob, T. 1998, ApJ, 500, 893
- (81)
- (82) Yaqoob, T., Edelson, R., Weaver, K. A., Warwick, R. S., Mushotzky, R. F., Serlemitsos, P. J., & Holt, S. S. 1995, ApJ, 453, L81
- (83)
- (84) Yaqoob, T., McKernan, B., Done, C., Serlemitsos, P. J., & Weaver, K. A. 1993, ApJ, 416, L5
- (85)
- (86) Yaqoob, T., Serlemitsos, P. J., Turner, T. J., George, I. M., & Nandra, K. 1996, ApJ, 470, L27
- (87)
- (88) Yaqoob, T., & Weaver, K. A., 1996, in proc. “X-ray Imaging and Spectroscopy of Cosmic Hot Plasmas”, Universal Academy Press, Tokyo, Japan, eds. Makino, F. & Mitsuda, K., p. 217
- (89)
Figure Captions
Figure 1
(a) Chandra HETG spectra for NGC 5548 from the HEG (solid error
bars) and
MEG (crosses for data points with dotted error bars).
Solid line is the best-fitting power-law
continuum to HEG plus MEG data but with the best-fitting HEG
normalization. The
orders are summed.
The narrow emission-line component is clearly detected in both the HEG and MEG.
(b) ASCA SIS0+SIS1 relativistic line profile
for the July 1996 observation of
NGC 5548 (see text). (c)
Close-up of the HEG spectrum; the data
are smoothed with a boxcar five bins wide, where the binsize is
.
The solid line is the best-fitting model which
consists of a power-law continuum and a narrow Gaussian.
All
parameters have the best-fitting values derived from
fitting the HEG data (Table 1).
Energy scale in all three panels
is for the observer’s frame.
Figure 2
Joint two-parameter
confidence region of the narrow line intensity versus
Gaussian width from spectral fitting to the HEG and MEG Chandra data. The contours correspond to
68%, 90% and 99% confidence.
Figure 3
Measurements by Peterson and Wandel (1999) of the time lags (relative
to the appropriate continuum ) and
the FWHM of various optical/UV emission lines in NGC 5548. The dashed
line corresponds to the best Keplerian model fit
obtained by Wandel and Peterson (1999) for the data from which they
obtain a central mass of .
The dotted lines show the best-fitting
parameters and 90% confidence (one-parameter) limits on the
FWHM of the narrow emission line
measured from our Chandra HEG plus MEG data (see Table 1).