Mapping the peculiar binary GP Com 11institutetext: University of Southampton, Southampton SO17 1BJ, UK
Mapping the peculiar binary GP Com
Abstract
We present high resolution spectra of the AM CVn helium binary GP Com at two different wavelength ranges. The spectra show the same flaring behaviour observed in previous UV and optical data. We find that the central spike contributes to the flare spectra indicating that its origin is probably the compact object. We also detect that the central spike moves with orbital phase following an S-wave pattern. The radial velocity semiamplitude of the S-wave is 10 km s-1 which indicates its origin is near the centre of mass of the system, which in this case lies very close to the white dwarf. The Stark effect seems to affect significantly the central spike of some of the lines suggesting that it forms in a high electron density region. This again favours the idea that the central spike originates in the white dwarf. We present Doppler maps obtained for the emission lines which show three clear emission regions.
1 Helium rich binaries
GP Com belongs to a group of binaries called AM CVn systems. In these binaries, a white dwarf accretes material from the stripped-down core of a giant star. Only 6 known systems belong to this group although they are predicted to have a space density about a factor of 2 higher than that of cataclysmic variables (CVs) of which some 700 are known ty96 . They show properties similar to those of CVs but with some peculiarities, for instance ultra short orbital periods – between 15 and 46 min – which indicate that the two stars are very close together, and a complete lack of hydrogen in their spectra. Some of the systems show strong flickering indicating the presence of mass transfer. AM CVn and EC 15330 show only absorption lines. These lines have large breadths indicating either rapid rotation or pressure broadening by compact stars. CR Boo, CP Eri and V803 Cen show absorption lines when they are bright and emission lines when faint. This absorption/emission line behaviour has been compared to that of CVs, as most of them show emission lines when in quiescence and absorption lines when in outburst. GP Com only shows emission lines and therefore could be considered as always being in quiescence. For a summary of the properties of AM CVn systems see w95 .
2 GP Com’s spectra
We took spectra of GP Com in two wavelength ranges, 6600 – 7408Å and 4253 – 5058Å with the 4.2 m William Herschel telescope during two consecutive nights. For details on the observations and their reduction see mmwn00 .
The average spectrum of GP Com consists of strong emission lines, mainly He i, on a low continuum, see the top panels of Figs. 1 and 2. The spectra look very similar to previously published spectra nrs81 ; m99 but the intensity of the central spike is stronger indicating that GP Com shows long term variability. The emission lines consist of a double-peaked profile superposed with a narrow line component that moves between the red and blue peaks with orbital phase, and a central narrow spike near the rest wavelength. The central spike seems to be independent of the double peaks, which are associated with an accretion disc around the compact object s75 . The narrow line component probably has its origin in the region of impact between the accretion stream and the accretion disc, i.e. the bright spot nrs81 . The origin of the central spike has been a puzzle for a long time. It was suggested that it came from a surrounding nebula nrs81 but subsequent searches were unsuccessful s83 . The central spike seems to participate in the flaring activity shown by GP Com which would suggest that it is associated to the compact object m99 . We present results that encourage us to suggest that its origin is the compact object in the binary and not a surrounding nebula.
2.1 Flares


GP Com shows strong flaring activity in UV mwhl95 and optical m99 wavelengths probably driven by X-ray variability. By using the method described in m99 we obtain the characteristic flare spectra of GP Com for both wavelength ranges, see bottom panels of Figs. 1 and 2. The first thing we notice is that the central spike is not present in the flare spectra for most emission lines but it is strong for He ii 4686 Å and present, although weak, for He i 4713 Å. We are certain that the central spike contributes to the flare spectrum of GP Com and therefore suggest that it must have its origin somewhere in the binary and not in a nebula around it. Another important feature of the flare spectra is that lines are slightly broader than in the mean spectra, indicating that they are formed mainly in the regions of the disc that rotate faster, i.e the inner regions, whereas the lines that contribute to the mean spectrum are formed in lower velocity regions.
2.2 Central spike
When we plot all the spectra together versus orbital phase we notice that the central spike behaves like an S-wave with a radial velocity semiamplitude of about 10 km s-1. This S-wave completes a whole cycle in an orbit indicating that its origin is somewhere in the binary and not in a nebula around it (as that would produce a stationary peak). We carried out multi-gaussian fittings to the profiles of the lines and fitted the velocities associated with the gaussian corresponding to the central spike by the function. The parameters of the fit are shown in table 1. We could not fit He i 4388 Å and He i 4922 Å accurately as the central spike is double peaked. The radial velocity semiamplitudes measured range between 6–12 km s-1 similar to the 10 km s-1 semiamplitude measured by nrs81 and m99 . The systemic velocity is 40 km s-1 for most lines apart from He ii 4686 Å with 20 km s-1 and He i 5015 Å with 8 km s-1.
A systemic velocity of the order of 35 km s-1 could be the result of gravitational redshift of light emitted by a 0.6 M white dwarf. However, to produce a redshift of only 8 km s-1, the He i 5015 Å line should form at a radius 4 times larger than that of the white dwarf, which seems highly unlikely.
| Line | |||
|---|---|---|---|
| km s-1 | km s-1 | km s-1 | |
| He i 4388 Å | – | – | – |
| He i 4471 Å | 49.02 0.18 | 6.24 0.27 | 0.39 0.06 |
| He ii 4686 Å | 20.42 0.27 | 10.46 0.40 | 0.91 0.09 |
| He i 4713 Å | 38.25 0.29 | 11.46 0.43 | 1.84 0.13 |
| He i 4922 Å | – | – | – |
| He i 5015 Å | 7.64 0.33 | 8.55 0.47 | 0.89 0.12 |
| He i 6678 Å | 42.98 0.23 | 10.33 0.35 | -0.67 0.07 |
| He i 7065 Å | 46.20 0.24 | 6.56 0.35 | -1.10 0.11 |
| He i 7281 Å | 42.59 0.43 | 10.70 0.63 | -0.35 0.11 |
3 Doppler maps
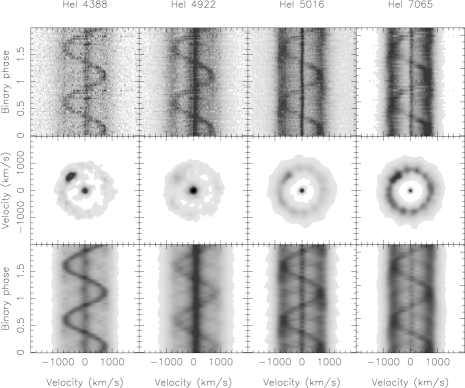
We modified the orbital ephemeris given by m99 so the modulation of the central spike corresponded to the motion of the white dwarf in the binary. Using the maximum entropy technique we obtained Doppler maps for the emission lines and show them, for 4 of the lines, in Fig. 3. For maps of all the lines see mmwn00 . The top panels present the spectra binned in orbital phase and plotted twice. The central spike is the strongest feature in almost all the lines. In some cases it appears to be double-peaked (He i 4388 Å and He i 4922 Å) which we suggest is the result of Stark broadening. The Stark effect does not affect helium lines in the same way as hydrogen lines. In hydrogen the effect is symmetrical whereas in helium it results in some forbidden transitions being allowed. What we believe we are seeing is two of those forbidden transitions which happen to lie very close to He i 4388 Å and 4922 Å, see bw98 ; bwb95 ; bwb97 for details. This indicates that the central spike must form in a high electron density region, which favours the white dwarf as its origin.
Also clear in the trails are the two peaks equidistant from the rest wavelength that correspond to the accretion disc, and a sinusoidal component that moves between the two peaks. The middle panels are the Doppler tomograms obtained using MEMSYS techniques mh88 . The emission in the centre of the map, therefore at low velocities, corresponds to the central spike. The red and blue peaks of the lines map into a ring around the centre of mass that corresponds to the accretion disc. The sinusoidal component maps into an emission region on the top left quadrant of the map. This is the position in the map where we expect to find any emission coming from the bright spot. We observe that the bright spot shows a complex structure, stretched along the accretion disc, for some lines. This behaviour had been observed previously m99 . When Marsh m99 measured the radial velocity of the spot at different orbital phases, he realised that it moved in a semi-sinusoidal fashion, the values of the velocity always being between the radial velocities of the stream and the disc at the bright spot position. The bottom panels of Fig. 3 present the trails of the spectra computed back from the Doppler maps. The agreement between the real and computed data assures us that the structures seen in the maps are real and not artifacts.
One last thing to notice in the He i 5015 Å and He i 7065 Å maps is that the disc appears to be slightly elliptical. The reason for this is not clear to us.
4 A few puzzles still
Although we can explain some of the behaviour observed in GP Com, there are still several peculiarities we do not fully understand. Why is the central spike redshifted by different amounts for different lines? We notice in some of the maps that the accretion disc seems elliptical: is that real? And if so, why? Why do only the inner regions of the disc contribute to the flaring? What is causing the flaring? What is causing the long term variability observed on this source? What does the fact that Stark broadening affects the lines so much indicate?
References
- (1) A. Beauchamp, F. Wesemael: ApJ 496, 395 (1998)
- (2) A. Beauchamp, F. Wesemael, P. Bergeron: ApJ 441, L85 (1995)
- (3) A. Beauchamp, F. Wesemael, P. Bergeron: ApJSS 108, 559 (1997)
- (4) T. R. Marsh: MNRAS 304, 443 (1999)
- (5) T. R. Marsh, K. Horne: MNRAS 235, 269 (1988)
- (6) T. R. Marsh, K. Horne, S. Rosen: MNRAS 366, 535 (1991)
- (7) T. R. Marsh, J. H. Wood, K. Horne, D. Lambert: MNRAS 274, 452 (1995)
- (8) L. Morales-Rueda, T. R. Marsh, R. C. North, J. H. Wood: MNRAS, in preparation
- (9) R. Nather, E. Robinson, R. Stover: ApJ 244, 269 (1981)
- (10) K. Osawa: ApJ 130, 159 (1959)
- (11) J. Smak: Acta Astr. 25, 227 (1975)
- (12) R. Stover: PASP 95, 18 (1983)
- (13) M. Tsugawa, Y. Osaki: PASJ 49, 75 (1997)
- (14) A. Tutukov, L. Yungelson: MNRAS 280, 1035 (1996)
- (15) B. Warner: Cataclysmic Variable Stars (Cambridge University Press, Cambridge 1995)