The Impact of Adaptive Optics on Star Formation Research
Abstract
In this paper, we discuss the benefits of ground-based, adaptive optics (AO) aided observations for star formation research. After outlining the general advantages, we present results obtained during the ALFA science demonstration programme in 1999. These results underline the absolute necessity of AO assistance for almost any kind of observations regarding star formation regions.
Keywords: Adaptive Optics, Star Formation, Initial Mass Functions, Ultracompact Hii Regions, T Tauri Stars
1 INTRODUCTION
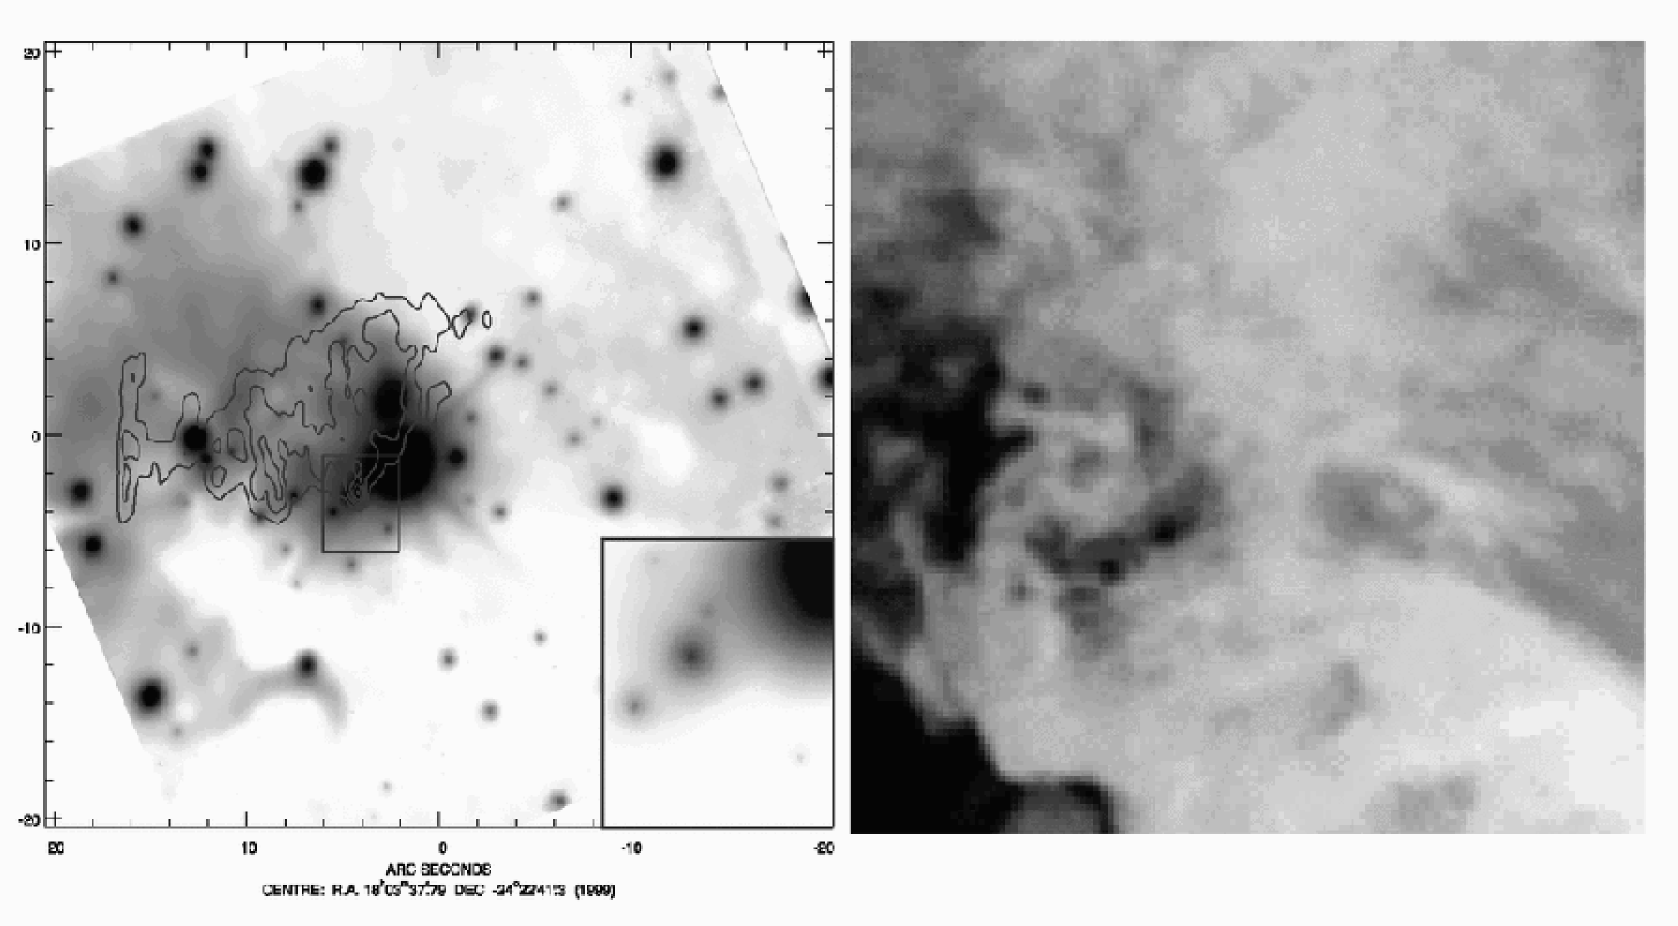
Since about 1995, when adaptive optics (AO) was broadly introduced into astronomical imaging techniques, the field of star formation has seen revolutionary progress. Why is that? The first step towards the new age had nothing to do with AO, it was the first direct imaging of circumstellar disks provided by the HST (see, e.g McCaughrean et al.[1]). Before the installation of the NICMOS instrument, however, HST had the disadvantage of being restricted to visual wavelengths. Star formation, on the other hand, usually takes place in molecular clouds. The radiation which carries information to astronomers on earth must pass through these clouds. The dust particles inside the clouds absorb most of the visual radiation, but let the infrared (IR) part and longer wavelengths pass almost untouched. Additionally, dusty structures in the immediate environment of young stellar objects (YSOs) provide IR excess emission by absorbing shorter wavelengths and re-radiating the energy in the IR. While this effectively shuts off observations of the act of star formation in the visual (and thus by the old HST), it matches excellently with the facilities provided by AO systems. Current astronomical AO systems111At least those available to the general, civilian community, as well as the very first ones 5 years ago, usually use the visible part of the electromagnetic spectrum to analyse the incoming wavefront, and provide the IR part to the science instrument. This has several reasons: First of all, it is much easier to achieve plain wavefronts at longer wavelengths: The longer the wavelength, the smaller the number of required actuators and the longer the atmospheric coherence timescale. On the other hand, using a dichroic beam splitter is more efficient than a “normal” beam splitter. AO systems with IR wavefront sensors (ADONIS at ESO now has one) or systems providing AO in the visible (like e.g. the starfire optical range), have to share photons between the wavefront analyser and the science instrument. This always imposes a further limitation on the limiting magnitudes of these systems. All these factors make AO systems ideal for observing star formation regions, apart from the fact that on large telescopes they can easily beat the resolution provided by HST. An example comparison of a typical star forming region is given in Figure 1.
 |
Despite the HST delivering the first direct images of circumstellar disks, the detailed examination of such objects was performed later with AO systems[3]. AO supported IR observations yielded information on the grain size distribution and the temperature variations inside such disks. Polarimetric studies of such disks have also been conducted[4]. AO observations have also contributed to other fields of star formation research, like the search for brown dwarfs[5] (Important to fill the gap between theories of star and planet formation), the identification of initial mass functions in young clusters, the phenomena of massive star formation[6] and problems connected with binarity or multiplicity of recently formed stellar systems.
In this paper, we will presented selected results obtained by a single AO system, ALFA (Adaptive Optics with a Laser for Astronomy[7], which is run by the two Max Planck Institutes for Astronomy and extraterrestrial physics in Heidelberg and Garching, Germany. We concentrate on fields of star formation research which are examined at the two institutes. The results we present were obtained during the ALFA science demonstration run 1999, most of them in September of that year. The intention is to give a short introduction to the fields we are working in and to present current results obtained with the ALFA system. All data presented are still under analysis and will be thoroughly presented in forthcoming papers. To provide opportunities to judge the “real life” performance of the AO system, all characteristic data (like Strehl ratios, FWHMs etc.) are given for the finally reduced data, but without any applied post-reduction techniques like deconvolution or PSF-fitting.
2 Determining the IMF of NGC 6611
The initial mass functions (IMFs) of young clusters contain a wealth of hints towards the influence of the environment on the formation mechanisms of stars. Particularly interesting is the interaction between massive stars and their winds and ionising radiation, and low-mass stars forming in the same molecular cloud. Since the general scenario of low-mass star formation from a collapsing cloud core via a disk/outflow scenario to a protostar is more or less known[8, 9], many parameters can be derived from the mass distribution[10]. Among the questions in this context are: Does the slope of the IMF vary on small scales? Do low-mass stars in a starburst event form together with the more massive stars or at different times? It might also not be to daring to ask if low-mass stars form at all in an environment of violent, young massive stars.
2.1 Observations and Data Reduction
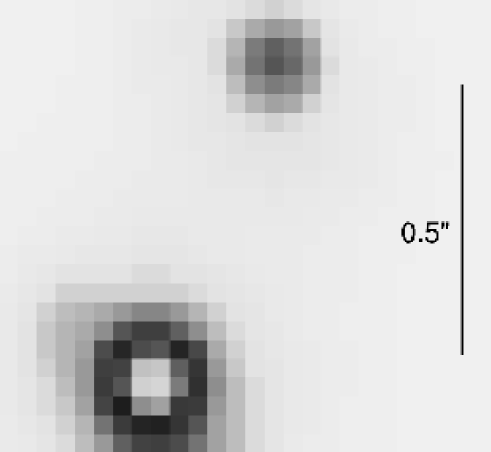
NGC 6611 was observed during the ALFA science demonstration run in September 1999. The seeing conditions were median with a -band seeing of 09. Locked on the reference star of the AO was running at a speed of 75 Hz using 18 subapertures and correcting 18 Modes222We were using so-called “sensor modes”, the lower ones of which are identical to the corresponding Kahunen-Loeve modes. The upper sensor modes are linear combinations of higher KL-modes to make use of more statistically independent information than contained in the original KL-modes[11]. Albeit, we were far from the diffraction limit (see Fig. 2). Total integration times were 5 minutes in each of the filters , and . Data reduction followed standard IR procedures, using a mosaic pattern to acquire a sky frame and subtracting that before flatfielding. Bad pixels were mostly removed during mosaic combination, few remaining bad pixels in non-overlapping regions were removed by filtering. Photometric calibration was performed by observing the standard AS37[12]. For remarks on image quality see the caption of Fig. 2
 |
2.2 Determination of the IMF
The whole of NGC 6611 was thoroughly examined by Hillenbrand et al. (1993)[13]. They give a mean age for the cluster of 2() yrs and a mean extinction of 3.2 mag towards the cluster region. Relying on their age determination, we can de-redden the stars via the two-colour and the colour-magnitude diagrams. Thus we will be able to extend the IMF towards lower mass stars than Hillenbrand et al. Photometry was done using the IDL-implementation of DAOPHOT[14]. The extinction towards the cluster can of course vary across the cluster and especially towards the centre - which we observed. Fig. 2 shows a distinct lack of stars close to the central WFS-star. This indication of a higher extinction towards the centre than towards the outer parts is also accompanied by indications for high reddening towards the centre (up to mag). The process of de-reddening the sources and constructing the IMF is currently under way, the result will be published in a forthcoming paper[15].
3 Identifying the ionising source of G11.11-0.40
 |
Ultracompact Hii regions (UCHiis) are small (0.15 pc), ionised areas surrounding newly born massive stars (m 8 M⊙). Deeply embedded in the natal molecular clouds of these stars, UCHiis are invisible at optical wavelengths but appear bright from the near infrared to the radio domain. UCHiis appear in many different morphologies and one of the key questions is why they are so many of them: Comparing the lifetime which theory predicts for the expansion of an ionised shell around a star to the lifetime of O-type stars, one computes a predicted number of UCHIIs which is at least a factor of ten lower than the observed number. Among the possibilities to answer this question and to distinguish between the many models that describe UCHIIs, is the clear identification of the ionising sources of these objects.
3.1 Observations and Data Reduction
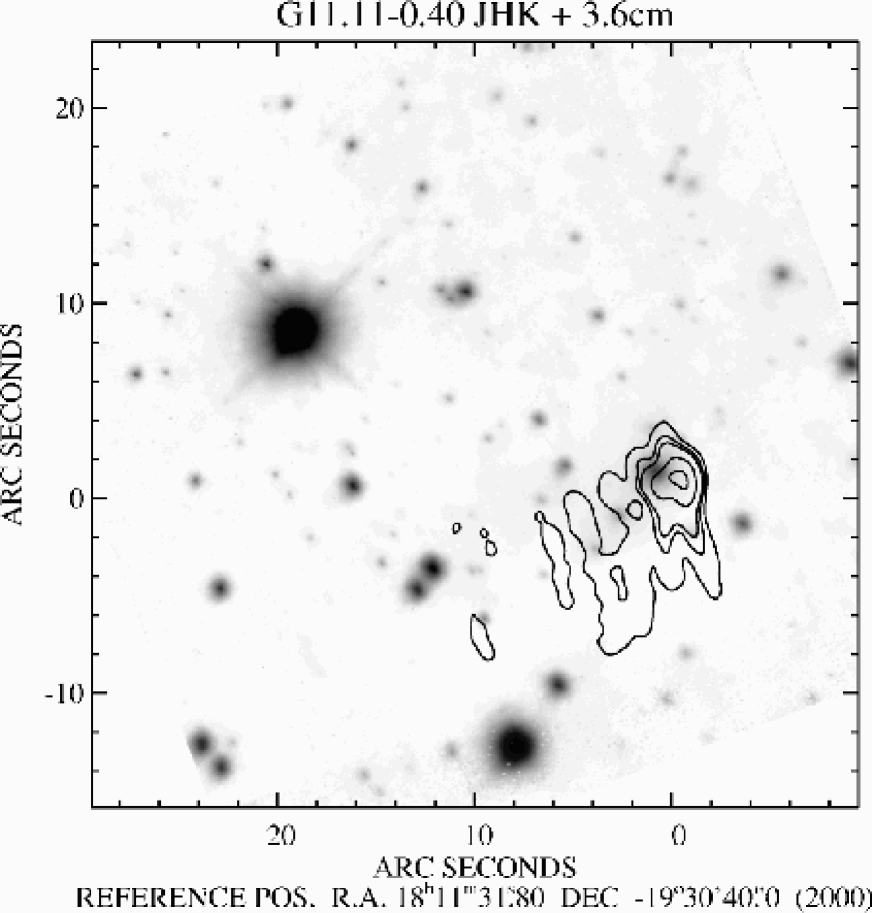
G11.11 was observed during the same night as NGC 6611. Although external conditions were practically the same and the WFS-star 2 mag fainter than that of NGC 6611, the AO system was much better adapted to the seeing this time: In the image centre, the stellar PSF is practically diffraction limited in and and Strehl numbers reach 28% even after the mosaic combination. Observational parameters and techniques were also identical to NGC 6611. Total integration times were 5 minutes in each band in this case. The resulting colour composite image can be seen in Fig. 3
3.2 The Ionising Source
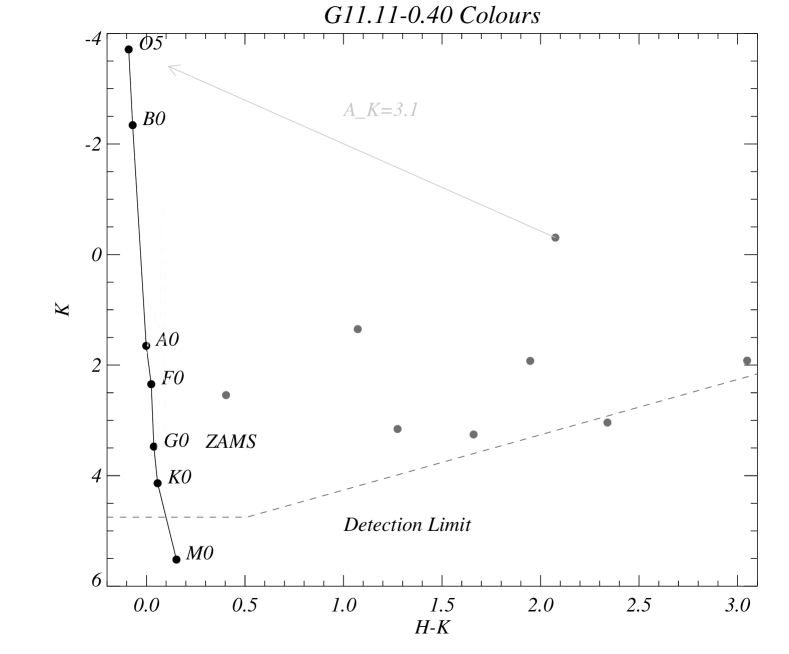 |
Figure 3 shows that clearly three rather red point sources333At our resolution of 04 are located close to the ionised region denoted by the contours of the 3.6 cm free-free emission. They appear to lie on the northern rim of a dark cloud which clearly blocks background stars to the south. To identify the ionizing source of G11, photometry was performed on the and frames of G11. the sources inside the ionised region (see VLA contours in Fig. 3) are not detected in . For photometry, an IDL adaption of DAOPHOT was used. The brightest source inside the ionised region was used as PSF reference for DAOPHOT. Since no signs for resolved aditional emission was detected from this source, this step seemed justified. It also guarantees optimum adaption to the local shape of the PSF, which is slightly elongated due to tip-tilt anisoplanatism. The results of the photometry are shown in the colour-magnitude diagramme in Fig. 4. This figure shows the zero age main sequence (ZAMS) in red plus some pre-main sequence evolutionary tracks by D’Antona & Mazitelli[16]. For the sources inside G11, a distance module of 13.58, corresponding to a distance of 5.2 kpc[17] was applied to the -magnitude.
 |
The 8 sources inside or closest to the ionised region are shown here. From a Br map observed with IRAC2b on ESO’s 2.2 m telescope on La Silla (Chile), we derived the extintion towards the ionised region via comparison to the observed free-free flux at 2 cm. This procedure yielded an extinction of 3.1 mag at the wavelength of Br (2.166 m). This extinction is assumed to be constant across the -band. When applying the corresponding de-reddening vector to the brightest source inside G11, we find the star located just short of the position of an O5 star in Fig. 4.
When calculating the Emission measure from the 2 cm emission, we get 0.7 pc cm-6, corresponding to an electron density of 4.2 cm-3. According to Kurtz et al.[17], this request a minimum 1047.7 Lyman continuum photons per second from the ionizing source. Models by Panagia[18] indicate that this number can be delivered by a single star around spectral type O9. Of course one has to be careful: On the one hand, it is generally unknown how much the UV photon flux is influenced by the presumed youth of the star. On the other hand, dust inside the region may absorb Lyman continuum photons and thus require a star of earlier spectral type than O9. Such dust would, if located between the Br emitting region and the star itself also explain the additional reddening between the de-reddened location of the ionizing source in Fig. 4 and the actual location of an O5 star.
Information on the other sources, on dust masses/densities and the IMF close to G11 will be given in Henning et al.[19]
4 Spectroscopy of the young binary system T Tau
 |
The AO system ALFA can be operated in combination with the integral field sepctrometer 3D[20]. This combination was used in September 1999 to observe the young binary system T Tau. ALFA delivered a resolution of 014. Spectra were extracted from the central 22 pixels of each PSF. The spectral resolution of 3D is 1000 in this mode, the spectral range extends across 0.4 m and thus across the complete and -bands.
 |
4.1 The Spectra
A thourough introduction into the T Tau system can be found e.g. in [21]. Resulting spectra can be seen in figures 7 and 8. The primary or northern component (N) has its maximum shortwards of the -band and shows a falling spectral energy distribution (SED) across the -band. These are the first clearly separated spectra of both T Tau components. The behaviour of the secondary or southern component (S) is exactly the opposite. Its SED is steeply rising across both bands. Nevertheless, the presence of pronounced Br lines indicates, that both objects are actively acreting, classical T Tauri stars.
As for the secondary, line emission from higher Bracket transitions can be seen in the -band data. These data are currently undergoing a thorough analysis and will be presented in a forthcoming paper[22]
 |
5 The Impact
We have presented data obtained during the Science demonstration programme of the ALFA system in 1999. These deal with various aspects of star formation research. The analysis of these data currently under way would have been impossible, had they been taken under seeing conditions (1′′) at the time of the observations. The data quality reaches from that of corresponding to data taken at very good telesopes at very good sites (remember, we only have a 3.5 m telescope on an average mountain) to better than HST (See the spectroscopic data of T Tau). Clearly, the picture of star formation will be complemented by the detailed studies of IMFs in clusters and UCHsc iis, by the studies of ionisation mechanisms, and by highly detailed studies of individual systems like T Tau. From our results, it becomes clear that any study relying on observational results of a quality inferior to ours must lead to misleading or wrong results. Binary misidentifications, missing photometric completeness due to low sensitivity when observing with low resolutions, misinterpretations of sprectal data taken in close environments of stars, all these errors are inevitable consequences of observing at natural seeing conditions of 07 or worse.
ACKNOWLEDGMENTS
The authors would like to thank the rest of the ALFA and 3D teams for their co-operation during the observing runs.
References
- [1] M. J. McCaughrean and C. R. O’Dell, “Direct imaging of circumstellar disks in the orion nebula,” AJ 111, p. 1977, May 1996.
- [2] B. Stecklum, T. Henning, M. Feldt, T. Heyward, M. Hoare, P. Hofner, and S. Richter, “The ultracompact hii region g5.97-1.17: An evaporating circumstellar disk in m8,” AJ 115, p. 767, 1998.
- [3] L. M. Close, F. Roddier, M. J. Northcott, C. Roddier, and J. E. Graves, “Adaptive optics 02 resolution infrared images of hl tauri: Direct images of an active accretion disk around a protostar,” ApJ 478, p. 766, Mar. 1997.
- [4] D. E. Potter, L. M. Close, F. Roddier, C. Roddier, J. E. Graves, and M. Northcott, “Adaptive optics j band imaging polarimetry observations of the circumbinary disk around uy aurigae,” in Astronomy with adaptive optics : present results and future programs, Proceedings of an ESO/OSA topical meeting, held September 7-11, 1998, Sonthofen, Germany, Publisher: Garching, Germany: European Southern Observatory, 1999, ESO Conference and Workshop Proceedings, vol. 56, Edited by Domenico Bonaccini, p.353, pp. 353+, 1999.
- [5] E. Martin, S. Kulkarni, C. Koresko, B. Lane, and P. Wizinowich, “A search for brown dwarf companions using the keck adaptive optics facility,” in American Astronomical Society Meeting, vol. 195, pp. 9303+, Dec. 1999.
- [6] B. Stecklum, T. Henning, M. Feldt, P. Hofner, M. G. Hoare, and T. L. Hayward, “Adaptive optics observations of young massive stars,” Proc. SPIE 3353, pp. 398–405, Sept. 1998.
- [7] S. Hippler, A. Glindemann, M. Kasper, P. Kalas, R. R. Rohloff, K. Wagner, D. P. Looze, and W. K. Hackenberg, “Alfa: the mpia/mpe adaptive optics with a laser for astronomy project,” Proc. SPIE 3353, pp. 44–55, Sept. 1998.
- [8] F. Shu, J. Najita, D. Galli, E. Ostriker, and S. Lizano, “The collapse of clouds and the formation and evolution of stars and disks,” in Protostars and Planets III, E. Levy and J. Lunine, eds., pp. 3–45, The University of Arizona Press, (Tucson & London), 1993.
- [9] S. V. W. Beckwith and A. I. Sargent, “Circumstellar disks and the search for neighbouring planetary systems,” Nature 383, p. 139, September 1996.
- [10] B. Brandl, W. Brandner, F. Eisenhauer, A. F. J. Moffat, F. Palla, and H. Zinnecker, “Low-mass stars in the massive hii region ngc 3603 deep nir imaging with antu/isaac,” A&A 352, pp. L69–L72, Dec. 1999.
- [11] M. Kasper, D. Looze, S. Hippler, M. Feldt, R. Weiß, A. Glindemann, and R. Davies, “A practical approach to modal basis selection and wavefront estimation,” in Proc. SPIE, 2000.
- [12] L. K. Hunt, F. Mannucci, L. Testi, S. Migliorini, R. M. Stanga, C. Baffa, F. Lisi, and L. Vanzi, “Northern jhk standard stars for array detectors,” AJ 115, pp. 2594–2603, June 1998.
- [13] L. A. Hillenbrand, P. Massey, S. E. Strom, and K. M. Merrill, “Ngc 6611: A cluster caught in the act,” AJ 106, pp. 1906–1946, Nov. 1993.
- [14] P. B. Stetson, “Daophot - a computer program for crowded-field stellar photometry,” PASP 99, pp. 191–222, Mar. 1987.
- [15] F. Eisenhauer, M. Feldt, et al., “Dtermining the imf of ngc6611,” in preparation , 2000.
- [16] F. D’Antona and I. Mazzitelli, “New pre-main-sequence tracks for m less than or equal to 2.5 solar mass as tests of opacities and convection model,” ApJS 90, pp. 467–500, Jan. 1994.
- [17] S. Kurtz, E. Churchwell, and D. O. S. Wood, “Ultracompact h ii regions. 2: New high-resolution radio images,” ApJS 91, pp. 659–712, Apr. 1994.
- [18] N. Panagia, “Some physical parameters of early-type stars,” AJ 78, p. 929, 1973.
- [19] T. Henning, M. Feldt, B. Stecklum, and R. Klein, “High resolution observations of ultracompact hii regions iii:g11.11-0.04 and g341.21-0.21,” In preparation , 2000.
- [20] L. Weitzel, A. Krabbe, H. Kroker, N. Thatte, L. E. Tacconi-Garman, M. Cameron, and R. Genzel, “3d: The next generation near-infrared imaging spectrometer.,” A&AS 119, pp. 531–546, Nov. 1996.
- [21] T. M. Herbst, S. V. W. Beckwith, A. Glindemann, L. E. Tacconi-Garman, H. Kroker, and A. Krabbe, “A near-infrared spectral imaging study of t tau,” AJ 111, pp. 2403+, June 1996.
- [22] M. Kasper, T. Herbst, M. Feldt, and L. Looney in preparation , 2000.