A new era of spectroscopy: SINFONI, NIR integral field spectroscopy at the diffraction limit of an 8m telescope
Abstract
SINFONI, the SINgle Faint Object Near-infrared Investigation, is an instrument for the Very Large Telescope (VLT), which will start its operation mid 2002 and allow for the first time near infrared (NIR) integral field spectroscopy at the diffraction limit of an 8-m telescope. SINFONI is the combination of two state-of-the art instruments, the integral field spectrometer SPIFFI, built by the Max-Planck-Institut für extraterrestrische Physik (MPE), and the adaptive optics (AO) system MACAO, built by the European Southern Observatory (ESO). It will allow a unique type of observations by delivering simultaneously high spatial resolution (pixel sizes 0025 to 025) and a moderate spectral resolution (R2000 to R4500), where the higher spectral resolution mode will allow for software OH suppression. This opens new prospects for astronomy.
Keywords: spectroscopy, diffraction limit, near infrared, integral field, adaptive optics
1 INTRODUCTION
A number of astrophysical questions, both extragalactic and galactic, call for high spatial resolution imaging spectroscopy. Some examples are the nature of high redshift objects, the centres of various types of galaxies, quasar hosts, or, more locally, the properties of young stars and star forming regions or the central parsec of our own Galaxy.
In June 2002, SINFONI,[1] the SINgle Faint Object Near-infrared Investigation, will start its operation at the Very Large Telescope (VLT) UT3 (KUEYEN). SINFONI is a collaborative effort by the Max-Planck-Institut für extraterrestrische Physik (MPE) and the European Southern Observatory (ESO), with MPE providing the NIR imaging spectrometer SPIFFI,[2],[3] while ESO builds the curvature sensor based adaptive optics system MACAO.[4] The laser guide star provided by the UT3 telescope guarantees a high sky coverage for diffraction limited observations.
SPIFFI is equipped with a 10242 HgCdTe HAWAII detector array from Rockwell. In order to fully exploit the detector, 1024 spectra are obtained in one integration, corresponding to a field of 3232 spatial pixels on the sky. Each spectrum covers 1024 pixels, and the resolution can be chosen to be R4500 for J, H or K-band, which allows software OH suppression, or to be R2000, however, covering H and K band at the same time. The spatial pixel scale is variable (0025 to 025) to allow for various observational conditions. In order to determine SINFONI’s sensitivity, we have created an exposure time calculator for the computation of the signal-to-noise ratio (SNR) or the simulation of observations of template objects. All input parameters are supplied by a graphical user interface. In the following chapters, we will give a very brief technical description of SPIFFI, then describe the exposure time calculator and finally discuss some test cases for scientific observations.
2 SINFONI
The most important point for the design of a spectrometer at the diffraction limit of a telescope is that the point spread function (PSF) delivered by an adaptive optics system is usually variable on timescales of a few minutes, both in shape and in the relative contributions of diffraction limited core versus seeing limited halo. These variations depend in a complicated way on parameters like seeing, magnitude of the guide star, angular separation of guide star and object, the number of modes corrected, the frequency of operation etc. If image deconvolution is anticipated, information about the PSF is required. But even in the case of no deconvolution, the spectroscopy of extended objects requires the knowledge of the PSF, so that the various spatial contributions to the spectra can be treated correctly. A long slit spectrograph prohibits this kind of investigation, because it provides only 1-d spatial information. Fabry-Perot spectrometers and fourier transform interferometers deliver the information about the PSF, but the conditions are rarely such that the PSF stays stable over a whole wavelength range scan. An integral field spectrometer overcomes this problem by delivering the 2-d spatial information for the whole wavelength range in one integration.
The NIR is best suited for AO-assisted observations, because the performance of AO systems increases with wavelength. Starting around 2.2 m, the thermal background introduced by telescope and atmosphere leads to an increase in the noise level. A compromise of these two aspects detemines the NIR H and K windows to be the most suited wavelenth ranges for diffraction limited spectroscopy. SINFONI will be optimized to fulfill this task.
In short, SPIFFI is a cryogenic NIR integral field spectrometer, based on a HAWAII focal plane array and has a variable spatial and spectral resolution, suitable for the use with an AO system. Some design criteria of the instrument that affect the sensitivity were the following:
-
•
Detector: Rockwell HAWAII focal plane array, 10242 pixels. Readout noise 8 per read, dark current . An upgrade to a 20482 array is foreseen.
-
•
One spectrum per column (=1024 spectra), not Nyquist sampled in spectral domain.
-
•
Variable pixel scales to account for various observing conditions: 0025/pix for AO-assisted observations, 01 and 025 for seeing limited cases.
-
•
The SPIFFI mirror image slicer[6] has a field size of 32x32 pixels (corresponding total fields between 0808 and 8080
-
•
Spectral resolution either around 4000 for J, H or K, sufficient for software OH suppression, or 2000, covering H and K simultaneously. Nyquist sampling is achieved by spectral dithering in two successive observations.
-
•
Implementation of a “Himmelsspinne” (“Sky spider”) to overcome the limitation on the length of single integrations implied by the necessity to go to a sky position after 100s at latest. The Himmelsspinne images a piece of sky onto the detector and allows to increase the integration times above 100s.
The SPIFFI transmission is 32%. The transmission of the telescope and the AO is assumed to be 80%.
3 THE SINFONI EXPOSURE TIME CALCULATOR
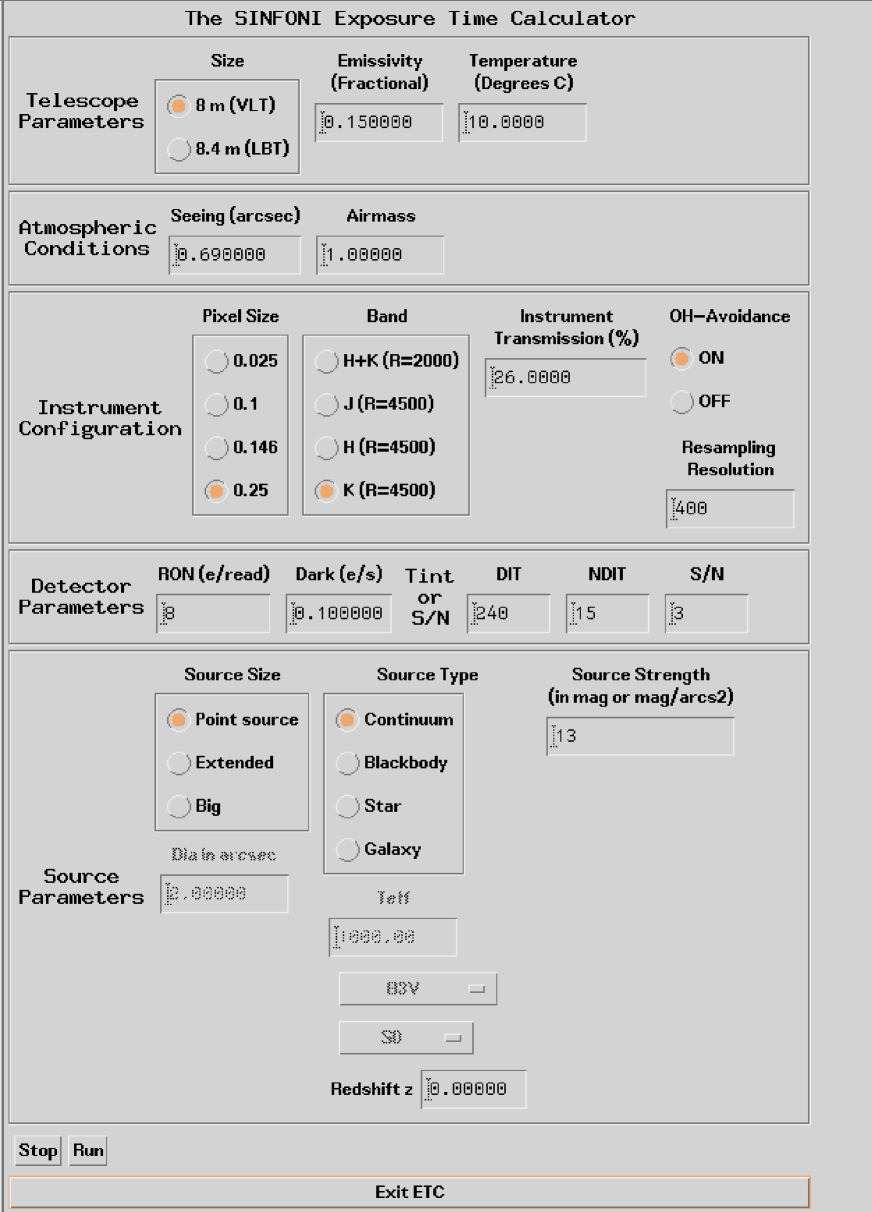
The IDL-based SINFONI exposure time calculator applies the basic formula
SNR = , N =
where denotes the total number of generated e- on a given pixel, the indices s, b and d indicate source, background and dark, respectively. R is the read noise in e-/read. It is used via a graphical user interface, which is displayed in Figure 1
The parameters we take into account are:
-
•
VLT collecting area
-
•
Atmospheric transmission curve
-
•
Spectrally averaged instrument transmission
-
•
Atmospheric emission curve
-
•
Thermal background from the telescope
-
•
Detector quantum efficiency curve
-
•
Pixel size in arcsec2 on the sky
-
•
Spectral resolution
-
•
Application of OH avoidance and/or spectral rebinning
-
•
Source extent (point source, extended with integrated spectrum or extended with pixel-by-pixel analysis)
-
•
Source magnitude (in mag for point sources, mag arcsec-2 for extended sources), spectrum and redshift
-
•
Seeing
-
•
Strehl ratio in AO assisted observations
Depending on what is required, two of the following parameters need to be supplied, the third is then determined:
-
•
Integration time
-
•
S/N
-
•
source strength (in mag or mag arcsec-2)
The SPIFFI instrument was designed to maximize the througput wherever possible and to minimize the background and the noise. The first goal will be achieved by selecting high transmission/efficiency optics, and by placing them in an evacuated environment that preserves them over a long period of time. The second point requires the whole spectrograph to be a cryogenic instrument, such that the thermal background contribution of the instrument itself is negligible compared to the telescope and the sky. The third point was helped by the fact that the HAWAII array we bought from Rockwell shows low read noise and dark current. The relative impact of the read noise will be minimized by selecting long integration times, made possible by the implementation of the sky spider. Moreover we will optimize the electronics and the read out modes (multiple reads). The dark current cannot be overcome, and our estimates show that the instrument is dark limited at AO pixel scales and high spectral resolution in the J and the H band.
Table 1 lists the sensitivities for a variety of cases which are of interest to the general observer. They were computed using the SINFONI exposure time calculator which allows to set explicitly almost all of the parameters below and thus can be used to derive the corresponding magnitudes for other cases of interest. The limiting magnitudes given here are valid for the following constraints/specifications:
-
•
Operation at the VLT
-
•
S/N of 3 in 1h of integration time (15 integrations, 240s each)
-
•
Detector characteristics: 8e- read noise, 0.1e-s-1 dark current
-
•
Median Paranal seeing (069), airmass 1.0
-
•
Telescope temperature 283K, emissivity 15%
-
•
Instrumental transmission, including telescope, MACAO and SPIFFI but excluding the detector, 26%
-
•
Wavelength dependent detector quantum efficiency as provided by Rockwell, average 60%
-
•
S/N per spectral channel, resampling to R=400 for case of OH suppression
-
•
Integrated spectrum within the FWHM for the cases “Point Source” (integrated within the first Airy ring for the AO scale, within FWHM for the seeing scales) and “Extended” (this means an extended source, where the signal is integrated over an aperture supplied by the user), per spatial pixel for the last column.
-
•
Pixel size 025 for the seeing limited, 0025 (0.5diffraction limit of an 8m telescope) for the AO assisted case
-
•
Strehl ratio of 0.3 for the AO case, which is achieved with a natural guide star brighter than 14.5mag within 15” of the object or with a laser guide star brighter than 11th magnitude within 10” of the object in case of K-band[1]. The strehl ratio assumed for J-band is 0.2.
-
•
Results give point source magnitudes in the case of “Point source” and mag arcsec-2 in the cases of “Extended source” and “per pixel”, the average value for the whole band
| Point Source | Extended ( 10 pix) | per pixel | |||||
|---|---|---|---|---|---|---|---|
| No OH-sup. | OH-sup. | No OH-sup. | No OH-sup. | No OH-sup. | OH-sup. | ||
| Seeing | 20.4 | 22.7 | 21.0 | 23.3 | 18.4 | 20.7 | |
| J | AO | 22.2 | 24.3 | 17.4 | 19.6 | 14.8 | 17.0 |
| Seeing | 19.6 | 22.0 | 20.3 | 22.5 | 17.8 | 20.0 | |
| H | AO | 21.7 | 23.7 | 17.0 | 19.0 | 14.4 | 16.4 |
| Seeing | 18.5 | 20.8 | 19.2 | 21.3 | 16.7 | 18.7 | |
| K | AO | 21.0 | 22.9 | 16.3 | 18.2 | 13.7 | 15.6 |
| Seeing | 19.5 | 20.0 | 17.5 | ||||
| H+K | AO | 22.1 | 17.4 | 14.7 | |||
4 RESEARCH PROSPECTS
Now we will describe examples for the possible scientific targets of interest and the observing modes that should be chosen for their observations. Two of them are accompanied by simulated observations.
4.1 Faint, extended objects
For extended objects, the sensitivity of SPIFFI is not increased going to AO scales, because even though the sky background is reduced, the source is distributed over a larger number of pixels accordingly. In order to observe faint, extended objects, the larger pixel size is required to maximize the sensitivity. This is true, no matter if the integrated spectrum is taken or if the object is analyzed pixel-by-pixel.
One group of very obvious targets are high redshift galaxies, like they are observed in the Hubble Deep Field (HDF) at a typical spatial extent of a few arcsec. The determination of their properties will have an impact on the theories of the formation and evolution of galaxies. Their nature can only be verified spectroscopically, and many of them show a distorted spatial structure that underlines the benefit of spatially resolved spectroscopic information. The advantage that the NIR provides for this type of objects is that the optical diagnostic lines, like H and O III, are redshifted into the SINFONI observing windows for redshifts z (H) and 1.0-3.9 (O III). H is a tracer for star formation and not as prone to extinction as Ly, while O III serves as an excitation diagnostic.
| Line | m] | J | H | K |
|---|---|---|---|---|
| H | 0.6563 | 0.5–1.1 | 1.5–1.8 | 2.0–2.7 |
| [OIII]5007 | 0.5007 | 1.0–1.8 | 2.0–2.7 | 3.0–3.9 |
| H | 0.4861 | 1.1–1.9 | 2.1–2.8 | 3.1–4.0 |
| [OIII]3727 | 0.3727 | 1.7–2.8 | 3.0–3.9 | 4.4–5.5 |
| Ly | 0.1215 | 7.2–10 | 11–14 | 15–19 |
To identify and measure those lines, a low spectral resolution is sufficient (e.g., R=400), which means that the observations are performed at a high spectral resolution and after OH suppression are rebinned along the spectral axis to result in a lower spectral resolution, thereby increasing the SNR.
The spectra in Figures 2 and 3 show the simulated observations of a spectrum with a strong emission line (initially an Ultra Luminous Infrared Galaxy (ULIRG) spectrum redshifted to z=0.25, where the Pa line is shifted into the K-band). The simulated performance is calculated for a single pixel in 1h integration time for a source of 16 mag arcsec-2 surface brightness. The top spectrum shows the input spectrum, the result at the initial resolution of R4500 without OH-suppression is displayed in the lower left spectrum. The lower right spectrum was created by resampling (R1300) with software OH suppression. For comparison, a spectrum derived at a point source magnitude of 20mag is plotted in Figure 3. In all spectra, the Pa line can be clearly identified and used as a diagnostic for star formation.


4.2 Faint point sources
In the case of point sources, the sensitivity is increased going to the AO pixel scales, because the sky background is reduced and the number of pixels covered by the source stays the same. So for maximum sensitivity, the AO pixel scale will be chosen. In the case of very faint targets, it is possible to convolve the spectrum down to a lower resolution, if for example the detection of emission lines is the goal.
Typical objects for this case are QSOs. Many questions concerning their nature are still unresolved, like the existence and nature of their hosts and the relative contributions of the quasars and their hosts to the spectrum. The quasars also show strong emission lines which are redshifted into the SINFONI windows at various redshifts (see Table 2). They can provide clues about the nature of these objects.
4.3 Bright extended objects
The objects in this group are expected to be observed at high spectral and spatial resolution. The targets are for example interacting galaxies, the narrow line regions of AGN or near-by ULIRGS as extragalactic targets, jets and disks around young stars or planetary nebulae in our Galaxy. Those objects will profit from the spatial coverage of SINFONI, and their spectra can be studied pixel-by-pixel.
One group of targets where already SINFONI’s precursor MPE 3D[7] has been proven to deliver valuable data is the centres of external galaxies. MPE 3D’s spectral resolution of 2000 is sufficient to determine the stellar dynamics in these targets, and it was shown that the three-dimensional information is required for the determination of a central mass, because only then can anisotropy effects be accounted for.[8]
4.4 Bright point sources


For bright point sources, the possibility to use the AO scales applies, as well, and the high spectral resolution can be exploited. Possible targets are the cores of globular or young stellar clusters, close binary star systems or star clusters in external galaxies. In cases where the star clusters are resolved into single stars, it is possible to determine their spectral type and thus to place them on the Hertzsprung-Russell diagram. This will then allow conclusions on the stellar content of these clusters and thereby the Initial Mass Function (IMF), which is still an open question. The following simulation (Figure 4) shows a spectrum of an M supergiant (M2Iab-Ib). This kind of spectrum is observed in clusters at an age in the 10Myr regime, which are dominated by this type of stars. They can for example be observed in interacting galaxies, or can be the central cluster in a galaxy. If the velocity dispersion is high enough (km/s) in the cluster, it can be determined at the spectral resolution of SPIFFI. The input parameters for the simulation were the standard parameters again, the object was assumed to be a point source of 17th mag and 15th mag, respectively. The input spectrum is displayed at the top. No spectral rebinning was applied. In the first case, the presence of CO absorption features can clearly be verified, which can serve to age date the population. In the second case, the SNR is high enough (30) to determine a broadening of the feature due to a velocity dispersion in the cluster.
References
- [1] Thatte N., Tecza M., Eisenhauer F., Mengel S., Krabbe A., Pak S., Genzel R., Bonaccini D., Emsellem E., Rigaut F., Delabre B., and Monnet G., “SINFONI: A near infrared AO assisted integral field spectrometer for the VLT”, 1998, SPIE proc., 3353, 704
- [2] Tecza M., Thatte N., Krabbe A., and Tacconi-Garman L.E., “SPIFFI: A High-Resolution Near-Infrared Imaging Spectrometer”, 1998, SPIE proc., 3354, 394
- [3] Eisenhauer F., Tecza M., Mengel S., Thatte N., Röhrle C., Bickert K., and Schreiber J., “Imaging the Universe in 3D with the VLT: The Next Generation Field Spectrometer SPIFFI”, 2000, SPIE proc., this volume
- [4] Bonaccini D., Rigaut F., Dudziak G., and Monnet G., “Curvature adaptive optics at ESO”, 1998, Proc. SPIE, 3353, 553
- [5] Thatte N., Anders S., Eisenhauer F., Tecza M., Mengel S., Eckart A., Genzel R., Monnet G., and Bonaccini D., “Near-IR Integral Field Spectroscopy with Adaptive Optics”, 2000, ASP Conference Series, in press
- [6] Tecza M., Thatte N., Eisenhauer F., Mengel S., Röhrle C., Bickert K., and Schreiben J., “The SPIFFI image slicer: Revival of image slicing wiht plane mirrors”, 2000, SPIE proc., this volume
- [7] Weitzel L., Krabbe A., Kroker H., Thatte N., Tacconi-Garman L.E., Cameron M., and Genzel R., “3D: The next generation near-infrared imaging spectrometer”, 1996, AAS, 531
- [8] Anders S., “Beugungsbegrenzte Nahinfrarot-Feldspektroskopie und Stellare Kinematik in der Galaxie NGC 3115”, 1999, Thesis Ludwig-Maximilians-Universität, München, Germany