Chandra Observations of the Young Pulsar PSR B0540-69
Abstract
The young pulsar PSR B0540-69 was one of the first targets observed with the Chandra X-Ray Observatory. The high angular resolution of Chandra allows us to resolve the compact nebula surrounding the pulsar. We have determined a position for PSR B0540-69 of (J2000) with a radial uncertainty of . Combining our measurements of the pulsar period with previous measurements covering a span of 12 years, we derive a braking index of 2.08. The spectrum of the pulsed emission is consistent with a power-law with a photon index of . The compact nebula has a softer spectrum with a photon index of 1.85–2.26.
1 Introduction
PSR B0540–69 is a young, energetic pulsar located in the Large Magellanic Cloud (LMC) and discovered in soft x-rays using the Einstein observatory (Seward, Harnden, & Helfand 1984). The pulsar is similar to the Crab pulsar in period, 50 ms versus 33 ms for the Crab, characteristic spin-down age, 1600 yr versus 1240 yr, and spin-down power, versus . Comparison of detailed observations of PSR B0540–69 versus those of the Crab should be a useful test of models of young pulsars, their evolution, and their associated nebulae.
Due to the large distance to the LMC, PSR B0540–69 is a faint source. While it has been been observed in the x-ray, optical, and radio, relatively long observations on large telescopes are required to obtain good signal to noise and, thus, observational coverage is spotty. Previous observations of PSR B0540–69 have led to discordant ephemerides and significant disagreements about the braking index.
Here, we present an analysis of early Chandra X-Ray Observatory observations of PSR B0540–69 made using both the High Resolution Camera (HRC; Murray et al. 1997) and the ACIS imaging camera (ACIS-I; Bautz et al. 1998). An early analysis of the HRC data has been previously described in Gotthelf & Wang (2000) which reported on the morphology of the spatially resolved nebula near the pulsar and outer shell of the remnant. Here, we analyze the HRC data with an improved aspect solution needed to obtain the correct position for PSR B0540–69 and to remove artifacts present in the initial processing of the data. In addition, we present results on the x-ray spectrum of the pulsar, the compact nebula, and the outer remnant from an analysis of the ACIS data. We describe the observation and our analysis in §2. We present results on the source location, the pulsar period history, the extent of the nebula, and the spectrum of the emission in §3. We conclude in §4.
2 Observations and Analysis
PSR B0540–69 was observed with the Chandra X-Ray Observatory (CXO; Weisskopf 1988) during the verification and checkout phase on 31 August 1999 using the High Resolution Camera (HRC; Murray et al. 1997) for a total of 18 ks of good observing time and on 26 August 1999 using the ACIS imaging camera (ACIS-I) for a total of 20 ks of good observing time. All observations employed the High-Resolution Mirror Assembly (HRMA; van Speybroeck et al. 1997).
The absolute time calibration of Chandra has not been finalized. For this reason, we use only frequency measurements in the analysis below. The accuracy of the relative time-tagging within an observation is determined by the spacecraft clock which is stable to better than one part in over one day (Chandra Observatory Proposer’s Guide). The conversion to a barycentric time frame introduces an additional frequency uncertainty of less than in these observations. Thus, the accuracy of the barycentric frequency determination is more than sufficient for the frequency analysis presented below.
2.1 HRC Analysis
The HRC is a microchannel plate imager having very good spatial and time resolution, but essentially no energy resolution. Each photon detected by the HRC is time tagged with a precision of s and position tagged with a precision of 0.132″. This makes possible time-resolved imaging studies. After launch, an error was found in the HRC wiring which causes the event time tag to actually contain the time of the previous event trigger (Seward 2000). Without correction, this leads to an timing error equal to the time between successive event triggers. The event trigger rate is typically 250–300 s-1, leading to a typical error of 3–4 ms. A special operating mode for the HRC has been developed in which all event triggers are telemetered to the ground and the timing error can be eliminated by shifting of event time tags. However, in the HRC observation reported here, not all event triggers result in valid events telemetered to the ground and correction of the event times is not possible in all cases. Thus, the event times contain typical errors of 3–4 ms. This error is small relative to the 50 ms period of PSR B0540–69 and does not significantly affect the period determination or the pulsed-phased resolved imaging presented below.
This observation of PSR B0540–69 was only the third observation made with the HRC of a celestial source and was performed before the correct focus position of the HRC was determined. During this observation, the HRC was displaced by from the true focus. This defocuses the image of an ideal point source, ignoring mirror and aspect imperfections, to an annulus with inner and outer radii of and .
We applied aspect to X-ray events from the HRC using a version of the Chandra X-Ray Observatory Center (CXC) aspect pipeline (R4CU5, 11-Jan-2000) which utilizes elliptical Gaussian centroiding. Use of the improved aspect solution is critical to obtain correct positions. The relative aspect reconstruction within the observation was checked by using the aspect solution for this observation to de-dither the optical guide star centroids. This is similar to the process used to apply aspect correction to x-ray events. We found no systematic residuals in the de-dithered star images, leading us to conclude that relative aspect during the observation is stable to within . The absolute accuracy of the aspect reconstruction was tested using a series of observations of 8 HRC-I observations of known x-ray point sources with identified optical counterparts with very accurate astrometry (Aldcroft et al. 2000). In each case, the derived X-ray source position was compared with the known counterpart position to derive the celestial location error. The absolute source coordinate uncertainty is ( radial error).
The data were filtered using event screening techniques (Murray et al. 2000) to eliminate “ghost” events produced by the HRC electronics (Dobrzycki 2000). Screening to eliminate “ghost” events is particularly important due to the brightness of PSR B0540–69. The screening removes image artifacts which could have been incorrectly interpreted as features of the x-ray emission.
We extracted an image which shows the pulsar as a bright point source surrounded by nebular emission with a roughly elliptical shape with an extent of a few arc-seconds. We used centroiding as implemented in the standard Chandra software routine celldetect to determine the position of the point source (CIAO V1.1 Software Tools Manual). The coordinates found are (J2000).
These coordinates were used to perform an initial barycentric correction employing the JPL DE-405 ephemeris. We searched for pulsations using the statistic also known as the Rayleigh test (e.g. Buccheri, Ozel, & Sacco 1987). As the pulse profile of PSR B0540–69 is known to be roughly sinusoidal (Seward et al. 1984), we used only the first order statistic. Pulsations were easily detected from PSR B0540–69.
As the diffuse emission from the nebula surrounding PSR B0540–69 may affect the position determination, we created a difference image to isolate the pulsed source. We made a “pulsar-on” image using photons taken from an interval of 0.5 in phase with an offset chosen to maximize the number of photons selected, and a “pulsar-off” image from the remaining data. The “pulsar-off” image was subtracted from the “pulsar-on” image to obtain the difference image. All x-ray sources, in particular the constant nebular emission, not pulsed at the folding frequency are removed by this procedure. The difference image shows only a single point source.
We note that the “pulsar-off” image does contain some pulsar emission because the pulse profile is roughly sinusoidal (Seward et al. 1984) and is not zero during the full 0.5 in phase of the “pulsar-off” image. The HRC timing error causes some additional pulsar photons to be shifted into the “pulsar-off” image, but the effect is relatively small since the timing error of 3–4 ms is small compared to the phase bin size of 25 ms. The presence of some pulsar emission in the “pulsar-off” image reduces the amplitude of the pulsar peak in the difference image. However, we found that the difference image still contains a highly significant peak at the pulsar position and that use of the maximum size phase bins was advantageous in reducing image noise away from the peak where the photon statistics are much lower. We also note that the timing error produces a very small net shift of nebular photons into the “pulsar-on” image. If the timing error were simply a random number added to the time tag, then the net shift would be zero since the number of nebular photons moved from the “pulsar-off” image into the “pulsar-on” image would equal the number moved in the opposite direction. However, since the error is actually a shift of time tags, the fact that the event trigger rate is slightly higher during the “pulsar-on” interval (by a factor equal to the pulsar count rate divided by average total event trigger rate or roughly 0.3%) produces a net shift. We estimate that the net shift of nebular photons into the “pulsar-on” image is less than 0.05%.
Using the position obtained from this difference image, we performed a second barycentric correction and selected events within a circle with a radius of 9 HRC pixels (1.1″) around the difference image position. We again searched for pulsations and found a strongly significant pulsation signal at 19.7988001(21) Hz at epoch MDJ 51421.6240; the digits in parentheses indicate the uncertainty.

We made a second difference image using this best period, see the dotted contours in Fig. 1. The position of the source in the two difference images agree within . The position from the final image is (J2000). The position uncertainty is dominated by the accuracy of the aspect reconstruction which we take to be ( radial error). For the difference image, 50% of the flux is contained with a diameter of 1.3″. This is significantly larger than the half-power diameter of measured for AR Lac in calibration observations made to determine the on-orbit point spread function (Jerius et al. 2000), but is consistent with the expected combined effects of the HRMA point-spread function given the harder spectrum of PSR B0540–69, the relative aspect accuracy measured for this observation, the position resolution of the HRC, and the defocusing.
2.2 ACIS Analysis
The ACIS-I camera consists of an array of 4 front-illuminated charged coupled devices (CCDs). The physical pixel size is 0.24 m which at the aim-point of the telescope is comparable to the spatial resolving power of the HRMA. Each CCD contains pixels organized into 4 readout nodes each of which reads out 1024 rows and 256 columns of pixels. The pulsar was positioned at the aimpoint of the telescope, which is about 960 rows away from the readout node on ACIS-I device I3. The pulsar and its surrounding nebula fit very well onto node 3 of device I3, therefore we use only this node in our analysis. The ACIS flight software was set to an on-board processing mode that retains the pixel event island.
In order to have sufficient time resolution to resolve the pulses from PSR B0540–69, the ACIS-I was operated in continuous clocking mode (“cc-mode”). In this mode, charge is continually shifted between successive pixels in each row and the pixel at the base of each row is read out after each charge transfer. This leads to acquisition of a one-dimensional image each 3.1 ms. The 1-d image integrates flux along the readout direction. The time of arrival of each photon must be calculated from the time of readout and the (unknown) position of arrival along the readout direction divided by the speed of pixel transfer along the readout direction.
The data on ground were manually processed through the standard CXC pipelines into CXC level 1 event lists. As software for the analysis of cc-mode data is not currently available from the CXC, we further processed the ACIS-I data using custom IDL procedures. The pointing direction was transformed to the spacecraft coordinate frame (, in detector pixels) so that the event positions could be corrected for dither in the detector direction only via , where is the position of the event projected along a line on the sky (at a position angle of 66.97°), is the event coordinate in “tiled” coordinates (tdetx), is the sign of the correction for dither (-1 for chips I1 and I3 and +1 for chips I0 and I2), and is a random variable between -0.5 and 0.5 that reduces effects of aliasing. The spacecraft dither and optical bench distortions are accounted in the term , which is the derived from interpolating , where gives the motion of the science instrument module (SIM) measured by the on-board fiducial lights.

The histogram of the values, i.e. the one-dimensional image perpendicular to the readout direction, is shown in Fig. 2. For this observation, the 1-d image is along a positive angle of 67°, or approximately ENE, as indicated on the HRC image in Fig. 1. We define the angle along the 1-d image as positive to the ENE. A reference point is computed by fitting a narrow Gaussian to the brightest pixels, assuming that the synchrotron nebula provides a simply sloping background. The profile of the pulsar is well fitted by a Gaussian with a dispersion of 0.30″, which is consistent with the telescope point spread function (PSF). The coordinates in Fig. 2 are relative to the fitted peak position. The sharp peak of the pulsar is flanked by the integrated image of the compact nebula. The compact nebula brightness distribution peaks to the SW from the pulsar position and declines rapidly further SW after the peak. The brightness falls off more slowly toward the NE. The compact nebula gives way to a more diffuse remnant, the outer supernova remnant, at about from the pulsar. The diffuse emission extends to in one direction and is truncated by a chip gap at from the pulsar in the other direction.
The event times were constructed using the event row numbers, , an interpolation of the dither and SIM correction, ; the ACIS exposure time to UT lookup table, ; the geocenter and solar system barycenter corrections, and ; and a random variable, , between 0 and 1 that reduces effects of aliasing: , where the last term is simply a constant for this observation (64.184 s), is the average detector frame shift time in ephemeris time units (about 0.00284996 s). The exposure time to UT lookup table should be accurate to less than 1 msec. Finally, the times corrected to the solar system barycenter (TCB) are .
We have found that an additional 5 s must be added to in order to match the TT times computed for the aspect data. The 5 s offset is a data processing anomaly that has not been explained fully so we merely report that it exists. Specifically, the offset is needed to bring the time-tagged aspect data into concurrence with the time-tagged photon events. Since we believe that the aspect data have “correct” times (based on data processing of other instrument configurations), we have adjusted the event times. We can state that this 5 s offset is good to about 1 s and that it has not changed across the observation at this level. More importantly, different cc-mode observations, even days later, give the same value of the shift to within 1 s, thus the secular variation in the offset is no larger than . If there were a secular drift of this timing offset at this level, then it would produce a 5 ms timing error across the ACIS observations and lead to an error on the period roughly twice the statistical error quoted below. We use this larger error in the ephemeris fit described below. The barycenter timing correction changes by only 60 ms across the ACIS observation and is approximately quadratic in form, thus a 5 s timing uncertainty produces an uncertainty of less than on the barycenter frequency correction.
The events within of the peak in the distribution were Fourier transformed to obtain the candidate pulse frequency and the best estimate was determined from pulse folding: 19.7988900(30) Hz. Two imaging profiles were obtained by selecting from phases 0.6 to 0.8 where the pulse is at a flat minimum, and phases 0.1 to 0.3 where the pulse is nearly level at maximum. These two image profiles, along with the profile of all the emission, are shown in Fig. 2.
2.2.1 Spectral analysis
The observation took place in a period where the ACIS instrument experienced large changes in the spectral response due to low energy cosmic proton impacts. This resulted in a significantly increased charge transfer inefficiency (CTI). This has two effects on the spectral response. First, the energy scale changes due to charge loss that is not recovered during the readout, and, second, the introduction of additional electron noise due to enhanced charge trapping worsens the spectral resolving power.

The focal plane temperature of the device at the time of the observation was -100∘ C. Unfortunately, during this period of change there are no response matrices available at a focal plane temperature of . However, there are calibration products available for a focal plane temperature of . Calibration data indicate that throughout most of the energy scale the change in CTI with focal plane temperature is fairly linear. The change in spectral resolution is then assumed to be linear as well. Calibration data also indicate how CTI changed during the period of degradation. By estimating the change in energy scale due to CTI as well as taking in account the energy scale shift implied by the temperature change from to , we find that the detector area between row 100 and 320 at matches the energy scale of the detector node at the time of the observation between rows 800 and 1024 at quite well. In order to fine tune the energy scale, we made fits using the available response matrices at valid for rows 100 to 320 and selected the ones that matched the expected mirror Ir-edge structures and position with the one expected for the model effective area. Currently available response matrices show a quite strong non-linearity in the energy scale below 1 keV that can affect the analysis of the soft part of the spectrum. For the analysis here, we do not fit the spectra below 1.2 keV. Fig. 3 shows a fit of the pulsar spectrum (see below). By examining known edges in the CCD response, particularly the Si K edge at 1.738 keV, we estimate that the energy scale is accurate to within 2%.
Background analysis is important in cc-mode because each pixel read out has the integrated background from 1024 CCD pixels. The contribution does not exceed 2% for the pulsar or its compact nebula, but is almost 30% for the outer remnant. We use the source free region between and to compute the background spectrum after cleaning the event list for all apparent hot columns. The measured average background rate was .
For the effective area we used the one available for the standard ACIS grade set, which is appropriate since the observation was performed in a mode that allowed reconstruction of a pixel island for each event. In order to compute the corresponding ancillary data file (arf) we used custom software that averaged over the aspect solution. This is legitimate for our analysis because no source portion in the analysis crosses a CCD or node boundary. The spectral fits were performed with XSPEC v.10.0.

| Parameter | Value |
|---|---|
| (MJD) | 47700.0 |
| (Hz) | 19.8593584982(40) |
| () | -1.8894081(7) |
| () | 3.7425(43) |
| (braking index) | 2.0820(24) |
Note. — Numbers in parentheses are errors in the last quoted digits.
3 Results and Discussion
3.1 Timing
In Fig. 4, we compare our two period measurements and two other recent observations of PSR B0540–69 (Boyd et al. 1995; Mineo et al. 1999) with the ephemeris derived by Deeter et al. (1999) using data from MJD 46992-48335. Extrapolation of the Deeter et al. (1999) ephemeris shows that the new data, which extend almost 8 years beyond the data used to derive the ephemeris, differ by at most from the predicted frequencies. We interpret this as a strong indication that the timing solution found by Deeter et al. (1999) is accurate. Both Chandra frequencies are consistent, within the errors, with the extrapolation of the Deeter et al. (1999) ephemeris. The HRC frequency measurement is within of the predicted value and suggests that no large persistent offsets in pulse frequency or its first derivative occurred during the 8 year interval. However, we are unable to rule out small persistent offsets or , similar to those reported by Deeter et al. (1999).
We combined our frequency measurements with those of Boyd et al. (1995), Mineo et al. (1999), and Deeter et al. (1999; specifically the frequency data used to derive the ephemeris and marked with note 5 in Table 4) to derive the ephemeris in Table 1. The ephemeris is consistent, within errors, with that of Deeter et al. (1999). We find a braking index of ( uncertainty) at an epoch 47700 MJD. This braking index is much lower than the index of 3 expected for energy loss via electromagnetic dipole radiation and is significantly lower than the indices measured for the Crab pulsar or PSR 1509-58. The low value of the braking index may be due to a pulsar wind (Manchester & Peterson 1989; Nagase et al. 1990). The synchrotron nebula may provide information on the properties of the pulsar wind and it would be of interest if the properties of nebulae surrounding young pulsars could be related to their braking indices. Other possible reasons for the low value of the braking index are distortion of the magnetic field lines (Manchester & Taylor 1977), or a time-varying magnetic field strength (Blandford & Romani 1988). Continued pulse timing of PSR B0540–69 should make it possible to distinguish amongst these alternatives.
3.2 Position
Positions for PSR B0540–69, or its optical counterpart, have been reported by Seward et al. (1984) from X-ray imaging, by Deeter et al. (1999) from X-ray and optical timing, by Caraveo et al. (1992) and Schmidtke et al. (1999) from optical imaging, and by Shearer et al. (1994) from time-resolved optical imaging. Our position is in good agreement with those of Schmidtke et al. (1999) and Shearer et al. (1994) and marginally consistent with that of Caraveo et al. (1992). The results of Shearer et al. (1994) indicate that the pulsar may be slightly displaced from the maximum in the steady optical emission identified with the pulsar by Caraveo et al. (1992) in a direction which would improve the agreement with our position measurement. Our HRC position for PSR B0540–69 lies 2.6″ from the original X-ray position reported by Seward et al. (1984), although within the 90% confidence error box. Our position is from the position derived from X-ray timing measurements with the Ginga satellite by Deeter et al. (1999). Interestingly, the Deeter et al. (1999) position agrees very well with the other positions determinations in declination, but is significantly displaced from all the other positions in R.A. The location of PSR B0540–69 less than from the ecliptic pole may lessen the accuracy of the determination of its R.A. from pulse timing.
Because a shift of 2.6″ in source position will induce an annual sinusoidal variation in the barycentric pulse arrival times with an amplitude of several milliseconds, an accurate position is critical when performing a pulse time of arrival (TOA) analysis. Most timing studies of PSR B0540–69 have used the original X-ray position and should be reconsidered in light of the more accurate position reported here. In particular, the previous position uncertainty may have contributed to the disparate range of braking indices found for PSR B0540–69. Also, the decreased uncertainty in the position may improve the evidence presented for the detection of timing noise in PSR B0540–69 (Eikenberry, Fazio, & Ransom 1998).
3.3 Nebula
We found a displacement between the centroid of the total x-ray emission near PSR B0540–69 and the pulsar itself. This relative displacement is significant and represents a physical offset between the pulsar and the peak x-ray emission in the nebula similar to the offset seen in the Crab nebula versus pulsar.
The difference image, which isolates the presumably point-like pulsar emission, provides an indication of the point-spread function for a point source including the finite resolution of the HRMA and HRC, the effects of the aspect errors, and the focusing error described above. Comparison of the difference image and the “pulsar-off” image, which highlights the nebular emission by reducing – but not fully eliminating – the pulsar emission, shows that the nebula is spatially extended and has a centroid which is slightly WSW from the pulsar, see Fig. 1 in which the dotted contours represent the difference image and the solid contours represent the “pulsar-off” image.
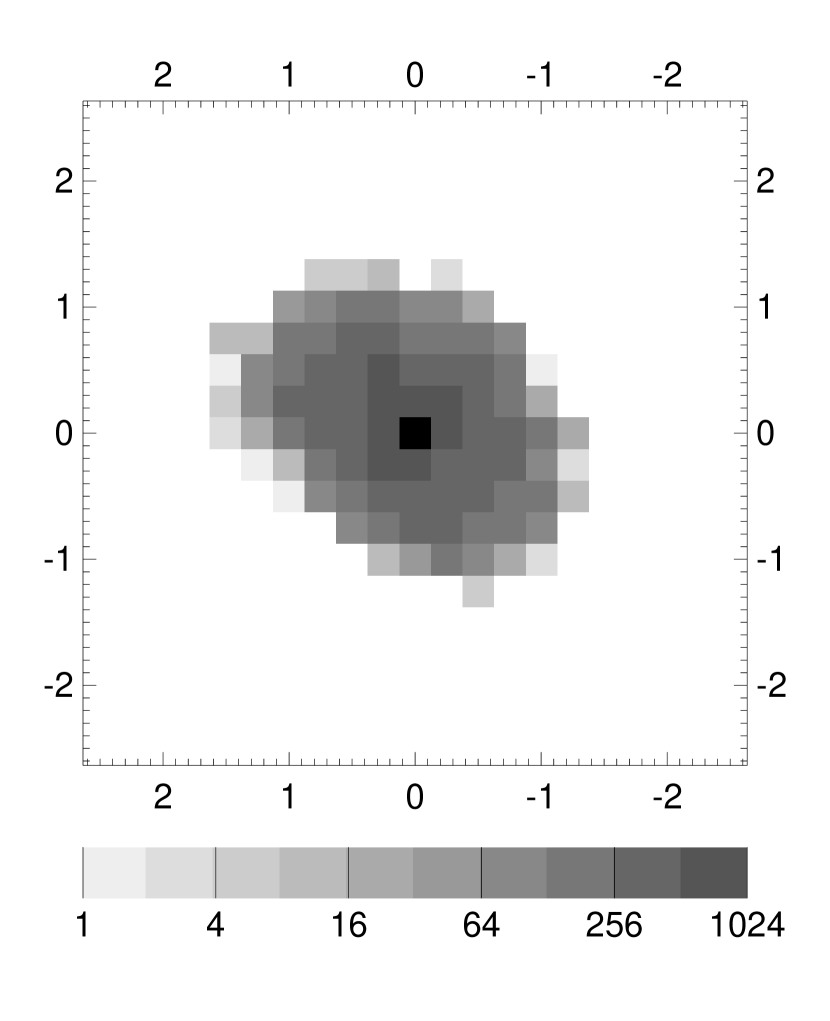
To estimate the true extent of the nebula, we performed an image deconvolution using the difference image described above to represent the telescope point-spread function including the effects of aspect errors and defocusing. We deconvolved an HRC image binned to 0.26″ resolution using the standard Richardson-Lucy technique (Richardson 1972; Lucy 1974). Application of the deconvolution and also the event screening described above is essential to determine the true angular extent of the nebula. The resultant deconvolved image in shown in Fig. 5. The nebula has an angular diameter of and is more extended along a NE-SW axis.
Gotthelf & Wang found the same orientation for the compact nebula, but a larger size. Their results are consistent with our un-deconvolved contour plot in Fig. 1. The deconvolution gives a better estimate of the true angular extent of the nebula. Gotthelf & Wang (2000) also report marginal evidence for a “jet-like feature” extending to the NW from the pulsar. A similar weak feature is present in our data. However, the feature is present in the “pulsar-on” and difference images, but is significantly weaker in the “pulsar-off” image. Caution is required before interpreting this as a physical feature and another observation, with a different roll-angle, would be required for confirmation.
The total HRC count rate from the nebula and pulsar within a radius is 0.84 counts s-1. Assuming a power-law spectral model with a photon spectral index of 2.0 and an interstellar absorption column density (see the spectral fitting below) gives an unabsorbed flux of in the 0.2–10 keV band.
3.4 Pulsed emission
The HRC count rate within of the pulsar is 0.38 counts s-1 with 41% of the signal pulsed. For a narrower radius of 0.6″, the pulsed fraction increases to 55%; however, some of the pulsed emission is lost due to the large PSF during the HRC observation. We note that the measured pulse fraction is sensitive to the shape of the pulse near the maximum and minimum, which may be affected by the 3–4 ms timing error in the HRC. Thus, the true pulsed fraction may be somewhat higher than this value.
This pulsed fraction is significantly higher than previously reported, e.g. from ROSAT (Finley et al. 1993), because Chandra can resolve the surrounding compact nebula. Using a power-law spectral model with a photon spectral index of 1.83 and a column density (see the spectral fitting below) gives an unabsorbed pulsed flux of in the 0.2–10 keV band. The off-phase deconvolution (not shown here) shows only a weak point source at the pulsar position, indicating that, like the Crab Pulsar, any steady emission from the pulsar itself is small compared with the pulsed component.

The ACIS pulse profile for photons within of the pulsar position is shown in Fig. 6. The ACIS cc-mode data suffer from a significant nebular contamination of the pulsar signal due to the integration of counts along the readout direction. Using the analysis of the position profile described above, we estimate the nebular contribution to be 570 counts per phase bin, leading to a pulse fraction of . This estimate is consistent with that found from the HRC data. Fig. 6 also shows the pulse profile for photons with energies above 4 keV and below 1.5 keV. The modulation increases with energy indicating that the pulsed emission is harder than the unpulsed or nebular emission. The pulsed fraction, even below 1.5 keV, is significantly higher than reported from Rosat (Finley et al. 1993) or BeppoSAX (Mineo et al. 1999) due to nebular contamination in the previous results.
| Index | Flux | ||
|---|---|---|---|
| Pulsar all | 1.920.11 | 1.780.05 | 0.99 |
| Pulsar “off” | 2.090.14 | 0.210.08 | 0.60 |
| Pulsar “on” | 1.880.11 | 0.740.04 | 0.75 |
| Pulsed | 1.830.13 | 0.530.06 | 0.75 |
| Nebula (left) | 1.960.11 | 0.980.01 | 1.14 |
| Nebula (right) | 2.120.14 | 0.490.01 | 0.63 |
Note. — This Table contains the photon index from the power-law spectral fit, the absorbed flux in the 0.6-10 keV band in units of , and the of the spectral fit. The errors are 90% confidence.
3.5 Spectra
We accumulated ACIS spectra from the pulsar, two regions surrounding the pulsar where the compact nebula is prominent, and the outer region where the outer remnant dominates. These spectra were analyzed using the response matrices described above. In this section, we quote x-ray fluxes for the energy band 0.6–10 keV and errors for 90% confidence unless otherwise noted.
3.5.1 Pulsar spectrum
For the pulsar emission we selected events within 0.7″ of the peak position in Fig. 2. The background subtracted source rate was 1.49 cts/s. Pile-up here is negligible because of the small clocking time in cc-mode. We used this overall spectrum to determine the proper detector response matrix for the analysis. Since we ignore energies below 1.2 keV, we are less able to constrain the column density, , in our fits. In order to fit all spectra equally well, it was best to fix . The overall spectrum (see Table 2) is well represented by a power law of index . Both and the photon index are in good agreement with the values found by Finley et al. (1993) with the Rosat PSPC and by Mineo et al. (1999) with BeppoSAX.
In order to measure the spectrum of the pulsed emission alone, we have to subtract the background imposed by the emission of the nebula. This can be done by making use of the pulse phase resolved components. We accumulated spectra at pulse phases 0.6–0.8 when the pulsed emission is at a minimum, the “pulsar-off” spectrum, and at pulse phases 0.1–0.3 when the pulsed emission is maximum, the “pulsar-on” spectrum. We subtracted the “pulsar-off” spectrum from the “pulsar-on”spectrum to produce the pulsed emission spectrum. Table 2 shows the result of the spectral fits. The “pulsar-off” spectrum has a somewhat softer spectrum than the “pulsar-on” spectrum. The pulsed emission spectrum shows an even harder spectral index of . The total absorbed pulsed flux can be calculated by integrating the emission above the lowest pulse phase. If we consider the flux level at phase 0.7 as the unpulsed flux level, we find a pulsed flux of . This corresponds to an unabsorbed flux of in the 0.2–10 keV band, and is in good agreement with the HRC result above. Both the pulsed flux and the photon index of the pulsed emission are in good agreement with previous results from Rosat (Finley et al. 1993) and BeppoSAX (Mineo et al. (1999).
| Crab | 0540–69 | |
|---|---|---|
| Pulsar Ė (erg s-1) | ||
| Total | ||
| Compact nebula | ||
| Pulsed | ||
| Nebula size (pc) | ||
| Pulsar offset (pc) | 0.25 | 0.09 |
| Braking index | 2.51 | 2.08 |
Note. — X-ray luminosities, , are quoted in erg s-1 for the 0.2–10 keV band.
3.5.2 Nebula spectrum
Fig. 2 shows the pulsar flanked by the emission from the nebula. We accumulated spectra on both sides of the pulsar, from to (left) and to (right) and fitted both spectra with a power law. The flux from the nebula is similar to that from the pulsar and thus the spectral parameters are similarly constrained. Here the fitted column density is somewhat lower, which again is a systematic effect of the low energy response below 1 keV, which now covers a somewhat larger region on the device. The spectral index of the nebula, when fixing to the value used for the pulsar, is slightly steeper than that of the pulsar, see Table 2. The total absorbed flux in the two flanks amounts to . The pulsar flux at low phase may also be associated with the nebula, which for the whole cycle amounts to . Thus, the total absorbed flux for the compact nebula amounts to . The corresponding total nebular unabsorbed flux is in the 0.2–10 keV band. This is good agreement with the unabsorbed flux inferred from the HRC measurement.
3.5.3 Outer remnant spectrum
Figure 2 shows that the pulsar and it’s compact nebula sits on top of some very extended excess emission, the outer supernova remnant (Seward & Harnden 1994). We accumulated a spectrum of this excess emission, in the region between and , and it turned out to be extremely soft, i.e. the bulk of the emission is found to be below 2 keV at a flux of approximately . The current status of the ACIS response of front illuminated devices does not allow us to do spectral fits in this area yet, but there are line features evident in the range between 0.7 and 1.8 keV and an overall resemblance to the spectrum observed in E0102-72 (Hayashi et al. 1994; Gaetz et al. 2000).
4 Conclusion
Study of PSR B0540–69 with its compact nebula, and comparison of its properties with those of the Crab and other young pulsars, should provide insights into the physical mechanisms for energy release in spin-powered pulsars including the dynamics of the pulsar outflow. In Table 3, we compare the properties of PSR B0540–69 with those of the Crab, assuming a distance to PSR B0540–69 of 55 kpc.
The fraction of the total spin-down power in x-ray emission from the compact nebula and pulsar is 14% for PSR B0540–69 and half that for the Crab. The pulsed fraction of the total (pulsar plus compact nebula) flux is 20% for PSR B0540–69 compared to only 4% for the Crab. In addition, the pulse shapes are quite different with the Crab showing a narrow pulse while PSR B0540–69 has a broad, almost sinusoidal, pulse.
PSR B0540–69 has lower spin-down power and the surrounding nebula is less luminous. As a general rule (Seward & Wang 1985), the nebular luminosity varies with the pulsar spin-down power, Ė, approximately as ; the Chandra data are in rough agreement. The nebular volume for PSR B0540–69 is also considerably less than that of the Crab, although it is difficult to precisely define a “size” (the average FWHM is 0.5 pc and the average FW at background is 0.7 pc. The FW at background is given in Table 3). Since the nebula surrounding the pulsar is most likely due to synchrotron emission and energized by the pulsar, the smaller nebula likely reflects the lower spin-down power. However, the properties of the nebula may also depend on the surrounding environment and the past history of the pulsar.
The properties of the surrounding environment and also of the progenitor may be important in determining the nature of the outer remnant. In PSR B0540–69, we detect thermal x-ray emission from a surrounding remnant. This is in strong contrast with the Crab pulsar, where no such remnant exists. The spectrum of the outer remnant of PSR B0540–69 appears to be line driven and thus more of the category we see in young oxygen-rich supernova remnants of the Magellanic Clouds (Blair et al. 1999, Gaetz et al. 2000).
PSR B0540–69 and its surrounding nebula are a remarkable parallel with the Crab Pulsar and its environment. It is almost certain that the same physical processes operate in both systems. However, further comparison shows several distinct differences between the two systems, as revealed by the observations described above. Additional Chandra observations would allow us to study PSR B0540–69 in detail; making it possible to search for spectral structure in the synchrotron nebula, as has recently been detected from the Crab (Weisskopf et al. 2000). Confrontation of detailed models of the pulsar x-ray emission mechanism, pulsar wind, synchrotron nebula, and the outer supernova remnant with these observations should help advance our understanding of spin-powered pulsars, their outflows, and the nature of their progenitors.
References
- (1)
- (2)
- (3) Aldcroft, T.L. et al. 2000, Proc. SPIE, to appear
- (4)
- (5) Bautz, M.W. et al. 1998, Proc. SPIE, 3444, 210
- (6)
- (7) Blandford, R.D. & Romani, R.W. 1988, MNRAS, 234, 57
- (8)
- (9) Buccheri, R., Oel, M.E., & Sacco, B. 1987, A&A, 175, 353
- (10)
- (11) Boyd, P.T. et al. 1995, ApJ, 448, 365
- (12)
- (13) Caraveo, P.A., Bignami, G.F., Mereghetti, S., & Mombelli, M. 1992, ApJ, 395, L103
- (14)
- (15) Chanan, G.A., Helfand, D.J., & Reynolds, S.P. 1984, ApJ, 287, L23
- (16)
- (17) Chanan, G.A. & Helfand, D.J. 1990, ApJ, 352, 167
- (18)
- (19) Deeter, J.E., Nagase, F., & Boynton, P.E. 1999, ApJ, 512, 300
- (20)
-
(21)
Dobrzycki, A. 2000, “Caveats Regarding Products
in the Chandra Data Archive – HRC”,
http://asc.harvard.edu/cda/caveats.html - (22)
- (23) Eikenberry, S.S., Fazio, G.G. & Ransom, S.M. 1998, ApJ, 492, 754
- (24)
- (25) Finley, J.P. et al. 1993, ApJ, 410, 323
- (26)
- (27) Gaetz, T.J., Butt Y.M., Edgar R., Eriksen K.,Plucinsky P., Schlegel E., & Smith R.K. 2000, ApJ, to appear, astro-ph/0003355
- (28)
- (29) Gotthelf, E.V. & Wang, Q.D. 2000, ApJ, 532, L117
- (30)
- (31) Hayashi, I., Koyama, K., Ozaki, M., Miyata, E., Tsunami, H., Hughes, J.P., & Petre, R. 1994, PASJ, 46, L121
- (32)
- (33) Jerius, D. et al. 2000, Proc. SPIE, to appear
- (34)
- (35) Lucy, L. B., 1974, AJ, 79, 745
- (36)
- (37) Manchester, R.N. & Taylor, J.H. 1977, Pulsars (San Francisco: Freeman)
- (38)
- (39) Manchester, R.N. & Peterson, B.A. 1989, ApJ, 342, L23
- (40)
- (41) Mineo, T. et al. 1999, A&A, 348, 519
- (42)
- (43) Murray, S.S. et al. 1997, Proc. SPIE, 3114, 11
- (44)
- (45) Murray, S.S. et al. 2000, Proc. SPIE, to appear
- (46)
- (47) Nagase, F. et al. 1990, ApJ, 351, L13
- (48)
- (49) Richardson, W. H., 1972, J. Opt. Soc. Am., 62, 55
- (50)
- (51) Schmidtke, P.C. et al. 1999, AJ, 117, 927
- (52)
- (53) Seward, F.D., Harnden, F.R. Jr., & Helfand, D.J. 1984, ApJ, 287, L19
- (54)
- (55) Seward, F.D. & Wang, Z.R. 1988, ApJ, 332, 199
- (56)
- (57) Seward, F.D., & Harnden, F.R. Jr. 1994, ApJ, 421, 581
- (58)
-
(59)
Seward, F.D. 2000, “HRC Timing Error”,
http://asc.harvard.edu/udocs/hrc/timing.html - (60)
- (61) Shearer, A. et al. 1999, ApJ, 423, L51
- (62)
- (63) van Speybroeck, L.P. et al. 1997, Proc. SPIE, 3113, 89
- (64)
- (65) Weisskopf, M.C. 1988, Space Science Reviews, 47, 47
- (66)