High redshift radio galaxies:
Beacons to biased hierarchical galaxy
formation within large scale structure
Abstract
We summarize observations of the properties of powerful radio galaxies and their environments from . These data show that some high redshift radio galaxies inhabit regions of gas and galaxy over-densities indicative of proto-cluster environments.
NRAO
Leiden
SAO
MPIfR
LLNL
1. Some History
Prior to the mid-1990’s, the only high redshift galaxies known were the parent galaxies of powerful radio sources. Starting with Cygnus A at in the 1950’s, and moving to 3C 295 at in the 1960’s, then making the jump to 4C 41.17 at in the 1980’s, powerful radio galaxies were, by far, the highest redshift galaxies known. As such, radio galaxies have provided a unique, although admittedly biased, view of primeval galaxies and galaxy evolution (McCarthy 1993). The last few years has seen the discovery of populations of ‘normal’ galaxies at high redshift, including optically selected UV-dropout galaxies, and submm selected dusty starburst galaxies (Steidel et al. 1998, Hughes et al. 1998). At first glance, these discoveries apparently diminish the importance of high redshift radio galaxies in the general study of primeval galaxies. More correctly, we feel these discoveries have placed radio galaxies in their proper context among high-z galaxy populations. High redshift radio galaxies remain the most (optically) luminous of the known high-z galaxies, and they have extended, high surface brightness line and continuum emission from radio through X-ray wavelengths. Likewise, low frequency radio surveys provide large, relatively unbiased samples. Hence, powerful radio galaxies are still the most easily and best studied of the high-z galaxy populations, and extensive observations across the electromagnetic spectrum have provided information that is fundamental to our understanding of galaxy and large scale structure formation.
While most authors agree that the parent galaxies for luminous Fanaroff-Riley Class II radio galaxies (P 1035 h-2 erg s-1 Hz-1)111h . We use Ho = 50 km s-1 Mpc-1 and qo = 0.5, unless stated otherwise., are giant elliptical galaxies, at least to , there has been debate in the recent literature concerning the evolution of the cluster environments of powerful radio galaxies from to . Hill and Lilly (1991) concluded that there is substantial evolution in the environments of powerful radio galaxies over this redshift range, from small groups at low-z, to Abell class 0 to 1 clusters at . The recent study by Best (2000) of intermediate-z 3C sources seems to support this conclusion, and he uses this fact to argue that intermediate-z radio galaxies cannot be the precusors of the lower redshift sources. McLure and Dunlop (2000) have recently challenged these findings. They find low redshift luminous AGN, both radio loud and radio quiet, typically inhabit Abell class 0 clusters, and hence that the mean environment for powerful radio galaxies doesn’t change dramatically from . They claim that: ‘powerful AGN do not avoid rich clusters, but rather display a spread in cluster environment which is consistent with being drawn at random from the massive elliptical galaxy population.’ They make the point that the co-moving space density of clusters at low redshift, h3 Mpc-3, is comparable to that of powerful AGN at , with the interesting implication that all cluster dominant elliptical galaxies were active at (West 1994).
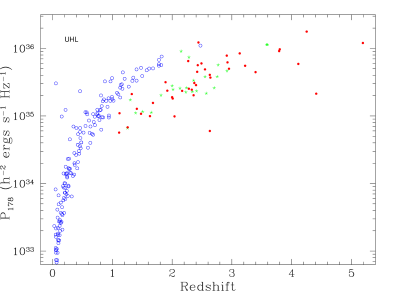
The study of the low-to-intermediate redshift evolution of luminous radio galaxies is ham-strung by the paucity of such sources at low-z. Figure 1 shows rest-frame P178MHz versus redshift for a number of samples of radio galaxies. The 3C samples shows the clear Malmquist bias inherent in flux limited samples. Subsequent studies of lower flux density sources have filled-in the distribution at higher redshifts by revealing lower-luminosity sources. However, there is a clear lack of high-power sources at . This is simply a consequence of our universe, and cannot be overcome with larger samples.
2. The Leiden Sample
Through pain-staking optical identification of sources from low frequency radio samples, a number of groups, most notably those at Leiden, Oxford, and Berkeley, have expanded the size and redshift range over which radio galaxies have been detected. The current record is (van Breugel et al. 1999a), and there are 150 sources known at . Many authors have called attention to the interesting parallel between the rapid increase with redshift in the space density of powerful radio galaxies and other luminous AGN, with that of the cosmic star formation rate. Both show more than an order of magnitude increase in co-moving space density from to 2 (Dunlop et al. 2000, Boyle and Terlevich 1998, Blain et al. 1999).
| Radio | 100 kpc, classical doubles | 10 kpc, irregular |
| mm to IR | nuclear emission | distributed sources |
| L L⊙ | L L⊙ | |
| Near IR | giant ellipticals, old stars | multiple knots |
| tight relation | weaker relation | |
| Blue | highly aligned with radio | aligned with radio plus |
| off-axis knots | ||
| polarized | polarized | |
| stellar absorption lines | ||
| Ly- halos | 10 kpc, 108 M⊙ | 100 kpc, 109 M⊙ |
| Ly- self-absorption | ||
| Cluster | Abell class 0 to 1 | proto-clusters? |
| X-ray atmospheres | irregular X-rays |
Table 1 gives a broad-brush summary of the properties of powerful radio galaxies at compared with those at . While all of the statements are defensible, some are based on observations of just a few sources (or even one!), and remain to be verified.
In the near-IR, the host galaxies change from well defined giant elliptical galaxies at low-z with a fairly tight relation, to spatially more complex systems at high-z, with a larger scatter in the (van Breugel et al. 1999b). Radio galaxies at also show evidence for old stars, suggesting a formation redshift (Dunlop et al. 2000). The blue light shows a general alignment with the radio source axis at all redshifts, but high redshift sources also show blue knots of emission well away from the radio source axis. Also, at low-z the blue emission is typically highly polarized, while at high-z the emission is less polarized, or even unpolarized, and one source shows stellar absorption features (Dey et al. 1997). The implication is that at low-z the blue emission is dominated by scattered light from the obscured nucleus, while at high-z star forming regions make a significant contribution. Diffuse Ly- emission is seen at both low and high-z, but the Ly- halos are typically larger, and more luminous at high-z (Baum and McCarthy 2000). Self-absorption of the Ly- emission is also more prevalent in high redshift sources, indicating large amounts of cooler HI (van Ojik et al. 1997, Debreuck et al. 2000).
The radio source morphologies change from small, irregular systems at high-z to large classical doubles at low-z. Extreme values of Faraday rotation of the polarized radio emission are observed at both low-z and high-z. Pentericci (1999) has argued that the fraction of sources with large rotation measures (RMs) increases with redshift. The origin of large RMs in low-z systems is thought to be magnetized cluster atmospheres, with fields G ordered on scales of 10’s of kpc. The location of the Faraday screen in high-z sources remains an open question.
3. Dust emission
Powerful radio galaxies at low-z typically have IR luminosities L⊙ year-1, some of which can be ascribed to synchrotron radiation from the AGN (Golombek et al. 1988). High-z radio galaxies show dramatically different behavior in the rest-frame IR.
Archibald et al. (1999) have shown a rapid evolution with redshift in the rest-frame IR luminosity of radio galaxies, with the median value increasing as to L⊙ year-1 at . The spectral energy distributions show that the emission is from warm dust, with implied dust masses M⊙, and dust temperatures between 50 and 100 K (Benford et al. 2000). Emission from CO has also been detected from a few high-z radio galaxies, with implied gas masses M⊙ (Papadopoulos et al. 2000).
Perhaps more importantly, imaging at submm and mm wavelengths has shown that the peak of the dust and CO emission is often not centered on the AGN, but can arise in sources distributed at distances of 1′ or more from the AGN. The most dramatic example of this is 4C 41.17 at recently imaged with SCUBA at 850m by Ivison et al. (2000). They detect six luminous dust emitting sources in an area of about 4 square arcmin centered on the radio galaxy, including emission from the AGN itself. Interestingly, the brightest dust emitting source is located at a distance of 1′ from the AGN. This represents an order-of-magnitude over-density of submm sources relative to the field.
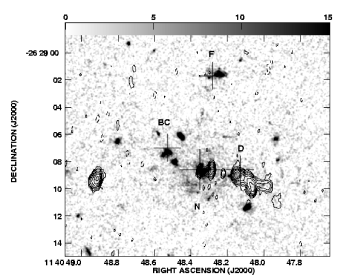
A somewhat less dramatic, but equally telling, example of this phenomenon is shown in Figure 2. Dust emission has been detected from the radio galaxy PKS 1138–262 at 240 GHz using MAMBO (Kreysa et al. 1999) at the IRAM 30m telescope. A series of pointed and imaging observations shows that the dust emission may not peak at the position of the AGN, but peaks about 4′′ to the north-east of the AGN, at the location of a complex of Ly- emitting knots designated BC in Figure 2. The implied star formation rate for this complex, based on the mm emission, is a few hundred M⊙ year-1. This is two orders-of-magnitude greater than the star formation rate predicted from the rest-frame UV luminosity (Pentericci et al. 1998), and is characteristic of the recently discovered dust obscured, high-z starburst galaxy population (Rowan-Robinson 1999).
4. A proto-cluster around PKS 1138–262
The radio galaxy PKS 1138–262 was chosen as the target of a pilot project to search for galaxy over-densities around high redshift radio galaxies for a number of reasons: (i) its extremely clumpy optical morphology and large size that resembles simulations of forming massive cluster galaxies (Pentericci et al. 1998), (ii) its extreme RM and distorted radio morphology indicating dense local gas (Carilli et al. 1997), and (iii) detection of extended X-ray emission (Carilli et al. 1998).
Narrow band imaging with the VLT revealed 50 candidate Ly- emitting galaxies within a field centered on PKS1138–262 and in the redshift range of 2.1370.037 (Kurk et al. 2000), not including the 10 previously known Ly- emitting knots within 8′′ of the radio galaxy itself (Pentericci et al 2000). Follow-up spectroscopy of 43 candidates showed 15 of the sources in the range z = 2.1550.016. There is no obvious angular sub-structure in the distribution of the Ly- emitting sources, but there is clear redshift sub-structure, with about half the sources being at , and the other half at . The velocity dispersion of each sub-group is about 400 km s-1, implying a virial mass of M⊙ for each group.
The over-density of galaxies in the 1138–262 field is comparable to that seen by Steidel et al. (1998) in their UV-dropout selected proto-cluster at (see the analysis in Pentericci et al. 2000). In terms of large scale structure formation in the context of CDM models with standard cosmologies, Steidel et al. argue that the space density of such structures at high redshift requires either a low value of and/or a large bias parameter, , with for , or for .
5. X-rays from PKS 1138–262
At low-z there is a clear correlation between extreme RM radio galaxies and X-ray emitting cluster atmospheres (Taylor et al. 1994). Based on this correlation, we have begun a search for extended X-ray emission from high-z radio galaxies with extreme RM values. Our pilot study has targeted PKS 1138-262. A long exposure with ROSAT HRI detected X-ray emission from PKS 1138–262 with a rest frame 2 to 10 keV luminosity of erg s-1, comparable to that of a M⊙ cluster atmosphere. Unfortunately, the spatial resolution of ROSAT was insufficient to determine the spatial distribution of the X-ray emission, at least on scales comparable to that expected for high surface brightness cluster core emission kpc.
Figure 3 shows the X-ray emission from 1138–262 as seen in a 40 ksec exposure with Chandra. The total X-ray emission (0.2 to 10 keV) shows a point source at the position of the AGN, plus extended emission on a scale of about 20′′. The extended X-ray emission has a softer spectrum than the point source, contributing about 10 of the total luminosity in the 0.2 to 10 keV band, and 25 in the 0.2 to 1 keV band.
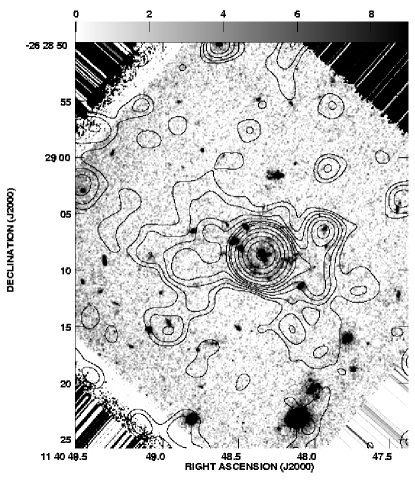
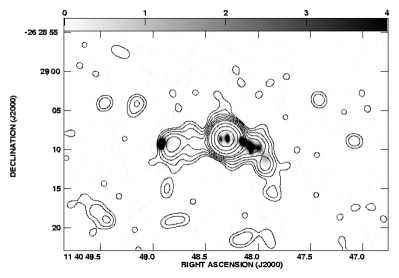
The soft X-ray emission (0.2 to 1 keV) shows a general correlation with the radio source in both extent and orientation. However, the correspondence is not exact in terms of individual high surface brightness features, most notably, the eastern radio hot spot is situated about 2′′ further from the nucleus than the local peak in the X-ray emission. Also, the X-ray emission has a broader (transverse) distribution than the radio emission. Note that the relative astrometry is only accurate to about 2′′. However, shifting the images in order to line-up the eastern hot spot would then move the X-ray nucleus and western extension away from the corresponding radio structures. Our analysis of the X-ray emission from 1138–262 has just begun, so the following conclusions are very tentative.
We feel it unlikely that the X-ray emission is synchrotron radiation, given the lack of a one-to-one correspondence with radio features, and the fact that extrapolating the radio spectrum to the X-ray under-predicts the X-ray flux density by more than an order of magnitude. Inverse Compton emission is also unlikely, for similar spatial reasons, and the derived magnetic field is an order of magnitude below the equipartition value. The one caveat is that, if the radio source morphology is significantly different at low radio frequencies relative to the high (rest-frame) frequencies observed thus far, then inverse Compton emission might become a viable option.
One possible explanation is thermal emission from hot gas, which would be consistent with the large RMs observed. The broad-band spectrum is consistent with gas at 5 to 10 keV, although the spectrum varies with position. The correlation with the radio source axis would then suggest gas heated by shocks driven by the expanding radio source. In this case, the lack of emission from a virialized cluster atmosphere might indicate that the ambient medium was at a relatively low temperature ( 1 keV) prior to the on-set of the radio jet. The observation of stronger Ly- emission, and more prevalent Ly- absorption, in high redshift radio galaxies suggests a larger supply of cooler ambient material on scales of 10 to 100 kpc relative to low redshift radio galaxies (van Ojik et al. 1997 Debreuck et al. 2000). We are currently considering the energetics and gas mass involved, to determine if such a model is sensible.
6. High redshift radio galaxies: Beacons to biased hierarchical galaxy formation within large scale structure
Based on the observations presented above, we speculate that high redshift radio galaxies are often beacons to highly biased hierarchical galaxy formation within large scale structure (LSS). The LSS will eventually separate from the Hubble flow and collapse to form a rich cluster at . The individual Ly- and submm-selected galaxies will evolve into cluster spheroidal galaxies, including the giant elliptical AGN host galaxy.
Two question raised during the meeting are worthy of mention. One question by Linda Sparkes concerns the energetics: given the 1045 erg s-1 coming from the radio AGN in these systems, could it be that all observational characteristics are dictated by the AGN? While this could be the case for regions within 50 kpc or so of the AGN, it is clearly not the case for most of the submm and Ly- emitting galaxies distributed at distances of arcminutes from the AGN, and, for the most part, not along the radio axis. Also, the implied IR luminosities for the spatially distributed submm sources are comparable to, or larger than, the integrated luminosity of the radio galaxy. Hence, while the extended radio source may appear dramatic on high quality radio images, the bolometric luminosity of the ‘cluster’ as a whole may not be dominated by the radio galaxy. This raises the interesting possibility that the host galaxies of high redshift radio sources may not be pre-ordained dominant cluster galaxies in all cases, but could become normal cluster ellipticals, thereby alleviating the necessity for all cluster dominant galaxies to host AGN at (McClure and Dunlop 2000).
The second question by James Binney concerns timescales. There is a clear correlation with radio source size and redshift, with the median source size dropping from 100 kpc at low-z to 10 kpc at (Carilli et al. 1998). The most recent analysis of this phenomenon suggests that it is due to a correlation between radio source size, age, and luminosity: smaller sources are younger and more luminous (Blundell et al. 1999). As with the energtics discussed above, this age discrimination cannot dictate the characteristics of the submm and Ly- sources distributed throughout the (proto-) cluster. Also, timescales for the radio activity are typically 106 to years, while those for the star forming galaxies are likely to be an order of magnitude longer.
While high-z radio galaxies are identified via their radio properties, ie. steep spectrum radio sources, current data indicate that powerful radio galaxies and their environments represent ideal laboratories to study the general phenomena of galaxy and large scale structure formation over the widest possible range in redshifts. In essence, the radio source acts like a bolt of lightening illuminating a storm – a dramatic, short timescale event that draws attention to a larger, even more dramatic phenomenon, namely the formation of a cluster of galaxies.
Acknowledgments.
The National Radio Astronomy Observatory (NRAO) is a facility of the National Science Foundation, operated under cooperative agreement by Associated Universities, Inc.. We thank Carlos Debreuck for his tireless work on the identifications and spectroscopic redshift measurements of many of the high redshift radio galaxies plotted in Figure 1. The work by W.v.B. at the University of California Lawrence Livermore National Laboratory was performed under the auspices of the US Department of Energy under contract W-7405-ENG-48.
References
Archibald, E.N. et al. 2000, MNRAS, in press
Baum, S. and McCarthy, P. 2000, AJ, in press
Best, P.N. 2000, MNRAS, in press
Benford, D. et al. 2000, ApJ, 518, 65
Blain, A.W. et al. 1999, MNRAS, 309, 705
Blundell, K.M. and Rawlings, S. 1999, Nature, 339, 330
Boyle, B.J. and Terlevich, R.J. 1998, MNRAS, 293, L49
van Breugel, W. et al. 1999a, in ’The Most Distant Radio Galaxies,’ eds. Rottgering, Best, and Lehnert (KNAW: Amsterdam), p. 49
van Breugel, W. et al. 1999b, ApJ, 518, L61
Carilli, C.L. et al. 1997, ApJ(supp), 109, 1
Carilli, C.L. et al. 1998, ApJ, 496, L57
Debreuck, C. et al. 2000, ApJ, in press
Dey, A. et al. 1997, ApJ, 490, 698
Dunlop, J.S. et al. 2000, MNRAS, in press
Golombek, D., Miley, G.K., and Neugebauer, G. 1988, 95, 26
Hill, G.J. and Lilly, S.J. 1991, ApJ, 367, 1
Hughes, D. et al. 1998, Nature, 394, 241
Ivison, R.J., et al. 2000, ApJ, in press
Kreysa, E. et al. 1999, SPIE, 3357, 319
Kurk, J. et al. 2000, å, 358, L1
McCarthy, P. 1993, ARA&A, 31, 639
McClure, R.J. and Dunlop, J.S. 2000, MNRAS, in press
van Ojik, R. et al. 1997, å, 317, 358
Papadopoulos, P. et al. 2000, ApJ, 528, 626
Pentericci, L. et al. 2000, å(letters), in press
Pentericci, L. et al. 1998, ApJ, 504, 139
Rowan-Robinson, M. 2000, MNRAS, in press
Steidel, C.C. et al. 1998, ApJ, 492, 428
Taylor, G.B., Barton, E. and Ge, J.-P. 1994, AJ, 107, 1942
West, M. 1994, MNRAS, 268, 79