Damped Lyman systems at and towards HE 11221649 and HE 05154414 ††thanks: Based on observations performed at ESO/La Silla, on observations with the NASA/ESA Hubble Space Telescope and on observations at Keck Observatory.
Abstract
Detailed analysis of the spectral lines from two low redshift damped Lyman alpha absorbers (DLA) confirms that they are a heterogeneous population. Both systems have low metal abundances of approximately 0.05 to 0.1 solar. The abundance pattern of the DLA at towards HE 0515-4414 shows dust depletion comparable to that found in our Galaxy, while the system at towards HE 1122-1649 shows abundance ratios resembling metal-poor halo stars with no dust depletion, for a comparable H i column. Constraints for N/Fe and N/Si also hint at DLA as a galaxy with recent star formation. The trend of increasing C i /H i with decreasing is discussed. Only weak absorption from highly-ionized species associated with the DLA at moderate have been detected and it probably originates in regions distinct from the low ionization gas. The low-ion profiles show very complex structures and are too large to be explained by the rotation of a disk: the system at spans over 300 km s-1 and the DLA presents substructure over more than 700 km s-1 , the largest velocity extent found up to date for a DLA.
Key Words.:
Quasars: absorption lines – Quasars: individual: HE 11221649, HE 05154414 Galaxies: abundances – Galaxies: evolution – Galaxies: ISM – Cosmology: observations1 Introduction
Damped Lyman absorbers (DLA) are the population of quasar absorption systems showing the highest neutral hydrogen column density ((H i ) cm-2). At high redshift they contain the bulk of the cosmological mass of neutral gas in the Universe and are believed to be progenitors of current galaxies (e.g. Wolfe et al. 1986), although their nature and properties still remain unclear. They provide information about the chemical enrichment history of galaxies which can be contrasted with the studies of stellar populations in the local galaxies. Several samples of DLA at have been studied thoroughly (e.g Pettini et al. 1990, Lu et al. 1996, Pettini et al. 1997a,b) but very few systems are known at intermediate or low redshift (Pettini & Bowen 1997, and references therein; Boissé. et al. 1998, de la Varga & Reimers 1998, Pettini et al. 1999a,b). To interpret the high- data correctly, it is essential to follow the evolution of the DLA population to the present time. Moreover, at low it is possible to search for luminous counterparts via imaging (e.g. Le Brun et al. 1997, Steidel et al. 1994, 1995, 1997, Rao & Turnshek 1998).
We herein present observations of two DLA, at and , in the line of sight to HE 11221649 and HE 05154414 , respectively. The combination of HST spectra with high resolution spectra (CASPEC and HIRES) allows a detailed study of metal abundances and kinematics at low redshift.
Total metal abundances provide information about the population of absorbers which constitute DLA. Measurements of Zn and Cr show abundances of 1/15 solar, but with a considerable spread (Pettini et al. 1997b). The metallicity is not significantly higher for the few systems found at (Pettini et al. 1999a,b). The underabundance of Cr relative to Zn (Pettini et al. 1997a, 1999a,b) suggests that dust is also present, though the depletion level seems to be lower than in the Galaxy. The same conclusion was drawn from reddening studies of QSOs with and without DLA in their line of sight (e.g. Pei et al. 1991). The interplay between nucleosynthesis and dust depletion from the study of relative abundance patterns in DLA is still unclear (cf. Lu et al. 1996, Prochaska & Wolfe 1996, Pettini et al. 1997b, Kulkarny et al. 1997) and, however, crucial to understand the evolution and chemical enrichment of galaxies.
Studying the kinematics of the absorption line profiles should clarify the nature of DLA and could help to discern among theories of galaxy formation: are DLA related to rotating disks or rather to irregular protogalactic clumps merging, as expected in scenarios of hierarchical cosmogony? (cf. Prochaska & Wolfe 1997a,b,1998, Haehnelt et al. 1998, McDonald & Miralda-Escudé submitted). Comparing profiles at low and high could help to understand whether the asymmetries arise from a mixture of kinematical structures (random motions, rotation, infall, and merging…), or whether a trend can be recognized.
Our paper is organized as follows: in Sect. 2 we describe the observations and the data reduction. The analysis of the absorption lines is discussed in Sect. 3, the metal abundances in Sect. 4, and the relative abundances in Sect. 5. The neutral carbon and molecular content are studied in Sects. 6 and 7, respectively. In Sect. 8 the kinematics of the absorption profiles is considered, and in Sect. 9 we study the highly-ionized gas related to the systems. Finally, concluding remarks are summarized in Sect. 10.
2 Observations and Data Reduction
2.1 HST Spectra
Ultraviolet spectra of HE 11221649 (, V=16.5, Reimers et al. 1995) were obtained with the Faint Object Spectrograph (FOS) onboard the Hubble Space Telescope (HST) in 1995. With gratings G270H and G190H (red digicon and entrance aperture of ), the wavelength range from 1600 to 3280 Å was covered with a maximum signal-to-noise ratio of 28. The spectral resolution is FWHM = 1.4 and 2.0 Å for G190H and G270H, respectively (Schneider et al. 1993). The wavelength calibration of the pipeline reduced data was examined by comparing the overlap region between the G190H and the G270H spectra, and also with the Keck spectra, which have an overlap of 100 Å with the FOS spectra.
The spectra were corrected for interstellar reddening using the Seaton law (Seaton 1979) with , corresponding to (H i ) =4.16 cm-2. The high density of absorption lines complicates the measurement of a local continuum. Regions apparently free of absorption were selected by checking the error in the mean flux for consistency with the noise, and cubic splines were fitted to the mean flux values in those regions.
2.2 Keck HIRES Spectra
Optical data of HE 11221649 were taken with the HIRES spectrograph (Vogt et al. vog94 (1994)) on the W.M. Keck1 10-m telescope with a total of 3 hours exposure in April 1997. The spectral range was from 3150 to 4710 Å with a S/N of 19/35 at 3500/4500 Å. We used a 1.14” x 7.0” slit, which gave a resolution of 8 km s-1 FWHM (R=37500) and adequate sky coverage, and used the UV cross-disperser to increase efficiency at wavelengths below 4200 Å. The images were processed and the spectra were optimally extracted using an automated package specifically designed by T. Barlow for HIRES spectra. Thorium-Argon lamp images were obtained immediately after the observations to provide wavelength calibrations in each echelle order. The root-mean-square residuals in the wavelength calibration for each echelle order were less than 0.3 km s-1 . All wavelengths are vacuum values in the heliocentric frame. Each echelle order was continuum fit with a Legendre polynomial to normalize the intrinsic QSO flux to unity.
2.3 CASPEC Spectra
Further optical spectra were obtained with CASPEC (Long Camera) at the 3.6 m telescope at ESO/La Silla. The data reduction was done with the ECHELLE software program available in MIDAS, supplemented by software programmes for an optimal extraction of the echelle orders developed by S. Lopez. For wavelength calibration purposes, Th-Ar spectra were taken immediately before and after each quasar observation. The uncertainty in the calibration, , is given by the rms residuals after fitting third order polynomials to the lines identified in the arc lamp observations. For all the CASPEC observations we obtain of a resolution element. The wavelength scales were corrected to vacuum-heliocentric values and individual observations rebinned to the same wavelength scale and combined by weighting by the inverse variance. The continuum for each echelle order was determined by iterative cubic spline fitting to regions free of absorption lines.
HE 11221649 :
In the observations of HE 11221649 in 1994, 43 echelle orders covered the wavelength
range from 3750 to 5250 Å. The achieved
resolving power, measured from the emission
lines of the Th-Ar exposures,
was R=17 000, and the signal-to-noise ratio for the combined spectrum
was 34, 43 and 53
at = 4000, 4500 and 5000 Å, respectively.
In 1996, 48 orders covered from 3320 to 4600 Å with S/N of 8/29 at 3500/4500
Å and R=20 000.
HE 05154414 :
We observed HE 05154414 using CASPEC in October 1996
from 3530 to 4830 Å with R=21 500,
and 4865 to 6200 Å with R=24 000. Further observations
in November 1997
provided us with the ranges from 3250 to 4560 Å (R=27 000),
5430 to 7870 Å (R=28 600) and 6140 to 8570 Å (R=29 000). The combined spectrum
covering the spectral range from 3250 to 8570 (with a small gap
between 4830 and 4865 Å)
has a maximum signal-to-noise ratio of .
3 Analysis of the Absorption Lines
Using the FITLYMAN program in the MIDAS package (Fontana & Ballester 1995), the absorption lines were fitted with Voigt profiles convolved with the instrumental profile, simultaneously determining the redshift, column density, values and associated errors, while minimizing a parameter matrix. Line parameters were taken from Morton (1991) and from Verner et al. (1994). Different transitions from the same ion were fitted simultaneously, and different ions and elements were fitted independently. We chose the minimum number of components which gave an adequate fit. Several fits were performed for the same complex by shifting slightly the initial values and testing new sets. The considerable arbitrariness in the choice of components does not seriously affect the total column densities derived for most ions, as the presence of several transitions allow us to discern blends and hidden components –at least in the high resolution spectra– by means of the apparent optical depth method (Savage & Sembach 1991).
3.1 DLA at towards HE 11221649
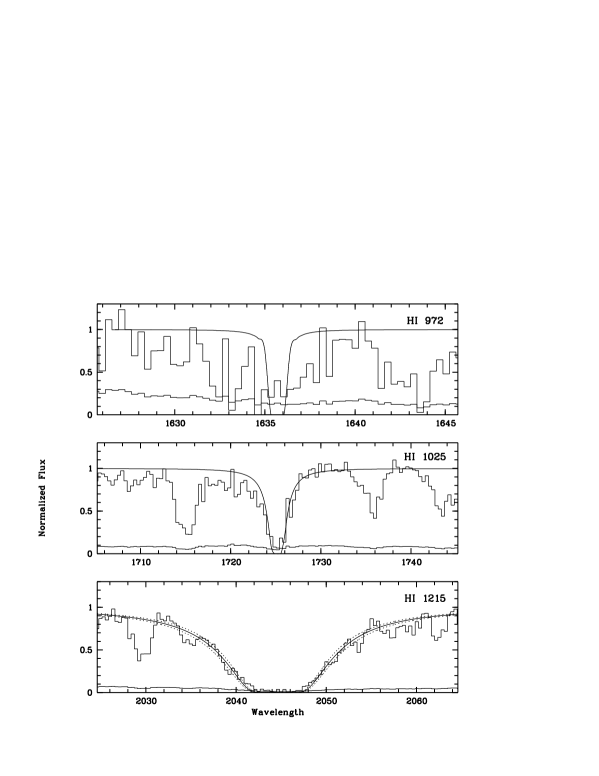
The profile of the damped Lyman is well fitted in the FOS spectrum by a column density of neutral hydrogen of log(H i ) at (Fig. 1). A small correction for scattered light ( % of the continuum) was applied to bring the core of the absorption line to zero flux.
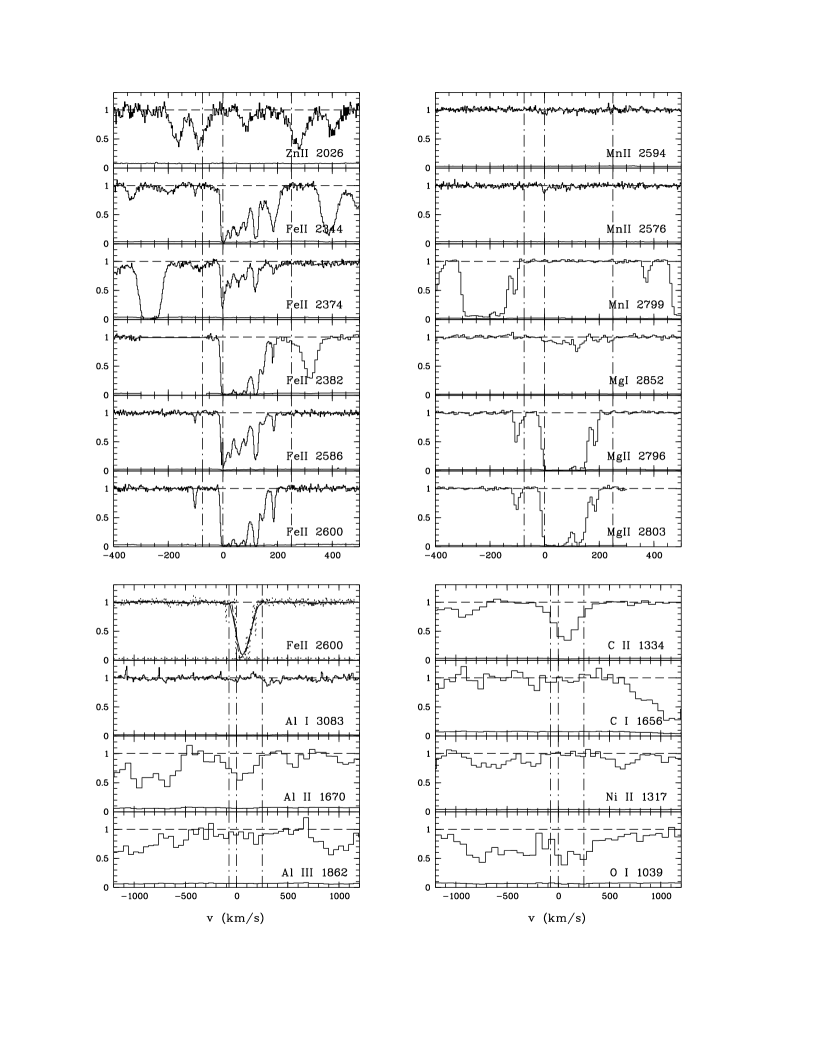
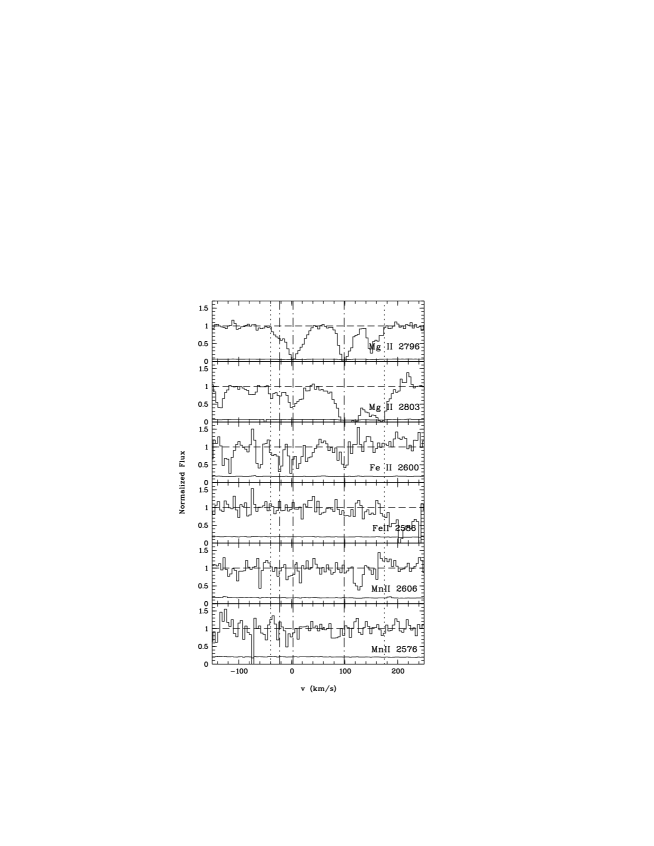
We detect absorption at the expected position of numerous metal lines associated with this system. Table 1 lists the line parameters resulting from the fits, and Fig. 2 and 3 show some of the absorption features in velocity space.
We adopt upper limits for lines which were not detected.
Comparable values resulting from fits of individual components for different ions suggest that turbulent broadening is dominant. Under this assumption, for the cases where blending complicated the fitting, a typical value was adopted as derived from the high resolution spectra for resolved lines. Keck spectra were filtered at the FOS instrumental resolution and new fits of the Fe ii transitions longwards of Ly were performed. We obtain values of the order of km s-1 by fitting the whole complex as a unique absorption feature at the resolution of the G270H spectra, and and 16 km s-1 fitting with two components at the resolution of G190H. Because of the severe blending in the Ly forest, the line fits performed at the limited FOS resolution should be considered upper limits. However, the study on metal abundances will be based on column densities derived from the high resolution spectra.
The numerous Fe ii transitions observed in the Keck spectra allow a reliable estimation of N(Fe) by fitting the strongest components in non-saturated transitions (Fe ii 2260,2374). The best fit for Fe ii requires at least 14 components (13 in the main feature plus the satellite component at km s-1 ).
The non-detection of Zn ii 2026 indicates that logN(Zn) . Several tests that modified the continuum level locally by means of fitting adjacent Ly lines did not alter significantly the quoted value for the upper limit. Cr ii transitions are blended with Ly lines and with C iv at , so that an estimate of the column density for Cr ii could not be derived. For the absorption feature between and 170 km s-1 , Cr ii 2062 yields an upper limit of logN(CrII) 12.2 while logN(ZnII) 11.8. Ti ii 1910.6,1910.9 are in a blended and noisy region of the spectrum, but recent Keck spectra (kindly provided by A. Songaila) covering up to 6060 Å allowed the detection of Ti ii 3384 (at level) at with logN(Ti ii ), .
3.2 DLA at towards HE 05154414
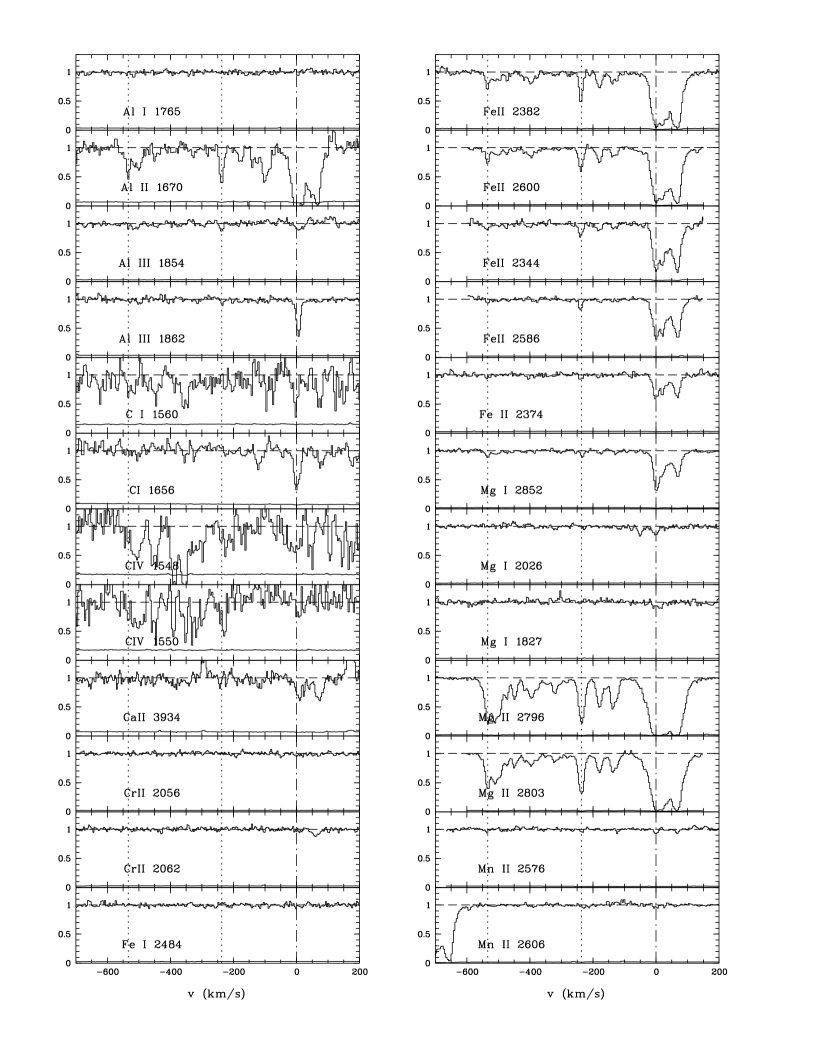
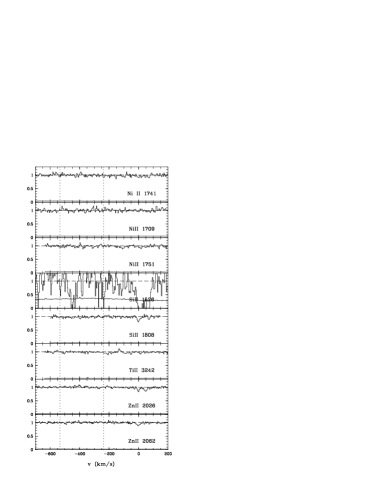
According to IUE data, the extremely bright QSO HE 05154414 (=1.7, V=14.9, Reimers et al. 1998) has a DLA at =1.15 with an estimated column density for neutral hydrogen of logN(H i ) . We observe absorption associated with this system at the expected positions of Al ii 1670, Al iii 1854,1862, C i 1656, C iv 1548,1550, Ca ii 3934, Fe ii 1608,2344,2374,2382,2586,2600, Mg i 1827,2026,2852, Mg ii 2796,2803, Mn ii 2576,2594,2606, Ni ii 1741, Si ii 1526,1808, Zn ii 2026,2062. Upper limits for the column density of ions not detected over are determined for Cr ii 2056,2062, Fe i 2484, Na i 3303, S i 1807 and Ti ii 3242. Figs. 4 and 5 show some of these ions in velocity space, and Table 3 the line parameters resulting from the fits. The line profiles of transitions of Mg ii , Fe ii and Al ii reveal that this remarkably complex system extends over km s-1 . At least three substructures can be distinguished: from approximately to km s-1 , from to km s-1 and the main absorption feature from to 140 km s-1 . Table 4 shows the derived column densities and metal abundances. The number of components is possibly underestimated because of the blending and blanketing problems. The values resulting from the fit of a blend cannot be well determined, but the column density of a blend should be a good approximation of the column densities of individual lines, when the system is not heavily saturated (Jenkins 1986). The best fit for Mg ii and Fe ii requires at least 20 components for the whole system.
The main features in the Fe ii complex were fitted on the weakest transitions (unsaturated), and the secondary ones on the strongest transitions (Fe ii 2382,2600 were used for the absorption from to km s-1 and Fe ii 2382,2600,2344 for the range to km s-1 ). Al ii 1670 is saturated in the strongest substructure, and blended with Mg ii at in the secondary one. Al iii 1862 is blended with Mg ii 2803 at .
A marginal Ni ii detection was obtained summing the spectral regions of Ni ii 1741, Ni ii 1709 and Ni ii 1751 to improve the signal to noise ratio (stacking technique, e.g. Lu 1991). The upper limit for N(Cr) was derived in the same way.
3.3 Mg ii System at towards HE 05154414
The strong Mg ii 2796 absorption features at reveal the presence of a multicomponent system spanning over 200 km s-1 from to 175 km s-1 , if km s-1 corresponds to (Fig. 6). The corresponding Mg ii 2803 lines could only be seen for the main structure (from to 40 km s-1 ), since the rest is blended with Al ii 1670 at . The low redshift does not allow to identify many associated features in our optical data. Absorption lines at the expected positions of Fe ii 2600, 2586, Fe i 3021, Mn ii 2576,2606, Ca ii 3969 and Al i 3803 have been looked for and the results of the fits are shown in Table 6. We obtain a Mn ii /Fe ii ratio about 15 times larger than solar, an improbable high value for a possible DLA. This suggests that the ionization is more complex, and/or that the continuum in the noisy region where Fe ii is expected could be underestimated. Several tests considering higher local continua yield an upper limit of N(Fe) which would mean an abundance of Mn relative to Fe five times larger than solar, if the Mn ii 2576 feature is real. It remains unclear whether this system is a new DLA candidate at very low redshift, maybe with an important part of Fe ii depleted onto dust. Based on N(Mn ii ) and assuming a Mn abundance relative to H of solar, we obtain log(H i ) .
4 Total Metal Abundances
In Table 2, 4 and 5 we show the total metal abundances derived assuming that H i dominates and, therefore, that ionization corrections are not important, as shown by ionization models (Lu et al. 1995, Viegas 1995).
Both DLA are metal-poor with values for the metallicity
of 1/10 to 1/20 solar.
These values are comparable to the abundances found in
other DLA
and confirm the results from previous studies
(Lu et al. 1996, Pettini et al. 1997a,b, 1999a,b
and references therein.):
(i) The large scatter in the
metallicity of DLA at any redshift
(1.6 in [Zn/H] over the whole range of )
is consistent with the heterogeneous types of galaxies seen in
the cases where the
associated galaxy could be identified (e.g. Le Brun et al. 1997,
Steidel et al. 1994, 1995, Rao & Turnshek 1998).
Different star formation rates in spiral galaxies
(Lindner et al. 1999), different impact parameters, and possible local
inhomogeneities, would contribute to the scatter.
(ii)
The enlarged sample shows no metallicity
increase with decreasing , contrary to expectations from models of
cosmic chemical enrichment (e.g. Madau et al. 1996).
Including the new values in the sample
compiled from the literature,
we obtain a column density-weighted mean
abundance of Zn (Pettini et al. 1997a) of
[Zn/H] at ,
or [Zn/H] if Zn is weakly depleted
onto dust as in the Galaxy.
A bias in the observations against dust-rich absorbers could mean that the DLA found at low and moderate , where the dust presence should be more important, are not representative galaxies (e.g. Boissé et al. 1998 and ref. therein). However, even considerable amounts of dust would not have been able to obscure the line of sight of the bright HE 05154414 , and the intervening DLA still shows a rather low metallicity [Zn/H]. The upper limit of [Zn/H] at =0.68, obtained at the Keck resolution, is also noteworthy.
5 Relative Metal Abundances
The ratio of two elements measured in DLA can vary from the solar value due to a different intrinsic pattern and/or to the condensation of refractory elements into dust depletion. We expect that the DLA might have abundance patterns resembling those in Halo stars, which show an overabundance of -group elements relative to Fe, and the odd-even effect (e.g. Mn underabundant relative to Fe.)
Assuming that elements in DLA are depleted as in the Galactic interstellar medium, Vladilo (1998) corrected the observed relative abundances from dust effects. He found the 17 systems of his sample chemically homogeneous over a range of metallicities from nearly solar down to solar and the dust-corrected abundances remarkably close to the solar values. Applying the same correction to our systems, we obtain the dust-corrected abundances shown in Table 7.
Due to the probable heterogeneity of the DLA population, it is interesting to discuss the abundance pattern in the systems individually.
5.1 DLA at towards HE 05154414: evidence for dust depletion
The refractory elements Cr, Ti, Ni are strongly depleted in this system: [Cr/Zn], [Ni/Zn], [Fe,Ti/Zn]. These abundances are comparable with those observed in the warm disk and halo of our Galaxy (Savage & Sembach 1996) . The corrected ratios are, in general, in line with those in Vladilo’s sample and consistent with solar. In particular, elements (e.g. Si, Ti) are not found to be overabundant relative to Fe, and Mn is not significantly underabundant relative to Fe-peak elements. 111The two Mn/Fe measurements from Vladilo (1998) yield [Mn/Fe] when adopting log(Mn/H), from Anders & Grevese (1989).
The observed ratio N(Ca ii )/N(Mg i ) in this DLA, like in two DLA at (Vladilo et al. 1997 and references therein), is consistent with the predictions for warm gas with the base depletion representative of low density lines of sight in our Galaxy (Jenkins 1987). A selection bias would favour lines of sight with a base depletion pattern rather than a dense depletion, which would be present in gas with a smaller cross-section.
Recent observations of diffuse ISM along several lines of sight (Meyer et al. 1998 and ref. therein) show evidence for an ISM abundance of 2/3 solar, rather than solar, mainly based on measurements of O and Kr but also consistent with N, Zn, S and maybe C. We revised the correction for dust depletion in the abundance pattern of HE 05154414 , assuming intrinsic abundances of 2/3 solar for all elements. The pattern remains almost unchanged, with deviations lower than 0.05 dex (mostly of 0.02 dex.)
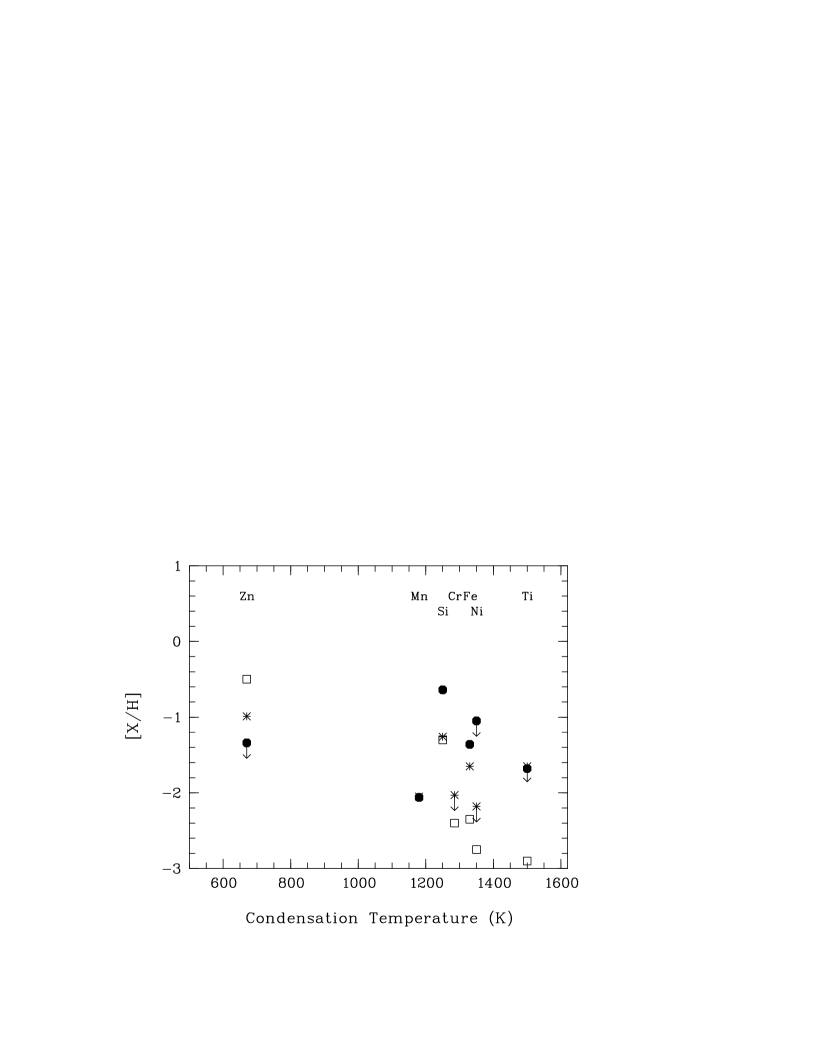
The degree to which an element is depleted by dust grains in the Galactic ISM is known to anticorrelate roughly with the temperature at which half the atoms in the gas phase condense into solid form (e.g. Jenkins 1987). A trend suggesting a depletion pattern can be recognized for this DLA (Fig. 7), but it is mainly based on Zn, the only non-refractory element for which abundances could be determined.
5.2 DLA at towards HE 11221649: no depletion pattern
The relative abundances observed in the DLA at (Table 2) differ considerably from solar, but follow a different pattern than the system at :
-
–
The comparable Fe, Ti and Zn content in this system indicates that the effect of depletion onto dust is negligible, as expected at this low metallicity. Corrections for possible dust depletion are negligible.
-
–
Mn is underabundant relative to Fe, as in the Galactic Halo, and [Al/Si] is also compatible with the odd-even effect.
-
–
The overabundance of -elements relative to Fe is observed for Si/Fe and compatible with the upper limit of O/Fe; however, [Ti/Fe].
Therefore, the abundance pattern shows similarities with metal-poor Halo stars. The low depletion degree could indicate that grain destruction is more efficient than in the Galaxy, maybe due to increased interstellar shocks from supernova explosions, as expected in a galaxy with intense star formation. Further abundance measurements of other weakly depleted elements (like S and O) would help to discern the intrinsic abundance pattern in DLA galaxies.
Plotting the measured abundances versus condensation temperature is consistent with the absence of a depletion pattern (Fig. 7). However, as argued by Pettini et al. (1997a), this lack of correlation should not be overinterpreted at such a low degree of chemical enrichment.
Other lines of sight in the enlarged DLA sample where the observed abundances could be corrected for depletion effects (Table 7), also show diverse patterns: e.g., low dust content is found at , , and a pattern compatible with a solar one (or 2/3 of solar) for the corrected abundances at . The different behaviours confirm that DLA arise in a heterogeneous group, as also inferred from the study of total abundances.
5.3 DLA Abundances and the Nucleosynthesis of Nitrogen
The Nitrogen abundance help us to decipher the Galactic chemical enrichment history. At low metallicities, N primary production, which takes place during the asymptotic giant branch phase of intermediate mass stars, is expected to dominate the secondary N production (e.g. Lu et al. 1998 and references therein). The time-delay between the production of primary N from intermediate mass stars and elements like O, released from massive stars, would imply a large scatter in N/O at low metal abundances (e.g. Marconi et al. 1994). However, observations of nearby metal-poor galaxies do not unambiguously show this pattern.
DLA offer the possibility of studying N abundances for metal-poor systems tracing early stages of the galactic chemical evolution and, therefore, of clarifying the N nucleosynthesis. DLA for which N abundances –or at least reliable upper limits– are available, are at high (Pettini et al. 1995, Lu et al. 1998, Centurión et al. 1998 and references therein). The system at allows the first study of the N content at low redshift. In spite of the numerous N i transitions expected in our spectral range, only upper limits could be derived for N(N i ) due to the severe blending in the Ly forest, yielding [N/H][N/Si] and [N/Fe].
To compare with other systems, we assume that O and the elements (like S, Si) trace each other in DLA, as is the case in the Galaxy and in extragalactic H ii regions. On the other hand, the lack of depletion onto galactic-like dust grains in this system implies that Fe and Si measurements correspond to the total elemental values, and therefore [N/O] [N/S] [N/Si] is assumed.
Lu et al. (1998) and Centurión et al. (1998) found that the N/Si, N/Fe and N/S ratios in a sample of DLA at high show considerable scatter at low metallicities, as predicted by the standard model of delayed N primary production. The observed N/Fe for our DLA at is compatible with the range of measurements in Halo stars (cf. Figs. 6 and 7 in Centurión et al.). The low N/Si ( N/O) limit agrees with the large dispersion and hints at a galaxy with recent star formation: O and Si have recently been released from massive stars and are overabundant relative to N, which has not had time to be primarily delivered from intermediate mass stars in significant amount and has not been secondarily produced in an efficient way at such a low metallicity level. The /Fe enhancement expected in a galaxy with a recent starburst is also observed in this system. On the contrary, Centurión et al. found no overabundance in the few DLA with low N/O values, and suggested that alternative models are required to explain those abundance patterns (e.g. primary N production in massive stars).
6 Neutral Carbon
Neutral species should be detectable in gas with a large H i column density. The detection of C i associated with DLA would be particularly interesting, since the ground-state fine-structure excitation depends on the cosmic microwave background radiation, , and measuring the relative ground-state populations one can estimate the excitation temperature and an upper limit for at that epoch (e.g. Ge et al. 1997 and references therein).
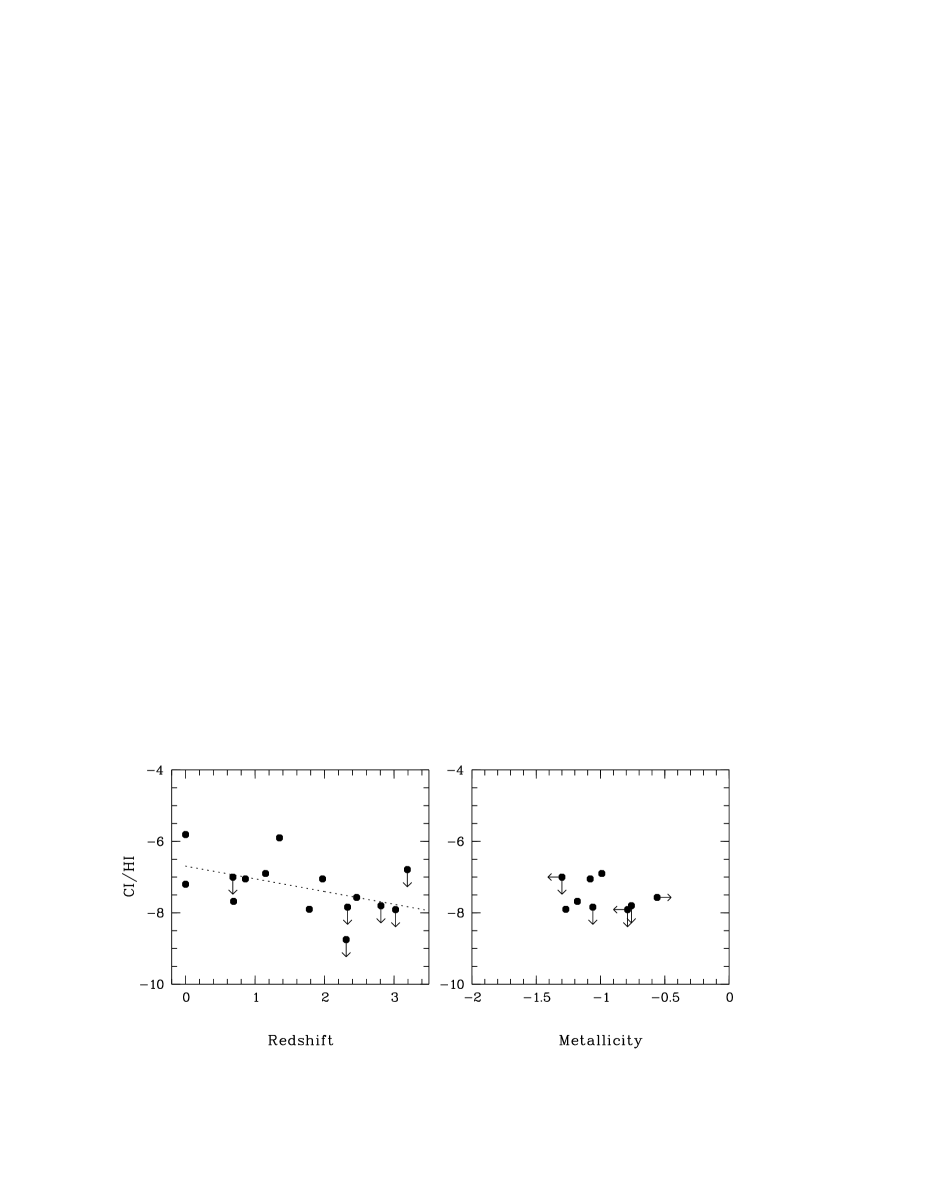
In Table 8 we compare the N(C i ) measured in our systems with other values from the literature for a large range of , and with those observed in Galactic lines of sight towards Oph (diffuses interstellar medium representative of the Galactic disk) and Pup (more tenuous intercloud medium and H ii region). For the DLA at , the absorption features at the expected wavelength of C i 1656,1560 yield log(C i ) and log(C i ∗). The relative population ratios imply an excitation temperature of 14.2 K, which is an upper limit to the , since other mechanisms may contribute to the C i excitation (Lu et al. 1996). On the other hand, the complex structure of the DLA and the considerable noise in the C i 1560 region makes it difficult to deblend C i ∗ from further C i components. For the system at , we obtained an upper limit of log(C i ).
Comparing these values with the C i /H i ratios known in Galactic gas (Jenkins & Shaya 1979) we find that the system reproduces the conditions of the Galaxy, as also found for a DLA at towards PKS 0454+039 (Boissé et al. 1998) and towards Q 0013-004 (Ge et al. 1997). The upper limit for the system at is still compatible with the conditions expected for Galactic gas but could also hint at a lower C i content as observed for a DLA towards 3C 286 (Boissé et al. 1998) and for the DLA at higher in Table 8.
Plotting the C i /H i ratio versus redshift (Fig. 8), a trend of lower C i /H i with increasing can be recognized. The overplotted linear regression is computed including upper limits as exact values. Considering that most of high measurements are actually upper limits, the observed trend would be more pronounced. The evolution of the metagalactic ionizing background (more intense at high than at , e.g. Haardt & Madau 1996) is probably the main reason of the C i /H i evolution with . On the other hand, the local presence of dust could also be playing a role, since dust grains could shield more efficiently the gas from being photoionized. In fact, the DLA in Table 8 with a low dust content show a low C i /H i ratio, regardless of the redshift.
7 Molecules in DLA
We do not see (H2) or CO absorption, consistently with the low metal abundances.
Molecular hydrogen (H2) has numerous transitions at Å and carbon monoxide (CO) at Å . Because of the blending problem it is better to look for absorption-free windows where strong H2 is expected than looking for strong lines themselves (Ge & Bechtold 1997). We do not find absorption at the expected positions of some strong H2 lines (e.g. around ) associated with the DLA at . The H2/H ratio is small compared to Galactic interstellar clouds, a common result for DLA (Ge & Bechtold, 1997). For the DLA at , the spectra do not cover the region where H2 absorption is expected.
We searched for strong CO transitions ( = 1477.568, 1477.355, 1509.75, 1419.046, 1392.525, 1544.451 Å) and obtained upper limits of logN(CO) for the DLA at and logN(CO) at (where only = 1544 Å falls in the available wavelength range). Contrasting these values with the upper limits derived by Lu et al. (1998) at the Keck HIRES resolution for several DLA at high , we find that our CO limits are roughly comparable to the values deduced for diffuse interstellar clouds in the Milky Way.
8 Kinematics: Complex Structure at Moderate
The DLA at towards HE 11221649 extends over km s-1 in velocity space plus a satellite component at km s-1 . As we can see in Figs. 2 and 3, the profiles of low ions observed at high resolution (cf. Fe ii , Mg ii , Mn ii ) track closely one another and show an edge-leading asymmetry, especially if we consider the feature from to 100 km s-1 .
Remarkably, the Mg i 2852 profile shows a different asymmetry: the main feature lies between 100 and 150 km s-1 , while Mg ii – along with other singly ionized ions – shows the strongest absorption between and 100 km s-1 . This suggests that the region between 100 and 150 km s-1 is less ionized, since the feature could not be identified as a metal line associated with another absorber. The difference between Mg i and Mg ii profiles could hint at a non-negligible contribution of an intervening H ii region for this system. The ionized gas would produce an extra contribution to the column densities of species with an ionization potential larger than 13.6 eV, so that the measured abundances of ions like Fe ii , Mn ii , Si ii and Zn ii would correspond to both regions. The metal abundances associated with the H i system would therefore be lower.
The low-ion profiles of the system at towards HE 05154414 (Figs. 4 and 5) span more than 700 km s-1 , which is the largest extent in the velocity space seen for a DLA. As pointed out before, three main structures can be recognized: from approximately to km s-1 , from to km s-1 and the main absorber from to 140 km s-1 . This main complex shows no ordered profile and is consistent with absorber components distributed randomly in .
The remarkably complex structure of low and intermediate DLA provide new hints about their nature. Two kinds of models have been discussed to explain kinematic characteristics of DLA at high : (1) thick rotating disks evolving without merging to form present-day galaxies (Prochaska & Wolfe 1997a,b,1998), and (2) merging protogalactic clumps in the standard Cold Dark Matter cosmology (Haehnelt et al. 1998, McDonald & Miralda-Escudé submitted). The model of rotating thick galactic disks can explain the edge-leading asymmetry of profile structures extending up to km s-1 . An asymmetric structure where the absorption decreases monotonously is found in the system at , but the one at shows a non-ordered profile. The large extent of the systems suggests that they cannot be single rotating disks.
Alternatively, several authors (e.g. Matteuci et al. 1997, Vladilo et al. 1997) have suggested that dwarf galaxies rather than spiral galaxies could be responsible for DLA. The extent of the kinematic profiles of our two new DLA are again too large to be explained by individual dwarf galaxies. On the other hand, Khersonsky & Turnshek (1996) showed that DLA can be associated with neutral gas in giant hydrogenous clouds that could be associated with any type of galaxy or protogalaxy.
Considering only the deepest part of the absorption () most profiles in a sample of high DLA studied by Ledoux et al. (1998) show km s-1 and a trend of decreasing velocity with increasing redshift. Under the same assumptions, our DLA at and match fairly well this behaviour, which is expected in CDM structure formation scenario (e.g. Kauffmann 1996), but not if DLA are disks which do not evolve kinematically. Similarly to the models described by Haehnelt et al. 1998 for high , the velocity broadening in the clumps at intermediate would be due to a mixture of random motions, infall, merging and also rotation, which would still be important at smaller scales and could be responsible for the edge-leading asymmetry observed in some of the clumps.
Wolfe & Prochaska (1998) found a correlation between kinematics and metallicity for a sample of 17 DLA. At they detected no systems like our two, with a large extent in the velocity space ( km s-1 ) and low metallicity ([Zn/H] ) at the same time. On the other hand, the new systems do show moderate (H i ) of cm-2, following the trend of larger to lower (H i ) observed for high redshift DLA (Wolfe & Prochaska 1998).
The ions associated with the DLA at towards HE 05154414 seem to track each other fairly well, but the lack of unsaturated lines from several ions at some velocities makes it difficult to establish the variation of the relative abundances. However, the strongest feature in the profiles of unsaturated Fe ii and Mn ii show two absorption features of comparable intensity, while for Zn ii and Si ii , the first one is clearly larger. Species weakly related to dust in the Galactic ISM seem to show a different profile than those corresponding to refractory elements. This could mean that there is more dust present in the components between and km s-1 , possibly associated with a higher metallicity level, and this dust could be partly concealing the edge-leading asymmetry.
9 Associated Highly-Ionized Gas.
Damped Ly systems studied at high often show considerable Si iv and C iv absorption with profiles resembling each other, but usually different from low ions (e.g. Lu et al. 1996). This suggests that highly-ionized gas is produced in distinct physical regions, which could be surrounding and shielding the low-ionized gas. In our two DLA at moderate redshift, we do not find strong lines from highly-ionized species covering a much larger extent than the weakly-ionized species.
-
–
DLA at towards HE 11221649: Fig. 3 (right panel) shows absorption near the expected positions of C iv , O vi , Si iii and Si iv , none of which is unambiguously present.
-
–
DLA at towards HE 05154414: Only weak C iv absorption with (C iv ) was found associated with the main complex at (from to 140 km s-1 ), contrary to most of DLA, but like towards 3C286 (Boissé et al. 1998), where no associated high ions could be found except for weak C iv . This suggests that the bulk of gas is weakly ionized and shielded from the ionizing radiation field. Stronger absorption features for the C iv doublet yielding N(C iv )= 14.38 could be fitted in the noisy region extending from to km s-1 (Fig. 4), which is less prominent in the low-ion profiles.
Al iii measured in the DLA follows the low ionization species (Al iii is observed for the three main substructures at ), but it is present in a much lower amount than Al ii . These results confirm the very low ionization degree in these systems and suggest that Al iii is probably produced in the same physical region as the low ionization species.
The absence of highly ionized gas associated with the large extents of low ionized regions suggests that the ionizing background is weaker than at high , as expected from the cosmological expansion and from models of the ionizing background (e.g. Haardt & Madau 1996).
10 Summary
We have studied the properties of the DLA at towards HE 11221649 and at towards HE 05154414 . A further DLA candidate at low redshift () has been found in the line of sight of HE 05154414 . Very few DLA at had been analyzed up to now and enlarging the sample is essential to understand the nature of DLA, cosmic chemical evolution and possible selection effects which could be biasing our view of the Universe. The main results of our analysis, interpreted in comparison with DLA at other , are summarized in this section:
-
•
A large number of associated metal lines have been detected at high resolution. Metal abundances are found to be rather low (of 1/10 and of solar value) and comparable to high- DLA. Therefore, the new values confirm the large scatter at any , rather than a clear increase in the metallicity with decreasing for the DLA population. The new systems also confirm the heterogeneity of the DLA population (in agreement with the results from imaging studies, e.g. by Le Brun et al. 1997).
-
•
The relative abundance pattern for the DLA at in the line of sight of the very bright HE 05154414 indicates a significant degree of depletion, with a dust-to-metal ratio comparable to the Galactic value. The intrinsic pattern, after correcting for dust effects, is comparable to solar.
-
•
The system at towards HE 11221649 presents a negligible dust content and its abundance pattern resembles that in metal-poor Halo stars. Relative abundances suggest that most metals in the DLA where made recently. Primary N production in massive stars is not required to explain the abundance pattern.
-
•
The search for neutral carbon shows that systems without significant amounts of dust are not as shielded from ionizing sources as systems where dust is present. C i /H i increases with decreasing , as expected from the evolution of the metagalactic ionizing background.
-
•
The non-detection of H2 or CO molecules is congruent with the low metal abundances.
-
•
The high-resolution data reveal a very complex structure for the low-ion profiles. The system at spans over 300 km s-1 and shows an edge-leading asymmetry. The system shows at least three main substructures over more than 700 km s-1 . This suggests that the line of sight intersects a group of galaxies or subgalactic units. The velocity broadening could be due to a mixture of random motions, infall, merging and rotation.
-
•
Only weak absorption from highly-ionized species were detected and it probably originates in regions distinct from the low-ionized gas.
Further surveys will provide new DLA candidates, which should be observed with the new echelle spectrographs and, at moderate redshift, also with imaging techniques in order to detect their galactic counterparts. Enlarging the DLA sample and clarifying their nature will help us to understand the cosmic chemical evolution and to discern among models of galaxy formation.
References
- Anders & Grevesse (1989) Anders E., Grevesse N., 1989, Geochim. Cosmochim. Acta 53, 197
- Blades et al. (1985) Blades J. C., Hustead R.W., Murdoch H.S., Pettini M., 1985, ApJ 288,580
- Boissé et al. (1998) Boissé P., Le Brun V., Bergeron J., Deharveng J.M., 1998, A&A 333, 841
- Centurion et al. (1998) Centurión M., Bonifacio P., Molaro P., Vladilo G., 1998, ApJ 509,620
- (5) Chaffee F.H., Foltz C.B., Black J.H., 1986, Bull. AAS 18, 1040
- Chaffee et al. (1987) Chaffee F.H., Black J.H., Foltz C.B., 1988, ApJ 335, 584
- Fontana & Ballester (1995) Fontana A., Ballester P., 1995, ESO Messenger 80, 37
- Ge & Bechtold (1997) Ge J., Bechtold J., 1997, ApJ 477,L73
- Ge et al. (1997) Ge J., Bechtold J., Black J.H., 1997, ApJ 474,67
- (10) Haardt F., Madau P., 1996, ApJ 461, 20
- Haehnelt et al. (1998) Haehnelt M. G., Steinmetz M., Rauch M., 1998, ApJ , 495, 647
- (12) Jenkins E.B., 1986, ApJ 304, 739
- Jenkins (1987) Jenkins E.B., 1987, in Interstellar Processes, ed. D.J.Hollenbach, H.A. Thronson (Dordrecht: Reidel), 533
- (14) Jenkins E.B., Shaya E.J., 1979, ApJ 231, 55
- (15) Kauffmann G., 1996, MNRAS 281,472
- (16) Kulkarni V.P., Fall S.M., Truran J.W., 1997, ApJ 484, L7
- (17) Khersonsky V. K., Turnshek D.A., 1996, ApJ 471, 657
- Le Brun et al. (1997) Le Brun V., Bergeron J., Boissé P., Deharveng J. M., 1997, A&A 321, 733
- (19) Ledoux C., Petitjean P., Bergeron J., et al., 1998, A&A 337 L51
- (20) Lindner U., Fritze-von Alvensleben U., Fricke K.J., 1999, A&A 341,709
- (21) Lu L., 1991, ApJ 379, 99
- (22) Lu L., Savage B.D., Tripp T.M., Meyer D., 1995, ApJ 447, 597
- Lu et al. (1996) Lu L., Sargent W. L. W., Barlow T. A., Churchill C. W., Vogt S. S., 1996, ApJS 107, 475
- Lu et al. (1998) Lu L., Sargent W. L. W., Barlow T. A., 1998, AJ 115, 55
- Madau et al. (1991) Madau P., Fergusson H. C., Dickinson M. et al., 1996, MNRAS 283, 1388
- (26) Marconi G., Matteucci F., Tosi M. 1994, MNRAS 270,35
- (27) Matteuci F., Molaro P., Vladilo V., 1997, A&A 321,45
- (28) McDonald P., Miralda-Escudé J. 1999, ApJ 519,486
- (29) Meyer D. M., York D. G., 1987a, ApJ 315, L5
- (30) Meyer D. M., York D. G., 1987b, ApJ 319, L45
- (31) Meyer D. M., York D. G. 1992, ApJ 399, L121
- (32) Meyer D. M., Black J.H., Chaffee F.H., Foltz C.B., York D. G., 1986, ApJ 308, L37
- (33) Meyer D.M., Lanzetta K.M, Wolfe A.M., 1995, ApJ 451, L13
- (34) Meyer D. M., Jura, M., Cardelli J.A., 1998, ApJ 493, 222
- (35) Morton D. C., 1978, ApJ , 222, 863
- (36) Morton D. C., 1991, ApJS 77, 119
- (37) Pei Y.C., Fall S.M., Bechtold J., 1991, ApJ 378, 6
- (38) Pettini M., Boksenberg A., Hunstead R. W., 1990, ApJ 348, 48
- (39) Pettini M., Lipman K., Hunstead R. W., 1995 ApJ 451,100
- (40) Pettini M., Bowen D. V., 1997, A&A 327, 22
- (41) Pettini M., King D. L., Smith L. J., Hunstead R. W., 1997a, ApJ 478,536
- (42) Pettini M., Smith L. J., King D. L., Hunstead R. W., 1997b, ApJ 486, 665
- (43) Pettini M., Ellison S.L., Steidel C.C., Bowen, D.V, 1999a, ApJ 510, 576
- (44) Pettini M., Ellison S.L., Steidel C.C., Shapley A. E., Bowen, D.V, 1999b, ApJ 532, 65
- (45) Prochaska J. X., Wolfe, A. M., 1996, ApJ 470, 403
- (46) Prochaska J. X., Wolfe A. M., 1997a, ApJ 474, 140
- (47) Prochaska J. X., Wolfe A. M., 1997b, ApJ 487, 73
- (48) Prochaska J. X., Wolfe A. M., 1998, ApJ 507,113
- (49) Rao S.M., Turnshek D.A., 1998, ApJ 449,488
- (50) Reimers D., Rodriguez-Pascual P., Hagen H.-J., Wisotzki L., 1995, A&A 293, L21
- (51) Reimers D., Hagen H.-J., Rodriguez-Pascual P., Wisotzki L., 1998, A&A 334, 96
- (52) Savage B. D., Sembach K. R., 1991, ApJ 379, 245
- (53) Savage B. D., Sembach, K. R., 1996, ApJ 470, 893
- (54) Schneider D. P., Hartig G.F., Januzzi B.T., et al., 1993, ApJS 87, 45
- (55) Seaton M.J. 1979, MNRAS 187, 73
- (56) Steidel C. C., Pettini M., Dickinson M., Persson S.E., 1994, AJ 108, 2046
- (57) Steidel C. C., Bowen D. V., Blades J. C., Dickinson M., 1995, ApJ 440, L45
- (58) Steidel C.C., Dickinson M., Meyer D.M., et al. 1997, ApJ 480, 568
- (59) de la Varga A.,1999, Ph.D.Thesis, University of Hamburg
- (60) de la Varga A., Reimers D., 1998, in Petitjean P., Charlot S. (eds.) Structure and Evolution of the intergalactic medium, Proc.IAP Col.1997, Frontiers, Paris
- (61) Verner D. A., Barthel P. D., Tytler D., 1994, AAPS 108, 287
- (62) Viegas S.M., 1995, MNRAS, 276, 268
- (63) Vladilo G., 1998, ApJ 493, 583
- (64) Vladilo G., Centurion M., Falomo R., Molaro P., 1997, A&A 327, 47
- (65) Vogt S. S., Allen A.L., Bigelow B.C., et al., 1994, Proc. SPIE, 2198, 362
- (66) Wolfe A. M., Prochaska J. X., 1998, ApJ 494, L15
- (67) Wolfe A. M., Turnshek D.A., Smith H.E., Cohen R.D., 1986, ApJS 61, 249
| log | ||||||
| Al i | 3083 | 0.6819088 | 0.07 | 10.0 | 0.0 | |
| Al ii | 1670 | 0.6820851 | 0.11 | 30.0 | 0.0 | |
| Al iii | 1862 | 0.6822000 | 30.0 | 0.0 | ||
| C i | 1656 | 0.6821087 | 30.0 | 0.0 | ||
| C ii | 1334 | 0.6822630 | 0.29 | 30.0 | 0.0 | |
| Fe i | 2523 | 0.6818900 | ||||
| Fe ii | 2600 | 0.6813161 | 12.44 | 0.02 | 3.00 | 0.09 |
| 2374 | 0.6818802 | 14.05 | 0.04 | 4.68 | 0.64 | |
| 2374 | 0.6819466 | 13.52 | 0.13 | 4.48 | 1.99 | |
| 2374 | 0.6820377 | 13.71 | 0.07 | 8.71 | 2.10 | |
| 2374 | 0.6821409 | 12.98 | 0.07 | 4.32 | 4.56 | |
| 2374 | 0.6822150 | 13.69 | 0.13 | 11.25 | 3.75 | |
| 2374 | 0.6823508 | 13.52 | 0.08 | 9.35 | 1.79 | |
| 2374 | 0.6824777 | 12.72 | 0.10 | 3.00 | 0.00 | |
| 2374 | 0.6825430 | 13.60 | 0.04 | 3.00 | 0.00 | |
| 2374 | 0.6825936 | 13.32 | 0.05 | 3.00 | 0.00 | |
| 2374 | 0.6826816 | 13.16 | 0.08 | 10.32 | 2.69 | |
| 2374 | 0.6828596 | 12.65 | 0.10 | 3.00 | 0.00 | |
| 2374 | 0.6829300 | 13.06 | 0.08 | 3.00 | 0.00 | |
| 2374 | 0.6830164 | 13.05 | 0.13 | 10.57 | 5.00 | |
| Mg i | 2852 | 0.6819096 | 11.37 | 0.13 | 3.15 | 0.48 |
| 2852 | 0.6821620 | 11.62 | 0.04 | 22.98 | 3.81 | |
| 2852 | 0.6825483 | 11.49 | 0.43 | 2.59 | 1.05 | |
| 2852 | 0.6826613 | 11.32 | 0.11 | 4.28 | 1.73 | |
| 2852 | 0.6829651 | 11.74 | 0.14 | 2.39 | 0.19 | |
| 2852 | 0.6832639 | 11.50 | 0.17 | 1.96 | 0.34 | |
| Mg ii | 2796 | 0.6813161 | 12.74 | 0.04 | 4.43 | 0.33 |
| 2803 | 0.6813162 | 12.74 | 0.04 | 4.43 | 0.33 | |
| 2803 | 0.6818795 | 14.42 | 0.37 | 2.81 | 0.24 | |
| 2796 | 0.6818794 | 14.42 | 0.37 | 2.81 | 0.24 | |
| 2803 | 0.6819472 | 13.21 | 0.04 | 14.62 | 0.56 | |
| 2796 | 0.6819472 | 13.21 | 0.04 | 14.62 | 0.56 | |
| 2803 | 0.6820363 | 13.52 | 0.05 | 9.25 | 0.89 | |
| 2796 | 0.6820364 | 13.52 | 0.05 | 9.25 | 0.89 | |
| 2803 | 0.6821541 | 13.40 | 0.17 | 3.70 | 0.94 | |
| 2796 | 0.6821541 | 13.40 | 0.17 | 3.70 | 0.94 | |
| 2803 | 0.6822218 | 13.79 | 0.18 | 5.57 | 0.82 | |
| 2796 | 0.6822218 | 13.79 | 0.18 | 5.57 | 0.82 | |
| 2803 | 0.6823556 | 13.43 | 0.02 | 10.32 | 0.75 | |
| 2796 | 0.6823556 | 13.43 | 0.02 | 10.32 | 0.75 | |
| 2803 | 0.6824673 | 12.84 | 0.11 | 3.50 | 0.62 | |
| 2796 | 0.6824672 | 12.84 | 0.11 | 3.50 | 0.62 | |
| 2803 | 0.6825500 | 13.64 | 0.27 | 3.96 | 0.48 | |
| 2796 | 0.6825500 | 13.64 | 0.27 | 3.96 | 0.48 | |
| 2803 | 0.6826048 | 13.23 | 0.73 | 2.18 | 1.45 | |
| 2796 | 0.6826049 | 13.23 | 0.73 | 2.18 | 1.45 | |
| 2803 | 0.6826891 | 13.22 | 0.01 | 12.23 | 0.55 | |
| 2796 | 0.6826891 | 13.22 | 0.01 | 12.23 | 0.55 | |
| 2803 | 0.6828574 | 11.27 | 0.47 | 13.08 | 7.72 | |
| 2796 | 0.6828575 | 11.27 | 0.47 | 13.08 | 7.72 | |
| 2803 | 0.6829114 | 12.58 | 0.13 | 7.16 | 0.91 | |
| 2796 | 0.6829112 | 12.58 | 0.13 | 7.16 | 0.91 | |
| 2803 | 0.6829443 | 12.25 | 0.27 | 2.30 | 0.71 | |
| 2796 | 0.6829442 | 12.25 | 0.27 | 2.30 | 0.71 | |
| Mn i | 2799 | 0.6818900 | ||||
| Mn ii | 2576 | 0.6818700 | 0.09 | 2.93 | 2.57 | |
| 2594 | 0.6818699 | 0.09 | 2.93 | 2.57 | ||
| 2576 | 0.6819273 | 0.11 | 1.55 | 2.65 | ||
| 2594 | 0.6819273 | 0.11 | 1.55 | 2.65 | ||
| N i | 1199 | 0.6818900 | 30.0 | 0.00 | ||
| N v | 1238 | 0.6818900 | ||||
| 1242 | ||||||
| Ni i | 2346 | 0.6818900 | ||||
| Ni ii | 1317 | 0.6818900 | ||||
| O i | 1039 | 0.681890 | 30.0 | 0.00 | ||
| O vi | 1031 | 0.6821704 | 18.94 | 0.09 | 0.00 | 24.53 |
| S i | 1807 | 0.6820000 | ||||
| S iii | 1012 | 0.6820000 | ||||
| Si i | 2515 | 0.6818900 | ||||
| Si ii | 1193 | 0.6819438 | 15.32 | 0.09 | 25.00 | 0.00 |
| 1190 | 0.6819438 | 15.32 | 0.09 | 25.00 | 0.00 | |
| 1193 | 0.6825498 | 14.36 | 0.12 | 16.00 | 0.00 | |
| 1190 | 0.6825498 | 14.36 | 0.12 | 16.00 | 0.00 | |
| Si iv | 1402 | 0.6823700 | 14.32 | 0.23 | 30. | 0.0 |
| Ti ii | 3384 | 0.6818927 | 11.70 | 0.28 | 1.19 | 0.7 |
| Zn i | 2139 | 0.68189 | ||||
| Zn ii | 2026 | 0.68189 |
| Element | log (cm-2) | Total Abundance | [Metal/Fe] | [Metal/Zn] |
| Al | ||||
| C | ||||
| Fe | ||||
| Mg | ||||
| Mn | ||||
| N | ||||
| Ni | ||||
| O | ||||
| Si | ||||
| Ti | ||||
| Zn |
| log | ||||||
| Al ii | 1670 | 1.1468446 | 11.44 | 0.19 | 7.03 | 5.34 |
| 1.1469733 | 12.40 | 0.20 | 2.77 | 0.28 | ||
| 1.1470984 | 11.80 | 0.20 | 2.37 | 8.48 | ||
| 1.1472185 | 12.08 | 0.19 | 8.80 | 6.53 | ||
| 1.1475825 | 12.01 | 0.06 | 1.43 | 0.06 | ||
| 1.1480030 | 11.36 | 0.10 | 9.38 | 3.58 | ||
| 1.1484466 | 11.98 | 0.08 | 1.26 | 0.07 | ||
| 1.1487808 | 12.53 | 0.45 | 0.21 | 2.52 | ||
| 1.1490958 | 13.02 | 0.38 | 2.85 | 0.35 | ||
| 1.1495245 | 11.80 | 0.08 | 7.67 | 2.55 | ||
| 1.1498086 | 12.69 | 0.08 | 1.07 | 0.23 | ||
| 1.1507328 | 12.13 | 1.09 | 23.51 | 22.7 | ||
| 1.1508443 | 15.42 | 0.87 | 7.71 | 1.71 | ||
| 1.1511260 | 12.64 | 0.15 | 9.91 | 3.84 | ||
| 1.1512798 | 13.53 | 0.82 | 5.13 | 2.02 | ||
| 1.1513751 | 12.05 | 0.77 | 25.35 | 35.08 | ||
| Al iii | 1854 | 1.1490991 | 11.88 | 0.06 | 2.84 | 1.30 |
| 1862 | ||||||
| 1854 | 1.1508672 | 12.07 | 0.07 | 14.73 | 3.17 | |
| C i | 1656 | 1.1508082 | 13.56 | 0.04 | 9.31 | 1.43 |
| 1560 | 1.1508083 | |||||
| 1656 | 1.1513586 | 13.05 | 0.09 | 12.68 | 1.03 | |
| 1560 | 1.1513586 | |||||
| C i ∗ | 1656.2 | 1.1507983 | 13.44 | 0.07 | 7.48 | 2.45 |
| C i ∗ | 1657.9 | 1.1507983 | ||||
| C iv | 1548 | 1.1471568 | 13.63 | 0.06 | 20.69 | 3.11 |
| 1550 | 1.1471567 | 13.63 | 0.06 | 20.69 | 3.11 | |
| 1548 | 1.1475769 | 13.55 | 0.08 | 9.33 | 1.56 | |
| 1550 | 1.1475769 | 13.55 | 0.08 | 9.33 | 1.56 | |
| 1548 | 1.1480157 | 13.68 | 0.08 | 7.03 | 1.33 | |
| 1550 | 1.1480159 | 13.68 | 0.08 | 7.03 | 1.33 | |
| 1548 | 1.1482468 | 13.74 | 0.07 | 10.06 | 2.00 | |
| 1550 | 1.1482468 | 13.74 | 0.07 | 10.06 | 2.00 | |
| 1548 | 1.1485275 | 13.61 | 0.08 | 24.69 | 5.03 | |
| 1550 | 1.1485275 | 13.61 | 0.08 | 24.69 | 5.03 | |
| 1548 | 1.1491662 | 13.26 | 0.09 | 11.06 | 3.27 | |
| 1550 | 1.1491662 | 13.26 | 0.09 | 11.06 | 3.27 | |
| C iv | 1548 | 1.1508356 | 13.18 | 0.12 | 10.12 | 4.35 |
| 1550 | ||||||
| Ca ii | 3934 | 1.1508502 | 11.87 | 0.23 | 7.23 | 4.79 |
| 1.1509476 | 12.17 | 0.14 | 30.14 | 8.88 | ||
| 1.1513215 | 12.25 | 0.05 | 12.60 | 1.82 | ||
| Cr ii | 2056 | 1.150800 | ||||
| Fe i | 2484 | 1.150800 | ||||
| Fe ii | 2600 | 1.1469649 | 12.43 | 0.05 | 2.30 | 0.51 |
| 1.1469650 | 12.43 | 0.05 | 2.30 | 0.51 | ||
| 1.1471601 | 11.93 | 0.15 | 10.52 | 2.81 | ||
| 1.1471599 | 11.93 | 0.15 | 10.52 | 2.81 | ||
| 1.1472481 | 12.66 | 0.05 | 50.32 | 5.67 | ||
| 1.1472480 | 12.66 | 0.05 | 50.32 | 5.67 | ||
| 1.1479497 | 12.58 | 0.03 | 21.17 | 1.63 | ||
| 1.1479497 | 12.58 | 0.03 | 21.17 | 1.63 | ||
| 1.1490909 | 13.11 | 0.13 | 2.40 | 0.21 | ||
| 1.1490909 | 13.11 | 0.13 | 2.40 | 0.21 | ||
| 1.1495110 | 12.54 | 0.02 | 8.42 | 0.78 | ||
| 1.1495110 | 12.54 | 0.02 | 8.42 | 0.78 | ||
| 1.1498045 | 12.21 | 0.06 | 4.82 | 3.59 | ||
| 1.1498046 | 12.21 | 0.06 | 4.82 | 3.59 | ||
| 1.1499078 | 12.06 | 0.10 | 2.89 | 1.22 | ||
| 1.1499077 | 12.06 | 0.10 | 2.89 | 1.22 | ||
| 2374 | 1.1508005 | 13.75 | 0.01 | 9.54 | 0.64 | |
| 1.1509480 | 13.68 | 0.05 | 1.73 | 0.12 | ||
| 1.1510571 | 13.13 | 0.06 | 2.30 | 0.62 | ||
| 1.1512597 | 13.64 | 0.03 | 15.35 | 1.27 | ||
| 1.1512957 | 13.18 | 0.18 | 1.01 | 6.68 | ||
| Mg i | 1827 | 1.1508058 | 12.86 | 0.09 | 16.34 | 4.68 |
| 2026 | ||||||
| 2852 | 1.1508093 | 12.06 | 0.02 | 7.19 | 0.52 | |
| 1.1509610 | 12.29 | 0.02 | 29.61 | 1.07 | ||
| 1.1513028 | 11.95 | 0.02 | 11.32 | 0.54 | ||
| Mg ii | 2796 | 1.1469659 | 12.79 | 0.23 | 2.88 | 1.04 |
| 2803 | 1.1469659 | 12.79 | 0.23 | 2.88 | 1.04 | |
| 2796 | 1.1470861 | 13.00 | 0.05 | 28.34 | 2.83 | |
| 2803 | 1.1470863 | 13.00 | 0.05 | 28.34 | 2.83 | |
| 2796 | 1.1471353 | 12.34 | 0.08 | 4.53 | 2.01 | |
| 2803 | 1.1471351 | 12.34 | 0.08 | 4.53 | 2.01 | |
| 2796 | 1.1472504 | 12.29 | 0.16 | 5.40 | 2.42 | |
| 2803 | 1.1472507 | 12.29 | 0.16 | 5.40 | 2.42 | |
| 2796 | 1.1474081 | 12.11 | 0.11 | 5.15 | 1.77 | |
| 2803 | 1.1474082 | 12.11 | 0.11 | 5.15 | 1.77 | |
| 2796 | 1.1475828 | 12.25 | 0.02 | 7.17 | 0.60 | |
| 2803 | 1.1475830 | 12.25 | 0.02 | 7.17 | 0.60 | |
| 2796 | 1.1479594 | 12.62 | 0.01 | 26.94 | 0.91 | |
| 2803 | 1.1479595 | 12.62 | 0.01 | 26.94 | 0.91 | |
| 2796 | 1.1485009 | 12.34 | 0.02 | 20.98 | 1.22 | |
| 2803 | 1.1485010 | 12.34 | 0.02 | 20.98 | 1.22 | |
| 2796 | 1.1491084 | 12.85 | 0.01 | 9.75 | 0.19 | |
| 2796 | 1.1495093 | 12.34 | 0.03 | 7.06 | 0.63 | |
| 2796 | 1.1496212 | 12.43 | 0.05 | 34.58 | 5.65 | |
| 2796 | 1.1498080 | 12.77 | 0.55 | 2.10 | 0.51 | |
| 2796 | 1.1499032 | 12.21 | 0.08 | 6.85 | 1.32 | |
| 2803 | 1.1503466 | 11.65 | 0.16 | 6.43 | 3.15 | |
| 2803 | 1.1506114 | 12.79 | 0.11 | 21.11 | 3.89 | |
| 2803 | 1.1508448 | 13.80 | 0.04 | 15.89 | 0.87 | |
| 2803 | 1.1509888 | 13.41 | 0.12 | 23.32 | 4.36 | |
| 2803 | 1.1512514 | 13.41 | 0.08 | 31.96 | 1.92 | |
| 2803 | 1.1512749 | 15.11 | 0.42 | 4.94 | 0.49 | |
| 2803 | 1.1517754 | 11.74 | 0.11 | 9.73 | 4.27 | |
| Mn ii | 2576 | 1.1507992 | 11.67 | 0.08 | 4.61 | 2.30 |
| 2594 | 1.1507992 | 11.67 | 0.08 | 4.61 | 2.30 | |
| 2606 | 1.1507992 | 11.67 | 0.08 | 4.61 | 2.30 | |
| Mn ii | 2576 | 1.1512835 | 11.58 | 0.11 | 4.09 | 5.22 |
| Na i | 3303 | 1.1508000 | ||||
| Ni ii | 1741 | 1.1507868 | 0.12 | 5.19 | 3.94 | |
| S i | 1807 | 1.1508000 | ||||
| Si ii | 1808 | 1.1507919 | 14.51 | 0.05 | 7.2 | 2.8 |
| Si ii | 1526 | |||||
| Si ii | 1808 | 1.1509281 | 13.98 | 0.14 | 2.08 | 4.19 |
| Si ii | 1526 | |||||
| Si ii | 1808 | 1.1512949 | 14.12 | 0.11 | 2.49 | 3.19 |
| Si ii | 1526 | |||||
| Zn ii | 2026 | 1.1513157 | 12.11 | 0.04 | 9.15 | 1.66 |
| Al | |||
| Ca ii | |||
| Cr | |||
| Fe | |||
| Mn | |||
| Ni | |||
| Si | |||
| Ti | |||
| Zn |
| log (cm-2) | ) | (km s-1) | ||||
| Al i | 3969 | 0.2813500 | ||||
| Ca ii | 3969 | 0.2813500 | ||||
| Fe i | 3021 | 0.2813500 | ||||
| Fe ii | 2600 | 0.2813753 | 13.14 | 0.09 | 15.00 | 0.00 |
| 2600 | 0.2817716 | 12.96 | 0.20 | 5.29 | 4.82 | |
| Mn ii | 2576 | 0.2813256 | 12.46 | 0.15 | 8.00 | 0.00 |
| 2606 | 0.2813256 | 12.46 | 0.15 | 8.00 | 0.00 | |
| Mg ii | 2796 | 0.2812490 | 12.44 | 0.08 | 13.93 | 3.54 |
| 2803 | 0.2812490 | 12.44 | 0.08 | 13.93 | 3.54 | |
| 2796 | 0.2813520 | 12.77 | 0.27 | 6.92 | 2.42 | |
| 2803 | 0.2813521 | 12.77 | 0.27 | 6.92 | 2.42 | |
| 2796 | 0.2814065 | 12.73 | 0.30 | 13.52 | 4.79 | |
| 2803 | 0.2814064 | 12.73 | 0.30 | 13.52 | 4.79 | |
| 2796 | 0.2817727 | 14.13 | 0.26 | 4.82 | 0.35 | |
| 2796 | 0.2818092 | 12.61 | 0.09 | 15.93 | 2.74 | |
| 2796 | 0.2819882 | 13.44 | 1.57 | 2.62 | 0.67 | |
| 2796 | 0.2820545 | 12.19 | 0.07 | 4.89 | 2.55 |
| QSO | [Zn/Cr] | [Zn/Fe] | [Si/Fe] | [Ti/Fe] | [Mn/Fe] | [Ni/Fe] | [Cr/Fe] | [S/Fe] | Ref.∗ | |
| 1.15 | HE 05154414 | 0.66 | 0.39 | 0.00 | -0.40 | -0.53 | -0.38 | 1 | ||
| 0.00 | -0.03 | -0.01 | -0.07 | -0.03 | -0.05 | |||||
| 0.68 | HE 11221649 | 0.02 | 0.72 | -0.32 | -0.70 | 0.31 | 1 | |||
| 0.00 | 0.69 | -0.29 | -0.60 | 0.29 | ||||||
| 0.3953 | PKS12290210 | 2 | ||||||||
| -0.10 | ||||||||||
| 0.6560 | 3C336 | -0.29 | 3 | |||||||
| -0.04 | ||||||||||
| 0.6920 | 3C286 | 0.50 | 0.71 | -0.29 | 4,2 | |||||
| -0.05 | 0.07 | -0.06 | 0.04 | |||||||
| 0.8598 | PKS0454+0356 | 0.07 | -0.07 | -0.36 | -0.57 | -0.14 | 5 | |||
| 0.08 | -0.06 | -0.38 | -0.63 | -0.15 | ||||||
| 1.0095 | EX 0302233 | 0.39 | 0.50 | 6,2 | ||||||
| -0.10 | ||||||||||
| 1.1491 | Q 1351+318 | 0.57 | 0.64 | 0.45 | -0.16 | -0.41 | 0.07 | 9 | ||
| 0.00 | 0.01 | 0.00 | -0.05 | -0.03 | 0.00 | |||||
| 1.2232 | Q 1247+267 | 0.20 | 0.37 | 0.28 | -0.19 | 0.17 | 9 | |||
| -0.05 | 0.07 | 0.07 | -0.09 | 0.07 | ||||||
| 1.3726 | Q 0935+417 | 0.10 | 0.29 | -0.39 | 0.19 | 7,8 | ||||
| -0.06 | 0.09 | -0.19 | 0.11 | |||||||
| 1.4200 | Q 1354+258 | 0.20 | 0.42 | 0.30 | -0.29 | -0.65 | 0.22 | 9 | ||
| -0.06 | 0.10 | 0.07 | -0.11 | -0.15 | 0.10 |
∗ (1) This work, (2) Boissé et al. 1998, and ref. therein, (3) Steidel et al. 1997, (4) Meyer & York 1992, (5) Lu et al. 1996, (6) Pettini & Bowen 1997, (7) Meyer, Lanzetta & Wolfe 1995, (8) Pettini et al. 1997a, and (9) Pettini et al. 1999.
| Sightline | logN(H i ) | logN(C i ) | [Zn/H] | References∗ | |
| 2000-330 | 3.19 | 19.69 | 1 | ||
| 0741+4741 | 3.02 | 20.03 | 8 | ||
| 0528-250 | 2.81 | 21.28 | 2 | ||
| 0201+365 | 2.46 | 20.8 | 3 | ||
| 2243-6031 | 2.33 | 20.39 | 8 | ||
| PHL 957 | 2.31 | 21.40 | 4 | ||
| 0013-004 | 1.97 | 20.70 | 5 | ||
| 1331+170 | 1.78 | 21.18 | 6 | ||
| 0215+015 | 1.35 | 19.80 | 7 | ||
| 0515-4414 | 1.15 | 20.45 | 11 | ||
| 0454+039 | 0.86 | 20.69 | 9 | ||
| 3C286 | 0.69 | 21.25 | 9 | ||
| 1122-1649 | 0.68 | 20.45 | 11 | ||
| Orp | 0 | 21.15 | 10 | ||
| Pup | 0 | 20.0 | 10 |
∗(1)Meyer & York 1987a, (2)Meyer & York 1987b and ref. therein, (3) Prochaska & Wolfe 1996, (4)Meyer et al. 1986, Chaffee et al. 1986, (5) Ge et al. 1997, (6) Chaffee et al. 1988 and ref, therein, (7) Blades et al. 1985, (8) de la Varga 1999, (9) Boissé et al. 1998 (10) Morton 1978, (11) This paper.