Spectroscopy of diffuse ionized gas in halos of selected edge-on galaxies††thanks: Based on observations obtained at ESO/La Silla (Chile)
Abstract
In order to examine the excitation and ionization mechanism of extraplanar diffuse ionized gas (DIG) we have obtained optical longslit spectra of seven edge-on spiral galaxies. In four objects the brightest emission lines can be traced out to distances of typically 1.5 kpc above the disk. For NGC 1963 and NGC 3044 line ratios such as [N ii] or [S ii] as well as / could be measured for the halo DIG. This allows us to discuss the DIG in the halo of these objects in the framework of diagnostic diagrams. For these two objects, the line ratios of / decrease with increasing , different from the recently reported trend in NGC 891 (Rand rand (1998)). We find that emission lines from the DIG in the disks are in good agreement with photoionization models using a dilute radiation field. However, with increasing these models fail to predict the measured / and / line ratios for NGC 1963. Diagnostic diagrams reveal for NGC 1963 the need for a second ionization mechanism of the halo DIG (besides photoionization). This additional source could be shock ionization. The same diagrams demonstrate an intermediate classification for NGC 3044. Plots of vs. emission measure reveal significant changes towards the halo and seem to trace local small scale density fluctuations of the extraplanar DIG.
Key Words.:
Galaxies: halos – Galaxies: ISM – Galaxies: spiral1 Introduction
Over the last decade a widespread and extended diffuse component of ionized hydrogen contributing 25 – 50 % to the total H flux has been found well outside of classical H ii regions in several face-on and edge-on galaxies (e.g., Lehnert & Heckman lehe (1995), Rand rand96 (1996), Greenawalt et al. green97 (1997), or Dettmar det98 (1998)). Although there is significant evidence that the presence of the extraplanar diffuse ionized gas (DIG, sometimes also called warm ionized medium, WIM) is correlated with ongoing star formation in the disk (e.g., Dettmar det92 (1992)), important aspects of its ionization and excitation are not well understood. While of all conventional ionizing sources only UV radiation of massive stars provides sufficient power to keep these thick gas layers ionized (including the Reynolds-layer of the Milky Way (Reynolds rey93 (1993))) the resulting photoionization models have to explain the long mean free paths for the UV photons and the observed emission line ratios. However, the relatively strong emission observed in the lines (Dettmar & Schulz deschu92 (1992), Golla et al. gogode96 (1996), Rand rand97 (1997)) cause a problem for pure photoionization models and an additional heating contribution, e.g. from the kinetic energy provided by supernova, is likely (Dahlem et al. dahl97 (1997)). An even more puzzling observation was recently presented for the DIG in NGC 891 which is up to now the best studied galaxy in this regard (Rand rand (1998)). In complete contradiction to photoionization models here [O iii]/H is rising with distance above the galactic plane for 1 kpc. Diagnostic diagrams for emission lines from DIG in outflows of dwarf galaxies (Martin martin (1997)) also demonstrate the need for ionization and/or excitation processes beyond pure photoionization. In this paper we report results from spectroscopic observations of a small sample of edge-on galaxies. These new spectra cover a larger wavelengths range extending earlier work to the blue range of the optical spectrum. This allows us to discuss the results in the framework of diagnostic diagrams. The paper is structured as follows: In Sect. 2– 3 some essential information concerning observations and data reduction strategies, the determination of line ratios, and the use of diagnostic diagrams is given. Sect. 4 shows representative results which are discussed briefly for each galaxy with respect to the photoionization models by Mathis (ma (1986), hereafter Ma86) and Domgörgen & Mathis (doma (1994), hereafter DM94). Finally, our findings are summarized in Sect. 5 with special emphasis to the trend of , and the proposed dependence of line ratio variations with changing halo metallicities.
2 Observations and data reduction
The dataset consists of spectra of the normal late-type spirals NGC 1963, IC 2531, NGC 3044, NGC 4302, NGC 4402, NGC 4634, and of the irregular galaxy NGC 2188. All objects in the sample are seen nearly edge-on (see Table 1). Slit positions were determined from narrow band images on which diffuse H ii gas at high galactic latitudes was detected (Rossa & Dettmar rossa (2000)).
The spectroscopic data were obtained during January/February 1995 with the ESO 1.52m telescope in combination with the Boller & Chivens spectrograph at La Silla (Chile). A Ford Aerospace CCD (2048 2048 pixel) with a pixel size of 15 15 m and a spatial resolution of 0.82 pix-1 was used during the observations. Grating 23 provided a dispersion of 126 Å which resulted in a coverage of a wavelength range from 3500 Å – 7450 Å. We determined the spectral resolution to 4.6 Å by measuring the FWHM of an unbroadened emission line in a HeAr-calibration spectrum. The total integration time per slit position was 90 minutes.
| Galaxy | R.A. | Dec. | Type | D | ze | inclination | DIG morphologyg | |
|---|---|---|---|---|---|---|---|---|
| (J 2000) | (J 2000) | [Mpc]a | if | [mag]d | ||||
| NGC 1963 | 05h33m12.8s | 36∘23′59′′ | Sc | 17.7 | 0.004410 | 12.11 | diffuse | |
| NGC 3044 | 09h53m39.8s | +01∘34′46′′ | SBb | 17.2 | 0.004310 | b | 11.65 | bright, diffuse |
| IC 2531 | 09h59m55.7s | 29∘36′55′′ | Sb | 33.0 | 0.008460 | 11.54 | 1 filament | |
| NGC 4302 | 12h21m42.4s | +14∘36′05′′ | Sc | 18.8c | 0.003690 | c | 11.83c | faint, diffuse |
| NGC 4402 | 12h26m07.9s | +13∘06′46′′ | Sb | 22.0c | 0.000790 | c | 12.09c | diffuse |
| NGC 4634 | 12h42m40.4s | +14∘17′47′′ | Sc | 19.1c | 0.000390 | c | 11.91c | bright, diffuse, extraplanar |
| + filaments |
,
b Bottinelli et al. botti (1984),
c Teerikorpi et al. teeri (1992)
d The Surface Photometry Catalogue of the ESO-Uppsala
Galaxies; Lauberts A. and Valentijn E.A., laube (1989)
e NASA Extragalactic Database
f Third Reference Catalogue of Bright Galaxies; de
Vaucouleurs et al., devau (1991)
g Rossa & Dettmar 2000
Data reduction was performed using the IRAF and MIDAS software packages. All data were bias subtracted and dome flats were used to reduce small scale sensitivity variations. An extinction correction was performed by adopting the atmospheric extinction curve for La Silla (Tüg tug (1977)). Spectroscopy of the standard star Hiltner 600 yielded the wavelength dependent response function. We divided all object frames by this function to correct for wavelength dependent sensitivity variations. Subsequently a flux calibration of our spectra was applied.
The slit length of allowed a precise night sky subtraction. This reduction process did not influence the emission lines of He i5876 and [O i]6300 since they are sufficiently redshifted from the atmospheric lines for our objects. Due to the large wavelength range we could not apply a single continuum fit to the whole spectrum. Therefore the continuum level was estimated and subtracted row by row from the total emission of each galaxy using linear fits to the continuum on each side of prominent emission lines. The data for NGC 2188 are already presented by Domgörgen & Dettmar (domade (1997)) and will not be further discussed here. As a consistency check these spectra were reanalysed and the previous results were fully reproduced.
3 Line ratios and diagnostic diagrams
For all galaxies listed in Table 1 emission lines are traced down to S/N . Detected spectral features for all galaxies are , and . Line ratios are measured using a block average algorithm. The block size was fixed by the achieved S/N (at least 2) to reach simultaneously the best possible spatial resolution. For the disk and the halo of a galaxy we have chosen block sizes of 1 – 2 and 3 – 4 rows, respectively.
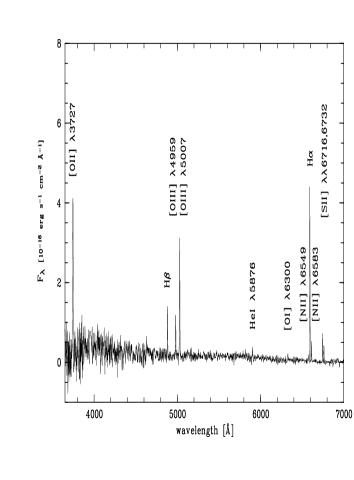
For the galaxies NGC 1963 and NGC 3044 additional emission lines could be detected from the halo DIG, namely 111Due to low spectral resolution the [O ii]-doublet cannot be separated. We therefore assume an average wavelength of 3727 Å., , , , and . Thus the extraplanar DIG in these objects can be discussed for the first time in the framework of diagnostic diagrams. A typical spectrum of the DIG in NGC 1963 is given in Fig. 2.
A comparison with photoionization models of Ma86 and DM94 can clarify some properties of the sources which keep the DIG ionized. Only the line ratios of / and have to be corrected for interstellar extinction. The precise values are obtained following Osterbrock (oster (1989)). Unreddened line ratios can be computed by assuming an average interstellar extinction curve and adopting as nebular reference emission line. The extinction can be determined from the measured Balmer decrement. It is assumed that such a correction is negligible for the remaining line ratios because only pairs of emission lines in the red spectral region had been chosen which are located in a narrow wavelength region ( Å) so that differential reddening is not significant.
![[Uncaptioned image]](/html/astro-ph/0008340/assets/x1.png)
It is noteworthy that an extinction correction does not influence a clear separation of different excitation mechanisms significantly (Baldwin et al. bald (1981)). The dereddening for / and amounts to 11 for the disk emission and 4 for the halo emission. For the remaining line ratios the reddening correction is less than 1 (disk and halo).
In extragalactic objects basically four different ionization mechanisms can be clearly distinguished. Firstly “normal” photoionization by O stars which is present mainly in H ii regions (star forming regions). Secondly shock ionization present in objects which are excited by supernova remnants (SNR) or by superwinds. Finally we can also distinguish between photoionization by extremely hot stars such as the central stars of planetary nebulae and objects which are photoionized by a power-law continuum source (AGN). To probe the ionization mechansism(s) of the extraplanar DIG it is useful to plot line ratios by pairs on a logarithmic scale (Baldwin et al. bald (1981), Veilleux & Osterbrock veio (1987)). Since the above mentioned mechanisms produce characteristically different spectra, all objects cover different locations when plotted into a single diagnostic diagram.
In order to verify our findings obtained from line ratios and diagnostic diagrams we examined also the broadening of line widths at extraplanar latitudes. Therefore we plotted a kinematical diagnostic diagram (line ratio vs. line width (FWHM)) which indicates the presence of additional excitation mechanisms, such as shocks or stellar winds.
4 Results and discussion
4.1 NGC 1963
NGC 1963 is a Sc galaxy with an inclination angle of (edge-on) at a distance of 17.7 Mpc (see Table 1). The corresponding slit positions s1 and s2 are overplotted on the image and are displayed in Fig. 3. Some diffuse emission near the nucleus in the disk-halo interface and bright extended H ii regions in the disk are visible. The origin of the -scale was determined from the continuum emission of the disk.
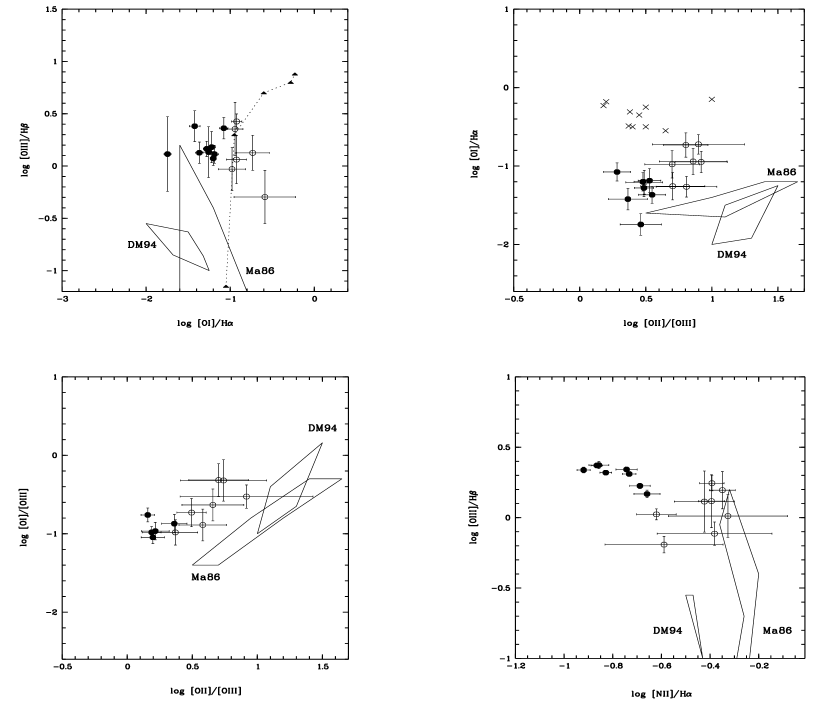
Although generally plotted as a function of , we also present line ratios as a function of emission measure (EM). This provides additional information about the dependence of line ratios and the mean squared densities of free electrons in the emitting region. Line ratios for positions s1 and s2 are plotted in Figs. 4 – 6. Table 2 gives an overview of averaged line ratios for the disk, the northern, and the southern halo. Representative logarithmic diagnostic diagrams for slit position s1 are displayed in Fig. 6. Diffuse emission can be traced spectroscopically in the northern halo out to 1.4 kpc and out to 1.3 kpc in the south. The line ratios [N ii]/ and [S ii]/ measured near the midplane of NGC 1963 are typical for H ii regions and show no conspicuous features. Both line ratios increase towards the outer halo (). They are well fitted by the DM94 model taking into account a composite model with 20% () + 80% (. is the fraction of neutral hydrogen at the outer border of the model nebula. If is high (radiation bounded case) nearly all emitted energy is absorbed by the geometry and only few stellar photons ionize hydrogen at the edge. A lower value of (matter bounded case) indicates that a significant fraction of ionizing photons escapes the geometry.
At both slit positions the averaged value for He i/ is (cf. Table 2). With respect to the error bars the DM94 model fails in predicting the correct ratios no matter which parameter set is chosen. This is also true for the shock sensitive line ratio [O i]/ at position s2. It follows that there is most likely a second excitation mechanism besides photoionization. As the diagnostic diagrams with [O i]6300 emission (see Fig. 6) reveal, this extraplanar source could be shock ionization.
| slit 1 | disk | halo (north) | halo (south) |
|---|---|---|---|
| kpc | kpc | ||
| [N ii]/ | 0.16 0.01 | 0.46 0.25 | 0.36 0.09 |
| [S ii]/ | 0.19 0.01 | 0.63 0.19 | 0.29 0.09 |
| He i/ | 0.05 0.01 | — | — |
| [O i]/[O iii] | 0.17 0.03 | — | — |
| [O i]/ | 0.05 0.01 | — | — |
| [O iii]/ | 2.20 0.18 | 1.53 0.29 | 0.83 0.52 |
| [O ii]/[O iii] | 2.06 0.34 | 3.89 1.57 | 6.57 2.00 |
| slit 2 | disk | halo (north) | halo (south) |
| kpc | kpc | ||
| [N ii]/ | 0.18 0.01 | 0.26 0.12 | 0.53 0.19 |
| [S ii]/ | 0.16 0.01 | 0.44 0.15 | 0.42 0.26 |
| He i/ | 0.05 0.01 | — | — |
| [O i]/[O iii] | 0.13 0.04 | 0.33 0.16 | 0.15 0.08 |
| [O i]/ | 0.04 0.01 | 0.12 0.05 | 0.09 0.05 |
| [O iii]/ | 1.79 0.23 | 0.78 0.44 | 0.65 0.48 |
| [O ii]/[O iii] | 2.90 0.64 | 6.88 2.51 | 6.91 2.63 |
The line ratios of [O iii]/ decrease with increasing (Fig. 6). This pattern is easily explained in photoinization models (e.g., Ma86) by the ionization stratification expected from the ionization potentials involved. However, recent observations in NGC 891 (Rand rand (1998)) show an increase of the line ratio of [O iii]/ with increasing distance from the midplane and therefore from the most likely location of the ionizing sources.
4.2 IC 2531
This galaxy of type Sb is perfectly edge-on and shows no prominent DIG emission at either of the slit positions. Only a single filament can be detected 20″ NE of slit s2 (cf. Rossa & Dettmar rossa (2000)).
| slit 1 | disk | halo (north) | halo (south) |
|---|---|---|---|
| kpc | kpc | ||
| [N ii]/ | 0.35 0.17 | 2.02 2.02 | 0.57 1.54 |
| slit 2 | disk | halo (north) | halo (south) |
| kpc | kpc | ||
| [N ii]/ | 0.38 0.07 | 0.80 0.33 | 0.21 0.16 |
Because the slits do not cut any bright H ii region the lack of emission lines is not surprising. For both slit positions only the line ratios of (Fig. 7) could be determined (see also Table 3) and therefore no diagnostic diagram could be obtained.
In view of a single line ratio and relatively large error bars (low S/N ratio) it is not reasonable to make any statements on possible excitation mechanisms of the DIG in IC 2531. The obtained values for the disk region seem to be reproducible by DM94. It is not possible to distinguish between a matter or radiation bounded geometry because both parameter ranges are able to fit the data. line emission can be traced at s1 out to 1.4 kpc in the northern and out to 1.0 kpc in the southern halo. At s2 the detection of diffuse emission reaches out to 1.3 kpc in the mean.
4.3 NGC 3044
| slit 1 | disk | halo (north) | halo (south) |
|---|---|---|---|
| kpc | kpc | ||
| [N ii]/ | 0.25 0.01 | 0.51 0.16 | 0.37 0.06 |
| [S ii]/ | 0.19 0.04 | 0.32 0.14 | 0.33 0.04 |
| He i/ | 0.04 0.01 | 0.08 0.03 | 0.06 0.02 |
| [O i]/[O iii]∗ | 0.17 0.03 | 0.27 0.09 | 0.54 0.13 |
| [O i]/ | 0.02 0.01 | 0.07 0.04 | 0.08 0.04 |
| [O iii]/ | 0.91 0.10 | 0.74 0.29 | 0.49 0.38 |
| [O ii]/[O iii] | 2.92 0.27 | 6.94 2.02 | 6.11 1.50 |
| slit 2 | disk | halo (north) | halo (south) |
| kpc | kpc | ||
| [N ii]/ | 0.24 0.01 | 0.28 0.07 | 0.35 0.04 |
| [S ii]/ | 0.19 0.01 | 0.41 0.09 | 0.64 0.11 |
| He i/ | 0.04 0.01 | 0.07 0.04 | 0.08 0.06 |
| [O i]/[O iii]∗ | 0.06 0.03 | 0.17 0.04 | — |
| [O i]/ | 0.04 0.01 | 0.05 0.03 | — |
| [O iii]/ | 1.66 0.10 | 0.87 0.27 | 1.15 0.37 |
| [O ii]/[O iii] | 2.45 0.42 | 6.39 1.38 | 5.73 1.56 |
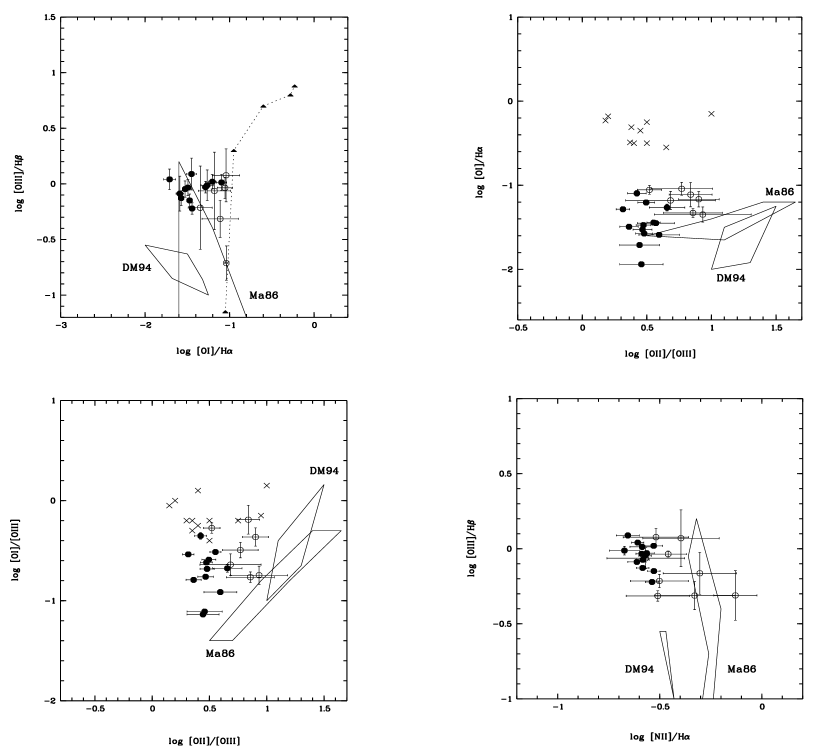
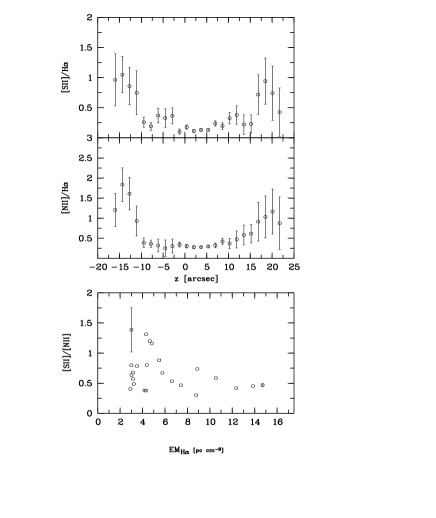
Besides NGC 1963 this galaxy shows the strongest diffuse extraplanar emission. Again, an image from Rossa & Dettmar was used to classify the DIG morphology as “bright” and “diffuse” (cf. Fig. 3). For NGC 3044 line ratios are presented in Figs. 9 – 11, and diagnostic diagrams are shown in Fig. 11. Averaged line ratios are given in Table 4. In this galaxy diffuse extraplanar H emission is detectable at slit s1 up to 15″ which corresponds to 1.3 kpc. At s2 the extraplanar DIG can be traced up to 1.6 kpc in the northern and up to 1.1 kpc in southern halo. All line ratios except that of [S ii]/H at slit s2 for NGC 3044 are well reproduced by the photoionization model from Ma86 or DM94 assuming a matter bounded case with and ( is proportional to the ratio of ionizing photon density to electron density cubed and also proportional to the ionization parameter ). In these models ionizing sources are O5 stars with temperatures of . This means that most of the hard Lyman continuum radiation from the star forming regions can escape and ionize the medium at high galactic latitudes. The above mentioned line ratio [S ii]/H reaches values of 0.80 0.16 at z 11″. This finding is in good agreement with the data obtained by Lehnert & Heckman (lehe (1995)). In diagnostic diagrams including the [O i] emission line (Fig. 11) the data for the halo fall into the gap between H ii regions and shock ionized objects. Additionally, the separation of disk and halo components is not as clear as in NGC 1963. The line ratio of [S ii]/H for the southern halo at s2, the position of our data in diagnostic diagrams (Fig. 11), and a moderate gradient in line ratios reveal the hybrid character of NGC 3044 regarding the excitation mechanism. Although photoionization seems to be the main ionizing source in this galaxy contributions due to shocks cannot be ruled out. Out to our detection limit we find again a decreasing ratio with increasing .
4.4 NGC 4302
No diffuse extraplanar line radiation is detectable in NGC 4302 at slit position s1 above . Slit s2 cuts the outer south western part of an extended H ii region. Therefore only faint and [N ii] 6583 emission from the disk can be detected. No empirical diagnostic diagram could be obtained. Averaged values for [N ii] 6583/ are shown for in Table 5, with 4″ corresponding to 360 pc. The DM94 model fails in predicting the measured data while the ”simplified” Ma86 model fits with respect to the error bars values up to 0.62 well. This assumes a diluted radiation field () and O5 stars () as ionizing sources. For values larger than 0.62, as observed in the outer disk, the Mathis models fail, too.
| slit 2 | disk center | outer disk (N) | outer disk (S) |
|---|---|---|---|
| [N ii]/ | 0.44 0.06 | 0.78 0.24 | 0.99 0.24 |
4.5 NGC 4402
An R-band image of NGC 4402 reveals that this galaxy is rich in dust and shows some spectacular dust filaments emerging from the south eastern and western parts of the disk. The corresponding image gives evidence that these filaments are connected with H ii regions (star forming regions) inside the disk. Our slit position has been chosen such that the star in the north of the galaxy falls onto the slit (Fig. 3). Despite of a “diffuse” DIG classification no emission lines in the blue wavelength domain could be detected. The measured line ratios are presented in Fig. 12 and averaged values are given in Table 6.
| slit 1 | disk | halo (north) | halo (south) |
|---|---|---|---|
| kpc | kpc | ||
| [N ii]/ | 0.30 0.05 | 0.76 0.34 | 1.07 0.29 |
| [S ii]/ | 0.15 0.04 | 0.50 0.24 | 0.62 0.18 |
For the disk region of NGC 4402 the DM94 model reproduces the observed ratios well. In order to fit the data one has to choose a matter bounded model () and a photon field with . Roughly 20 % of the ionizing photons escape from the H ii regions and are able to ionize sulfur and nitrogen in the halo. Higher values ( 0.9) for the halo are reproduced (with respect to the error bars) by the model of Ma86 using O5 stars as ionizing sources and a still softer radiation field (). Values of 0.62 for [N ii]/H and 0.61 for [S ii]/H are predicted. Ratios exceeding 0.9 lead to a model failure.
The steep gradient in [N ii]/H or [S ii]/H reaching values of 1 or higher at high cannot be explained in the framework of dilute photoionization models and may indicate again the need for an additional heating source.
4.6 NGC 4634
On the image for NGC 4634 a bright and extraplanar DIG layer is visible. Additionally, several filaments emerge mainly from the north-eastern part of the disk (see Fig. 3). Here again the slits had been positioned such that they contain stars for accurate positioning. Slit s1 cuts the brigthest H ii region 5″ north west of an extended dust cloud and s2 covers an area of fainter intensity 14″ north west of s1. As in NGC 4402, only the spectral lines of [N ii] 6549, 6583, , and [S ii] 6717, 6732 are measurable at both slit positions above . The corresponding line ratios are plotted in Figs. 13 and 14. Due to the non-detection of emission lines in the blue wavelength region no diagnostic diagrams could be created. In NGC 4634 DIG emission can be traced up to 1.2 kpc at slit position s1 and up to 0.9 kpc at s2. Measured line ratios of [N ii]/H for the disk area can be reproduced using the DM94 model and setting again to 0.10 and to . Only 10 % of hydrogen is neutral at the border that is 31 % of the ionizing photons can escape the geometry. The model fails again for values larger than 0.37. [S ii]/H values of the order 0.20 0.02 (cf. Table 7) are also not predicted by this geometry.


| slit 1 | disk | halo (north) | halo (south) |
|---|---|---|---|
| kpc | kpc | ||
| [N ii]/ | 0.39 0.02 | 0.79 0.21 | 0.80 0.18 |
| [S ii]/ | 0.22 0.02 | 0.69 0.19 | 0.62 0.18 |
| slit 2 | disk | halo (north) | halo (south) |
| kpc | kpc | ||
| [N ii]/ | 0.34 0.01 | 0.50 0.07 | 0.85 0.16 |
| [S ii]/ | 0.18 0.02 | 0.51 0.08 | 0.37 0.07 |
Additional information on ionization sources and resulting line ratios can only be made by using the simplified Ma86 model. Stars of spectral type O5 () are taken to be responsible for the ionization of the observed elements. Taking error bars into account halo values for [N ii]/H are well reproduced, as long as they are 0.62. Larger ratios lead to a failure of the model. Relative line strenghts of [S ii]/H (s1 and s2) are well fitted by Ma86. It produces values of 0.62 which is consistent with the measured data especially for slit position s1. Although precise statements on excitation mechanisms of the extraplanar DIG cannot be made with the present data, the failure of the photoionization models implies more than one ionizing/heating source.
4.7 Discussion
Recent studies of DIG in the Milky Way and several edge-on galaxies confirm a nearly constant trend for [S ii]/H vs. [N ii]/H (e.g., Haffner et al. haff (1999)) and also for [S ii]/[N ii] vs. (Rand rand (1998)). These observations cannot be reproduced by photoionization models which depend on the ionization parameter , because as [N ii]/H and [S ii]/H increase towards the halo, due to a diluted radiation field (smaller ), [S ii]/[N ii] increases, too. To explain this finding Reynolds et al. (rey99 (1999)) recently proposed an additional heating source that is proportional to and increases the electron temperature towards the outer halo.


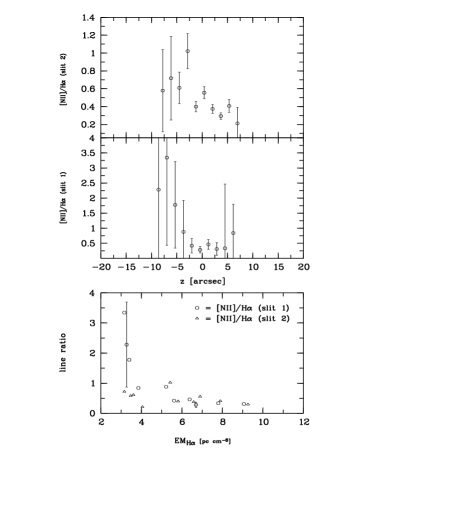
Ideas for possible heating processes reach from turbulent dissipation to magnetic reconnection. In the low density environment these processes would be more efficient than photoionization, thus providing the necessary heating rate to account for the shapes of the above mentioned line ratios and possibly also for the rise of [O iii]/H with z (Reynolds et al. rey99 (1999)). We present in Fig. 15 plots of [S ii]/H vs. [N ii]/H supporting a linear dependence. Since line ratios are given with respect to H intensities, this relation holds with respect to densities. If [S ii]/[N ii] line ratios are instead plotted vs. the geometrical unit z (Fig. 16) the scatter is much increased. In this presentation significant non-linear changes in [S ii]/[N ii] vs. z can be noticed. In some cases (NGC 3044, NGC 1963 and NGC 4634) the halo hemispheres may have different slopes which could be explained by, e.g., different metallicities (Haffner et al. haff (1999)). Plots of line ratios vs. emission measure EMHα as a first estimate of a density dependence (lower panels of Figs. 4,9,12, and 14) also support a non-linear trend.
As can be seen from Fig. 16 the ratio of [S ii]/[N ii] for NGC 1963 increases rapidly from 1.0 in the disk at to 1.6 at towards the halo. Values of 1.12 – 1.34 are predicted by DM94 assuming the same parameter setting as mentioned in Sect. 4.1 reflecting the observed data for the disk and the northern halo region well. For ratios less than 1 the chosen parameter set which previously reproduced [N ii]/ and [S ii]/ now leads to a model failure (southern halo, cf. Fig. 16). Alternative settings are also unable to fit observations. A likely physical reason could be a small scale fluctuation (increase) of the electron temperature due to a decrease in metallicity or density of the extraplanar DIG. Although the model cannot account for local density or metallicity variations the general trend of [N ii]/ or [S ii]/[N ii] is qualitatively well reproduced.
Compared to NGC 1963 the shape of [S ii]/[N ii] for NGC 3044 looks similar but reveals a lower starting value (0.67) and a non-linear gradient for (compare to Fig. 15 where the gradient seems to be linear). With respect to the mean errors, the observed ratios are again best represented by the DM94 model. The scatter in [S ii]/[N ii] (Fig. 16) at suggests that the electron temperature and most likely also the metallicity is a function of z, varying significantly on large scales ( 1 kpc). Within our sample NGC 1963 and NGC 3044 are showing the steepest gradients and largests mean values of [S ii]/[N ii], hence deviating from Rand’s observation in NGC 891.
The ratio of [S ii]/[N ii] for NGC 4402 (Fig. 15 or 16) reveals only a relatively flat gradient towards the halo. This result differs extremely from the one for NGC 1963 or NGC 3044, and is similar to the ratio found for NGC 891. It also indicates that none of our selected models can predict correct values, especially not for the most extreme points in this plot. It could be argued that diluted and very soft radiation is responsible for the observed values. However, this is not probable since [N ii] should be increased, too.
Haffner et al. (haff (1999)) have shown for the Milky Way that different slopes in [S ii]/H vs. [N ii]/H could be an indicator for different metallicities. As a result the individual gradients visible in Fig. 16 could indicate different metallicities for each halo hemisphere. If this is true NGC 4402 would have the same metallicity as the Milky Way or its ”twin” NGC 891.
The data for NGC 4634 in Fig. 16 are in agreement with Ma86 and demonstrate a constant run at 0.6 for the disk, followed by a relatively steep gradient. At the ratio appears to remain constant at 1.0. In the disk [S ii]/[N ii] is comparable to that of NGC 891 but with increasing this similarity fades.
In summary we note that strong nitrogen lines ( with respect to hydrogen) are generally not well reproduced by pure photoionization models. The general trend of [S ii]/[N ii] is reproduced qualitatively but not quantitatively (models cannot account for localized changes). They even fail in fitting oxygen and helium line ratios for the halo. The diagnostic diagram using [OIII] and [OI] for NGC 1963 indicates that shocks may contribute as an ionizing and heating source in the halo. This is similar to the finding of Martin (martin (1997)) for diffuse ionized gas in the outflows of dwarf galaxies. However, for the objects studied here, the discussed line ratios do not only change with geometrical distance from the midplane of the disk, i.e. with respect to the location of the suspected ionizing sources. We rather find sudden localized changes, most evidently in NGC 3044 and NGC 4402, indicating that ionization conditions and/or heating rates may change on length scales of a few hundred parsecs. These non-linear changes can also be seen in the correlation between [SII]/[NII] line ratios and emission measure (Figs. 4,9,12, or 14). Since they also correlate with the local density of the diffuse medium, these variations can only be explained by small scale density fluctuations.
4.8 Kinematics
In order to probe our results and to establish a relationship between excitation mechanisms and gas kinematics we have plotted in Fig. 17 an additional diagnostic diagram regarding line width (FWHM) vs. line ratio following, e.g., Lehnert & Heckman (leheck (1996)). We have chosen [N ii] 6583 as kinematical tracer since its higher mass minimizes thermal broadening. Only three target galaxies with nitrogen emission of Å-1 have been used for this plot. We point out that we did not correct for effects of kinematical line broadening. Thus, the data in Fig. 17 do not show the pure thermal line broadening. In order to establish nevertheless a relationship between ionization and gas dynamics we minimized the effect of kinematical line broadening in using only slit positions located near the center of each galaxy (s1 in NGC 1963, s1 in NGC 3044 and s2 in NGC 4634, cf. Fig. 3). A correction for the instrumental profile has been applied.

The spectral resolution has been determined to be 4.6Å by measuring the FWHM at different positions of HeAr calibration spectra. This translates into 210 km for the emission line, corresponding to 2.3 on a logarithmic scale. Because most data in Fig. 17 are located between 2.2 and 2.4 one has to be aware that only values larger than 2.3 (within the errors) have a significant physical meaning. We therefore checked for consistency in measuring FWHM of the [O i]6300 nightsky line in NGC 1963 and NGC 3044. Since this prominent emission feature is nearest to the [N ii] 6583 spectral line one thus obtains more precise values of the kinematical resolution. In the present case the parameter has to be modified slightly to 4.2 Å or 200 km , leading again to the same value as mentioned above. Fortunately we are interested in line broadening towards the halo and hence the main body of the data can be used for analysis.
For all galaxies plotted in Fig. 17 a clear correlation between gas kinematics and its ionization is visible. The broadening of lines at high galactic latitudes, even if less significant, supports a prominent large scale motion or increased turbulence of the ionized gas particles. Since this motion is tightly correlated to the ionization of the DIG it seems that in the halo of these galaxies shocks, superwinds or turbulent mixing layers as additional ionization or heating sources occur.
This can be seen very nicely in NGC 1963 where disk and halo data cover different regions. Additionally, the hybrid character of NGC 3044 becomes obvious, again. Line broadening suggests only very moderate shock contributions. Although for NGC 4634 the data allows no detailed diagnostics concerning possible ionization mechanisms Fig. 17 suggests that shocks (besides photoionization) could represent one possible additional excitation mechanism of the extraplanar DIG.
5 Summary and conclusions
Line ratios for the halos of NGC 1963, NGC 3044 and NGC 4634 can be explained as a combination of photoionization by O stars and shock ionization. Since the measured FWHM increases with height above the galactic plane the results obtained from Fig. 17 support our findings that shocks can contribute to the ionization of the extraplanar DIG. The photoionization models from Mathis and Domgörgen & Mathis are not always capable to reproduce all line ratios correctly (high [N ii] 6583/, [O i] 6300/, and [He i] 5876/). These models were developed to describe the measured line ratios for the Milky Way (Reynolds 1985a ,b). However the local environment near the sun is not necessarily representative for the more active regions in our target galaxies. Thus new models are required which should rest upon recently published extragalactic data and consider additional ionization/heating mechanisms such as shocks.
It is important to mention that the ratios for all galaxies in Fig. 16 are not constant over the whole range of and can vary significantly on small scales ( 250 pc). These results deviate from observations made e.g., by Golla et al. (gogode96 (1996)), Rand (rand (1998)), Otte & Dettmar (otde (1999)), or Haffner et al. (haff (1999)). Photoionization models can explain the general shape of but cannot account for individual changes (e.g., NGC 4402). In addition non-linear changes, as visible in Fig. 16, correlate with density and are explainable by small scale density fluctuations.
If variations in reflect variations in electron temperature, leading to , these fluctuations could be due to changing metal abundances or varying densities within the DIG. If different slopes in Fig. 15 or 16 are indicators of different metallicities (Haffner et al. haff (1999)), NGC 4402 would have the same metallicity as the Milky Way or NGC 891. In accordance with Lehnert & Heckman (leheck (1996)) a correlation between line ratios (ionization) and line widths (gas kinematics) could be established. Our results of a decrease of [O iii]/H with increasing and a significant scatter in [S ii]/[N ii] are different compared to recent measurements in NGC 891. All these aspects indicate that the ionization of the extraplanar DIG varies from galaxy to galaxy and within a galaxy.
Acknowledgements.
We thank D.J. Bomans, M. Rosa, H. Schulz, and R.A.M. Walterbos for helpful comments and enlightening discussions while writing the paper. Many thanks also to H. Domgörgen for obtaining the data and special thanks to F. Valdes at NOAO for his valuable help during data reduction. RT was supported by the DFG Graduiertenkolleg “The Magellanic System and Other Dwarf Galaxies”. This paper was finalized while RJD enjoyed a sabbatical at ESO/Garching.References
- (1) Baldwin J.A., Phillips M.M., Terlevich R., 1981, PASP 93, 5
- (2) Bottinelli L., Gouguenheim L., Paturel G. de Vaucouleurs G., 1984, A&AS 56, 381
- (3) Dahlem M., Petr M.G., Lehnert M.D., Heckman T.M., Ehle M., 1997, A&A 320, 731
- (4) Dettmar R.–J., 1992, Fund. Cosmic Phys. 15, 143
- (5) Dettmar R.–J., 1998, in: The Local Bubble and Beyond, Proceedings of the IAU Colloquium No. 166, Breitschwerdt, D. Freyberg, M. J., Trümper, J. (eds.), Springer LNP 506, p. 527
- (6) Dettmar R.–J., Schulz H., 1992, A&A 254, 25
- (7) de Vaucouleurs G., de Vaucouleurs A., Corwin J.R., Buta R.J., Paturel G., Fouque P., 1991, Third reference catalogue of bright galaxies (1991)
- (8) Domgörgen H., Dettmar R.–J., 1997, A&A 323, 391
- (9) Domgörgen H., Mathis J.S., 1994, ApJ 428, 647
- (10) Golla G., Dettmar R.–J., Domgörgen H., 1996, A&A 313, 439
- (11) Greenawalt B., Walterbos R.A.M., Braun R., 1997, ApJ 483, 666
- (12) Haffner L.M., Reynolds R.J., Tufte S.L., 1999, ApJ 523, 223
- (13) Lauberts A., Valentijn E.A., 1989, The Surface Photmetry Catalogue of the ESO-Uppsala Galaxies
- (14) Lehnert M.D., Heckman T.M., 1995, ApJS 97, 89
- (15) Lehnert M.D., Heckman T.M., 1996, ApJ 462, 651
- (16) Martin, C.L., 1997, ApJ 491, 561
- (17) Mathis J.S., 1986, ApJ 301, 423
- (18) Miller W.W., Cox D.P., 1993, ApJ 417, 579
- (19) Osterbrock D.E., 1989, Astrophysics of Gaseous Nebulae and Active Galactic Nuclei, University Science Books
- (20) Otte B., Dettmar R.-J., 1999, A&A 343, 705
- (21) Rand R.J., 1996, ApJ 462, 712
- (22) Rand R.J., 1997, ApJ 474, 129
- (23) Rand R.J., 1998, ApJ 501, 137
- (24) Reynolds R.J., 1985a, ApJ 294, 256
- (25) Reynolds R.J., 1985b, ApJ 298, L30
- (26) Reynolds R.J., 1993, AIP Conf. Proc. 278, Back to the Galaxy, ed. S.S. Holt & F. Verter, p. 156
- (27) Reynolds R.J., Haffner L.M., Tufte S.L., 1999, ApJ 525, L21
- (28) Rossa J., Dettmar. R.-J., 2000, A&A 359, 433
- (29) Shull J.M., McKee. C.F., 1979, ApJ 227, 131,
- (30) Teerikorpi P., Bottinelli L., Gouguenheim L., Paturel G., 1992, A&A 260, 17
- (31) Tüg H., 1977, ESO Messenger No. 11, p.7
- (32) Veilleux S., Osterbrock D.E., 1987, ApJS 63, 295