Why is the Fraction of Four-Image Radio Lens Systems So High?
Abstract
We investigate the frequency of two- and four-image gravitational lens systems in the Jodrell-VLA Astrometric Survey (JVAS) and Cosmic Lens All-Sky Survey (CLASS), and the possible implications for dark matter halo properties. A simple lensing statistics model, which describes lens galaxies as singular isothermal ellipsoids with a projected axis ratio distribution derived from the surface brightness ellipticities of early-type galaxies in the Coma cluster, is ruled out at the 98% level since it predicts too few four-image lenses (quads). We consider a range of factors that may be increasing the frequency of radio quads, including external shear fields, mass distributions flatter than the light, shallow lensing mass profiles, finite core radii, satellite galaxies, and alterations to the luminosity function for faint flat-spectrum radio sources. We find that none of these mechanisms provide a compelling solution to the quad problem on their own while remaining consistent with other observational constraints.
1 Introduction
Most arcsecond-scale gravitational lens systems consist of two or four images, consistent with a population of galaxies described by smooth and centrally-concentrated mass distributions (e.g. Blandford & Kochanek 1987). The number of lensed images provides important information about galaxies, their inner mass profiles, and potentially their environments. For example, observed image multiplicities have placed powerful bounds on the inner few kpc of lensing galaxy mass distributions, based on the absence of detectable central images (Rusin & Ma 2001; Norbury et al. 2001). These studies have demonstrated that the lensing mass is unlikely to fall off much more slowly than isothermal (). The relative frequency of two- and four-image systems is another key quantity, and offers a cosmology-independent check of the various assumptions made in both statistical and modeling studies of gravitational lensing.
Radially symmetric mass distributions produce two or three images, depending on the steepness of the profile and the existence of a core. Departures from spherical symmetry, either in the form of intrinsic ellipticity or external shear, allow for the creation of four- or five-image systems (Blandford & Kochanek 1987; Kormann, Schneider & Bartelmann 1994). The “standard model” of gravitational lensing statistics, which describes lensing galaxies as nearly singular isothermal deflectors with moderate ellipticities residing in rather small external shear fields, predicts that two-image lens systems should dominate four-image systems in the number counts. However, previous studies (King & Browne 1996; Kochanek 1996b) suggested that the fraction of four-image lens systems found in radio lens searches appears to be surprisingly high relative to what would be expected if the typical mass flattening of elliptical galaxies were similar to that of the light. In the most detailed analysis of this problem to date, Keeton, Kochanek & Seljak (1997; hereafter KKS) showed that the image multiplicities and mass models for a small sample of radio and optical lenses were not statistically inconsistent with an ellipticity distribution derived from the surface brightness axial ratios of elliptical (E) and S0 galaxies in the Coma cluster. Over the last several years, however, a large number of new gravitational lens systems have been discovered by the Cosmic Lens All-Sky Survey (CLASS; Myers et al. 1995, 1999, 2001). The fraction of quads is quite high in the expanded sample, again suggesting the possibility of a “quad problem.”
In this paper we re-examine the issue of image multiplicity using the largest homogeneously selected sample of radio-loud gravitational lenses, and investigate a wide range of factors that could be influencing the distribution of two- and four-image lens systems. §2 describes the lens sample and parent source population. §3 calculates the frequency of four-image systems predicted by singular isothermal ellipsoids (SIEs) following the ellipticity distribution of E/S0 galaxies in Coma, and confirms that there is a quad problem: the model fails to account for the large fraction of four-image lenses in the sample. In §4 we discuss potential solutions to the problem, quantifying the effect of flattened mass distributions, external shear fields, shallow lensing mass profiles, finite core radii, satellite galaxies, and alterations to the luminosity function for faint flat-spectrum radio sources. §5 briefly summarizes our results and discusses future work that might shed more light on this interesting issue.
2 Radio Lens Sample and Source Population
Lensing statistics calculations require a homogeneous sample with known selection criteria and a well-understood parent source population. The largest uniformly selected sample of gravitational lens systems belongs to the combined Jodrell-VLA Astrometric Survey (JVAS; Patnaik et al. 1992a; Browne et al. 1998; Wilkinson et al. 1998; King et al. 1999) and Cosmic Lens All-Sky Survey (CLASS; Myers et al. 1995, 1999, 2001). Using the Very Large Array (VLA), these surveys have imaged flat-spectrum (, ) radio sources down to a 5 GHz flux density of 30 mJy, with the aim of discovering new gravitational lens systems for a variety of cosmological and astrophysical studies. At least 18 new lenses have been discovered, and the final set of follow-up observations is nearly complete.
2.1 The Lenses
The list of JVAS/CLASS lenses is given in Table 1. This includes seven quads, seven doubles and the six-image system B1359+154 (Rusin et al. 2000, 2001b). B1933+503 (Sykes et al. 1998) contains ten total images of a multi-component source (four images each of the flat-spectrum core and one steep-spectrum lobe, plus two images of the other lobe). B1938+666 (King et al. 1997) contains six images of a core-jet source, with the core lensed into four images. B2114+022 (Augusto et al. 2001) features four compact radio components, but two of these could be associated with the lensing mass. In addition, recent CLASS radio follow-up observations have identified a strong two-image lens candidate that may be the final lens discovered in the JVAS/CLASS survey.
To ease the analysis of the radio data, we make cuts on the above sample. Four systems appear to be lensed by more than one primary galaxy: B1127+385 (Koopmans et al. 1999), B1359+154, B1608+656 (Koopmans & Fassnacht 1999) and B2114+022. We exclude these from our sample because compound mass distributions consisting of multiple galaxies of comparable masses complicate the expected image multiplicities (Kochanek & Apostolakis 1988; Rusin et al. 2001b). In addition, two systems are lensed by spirals rather than ellipticals: B0218+357 (Biggs et al. 1999) and B1600+434 (Koopmans, de Bruyn & Jackson 1998). These should also be excluded as we limit our multiplicity models to those consisting of early-type galaxies.111While some of the newer lenses in our sample do not have good morphologically- or spectroscopically-determined galaxy identifications at this time, the vast majority of known lenses are ellipticals (Kochanek et al. 2000). We will therefore assume that all of the galaxies not explicitly known to be spirals are early-type. Furthermore, while both B1933+503 and B1938+666 feature quadruply-imaged compact cores that contain more than 30 mJy of flux density at 5 GHz, the latter system was identified based on the observation of extended radio emission. Such lenses are likely to have different selection functions and magnification biases, so we remove B1938+666 from the sample. B1933+503 was identified from its quadruply-imaged core, so we count it as an additional quad. Finally, we assume that the one remaining strong lens candidate is a genuine two-image lens, and include it in this study. The sample we employ for our analysis therefore consists of seven quads and five doubles.
Several of the lenses we include in the sample are still more complicated than isolated galaxies. External shear can play an important role in determining the lensing properties of individual systems, and the potentials of at least four lenses have strong and identified shear contributors: B1422+231 (Hogg & Blandford 1994), B1600+434, B2045+265 (Fassnacht et al. 1999) and B2319+051 (Rusin et al. 2001a). Three additional lens systems – MG0414+054 (Schechter & Moore 1993), B1152+199 (Myers et al. 1999; Rusin et al. 2001c), and possibly B1030+074 (Xanthopoulos et al. 1998) – are dominated by large ellipticals, but also have faint satellite galaxies near the Einstein radius. In the case of MG0414+054, the companion plays an important role in the mass model, and is a necessary component for fitting the large number of constraints (Ros et al. 2000). We will explore the effect of large external shears and faint satellite galaxies in §4.
2.2 Source Luminosity Function
The image multiplicity distribution depends not only on the properties of lens galaxies, but also on the luminosity function of the parent source population (e.g. Turner, Ostriker & Gott 1984; Kochanek 1996b).222Unlike the total lensing optical depth, image multiplicities do not depend on cosmology or the redshifts of lenses and sources. These quantities merely scale the caustic structure of our simplistic deflectors in a self-similar way, thereby preserving the relative frequencies of different image geometries. Lensed sources are always magnified, and are therefore transferred to higher flux density bins. Consequently, some sources appear in a flux-limited sample only because they are lensed. This magnification bias can significantly increase the probability of observing a gravitational lens system, beyond the intrinsic optical depth. Bias alters the lensing probability of sources in a bin of total flux density () by the factor (Turner, Ostriker and Gott 1984; Maoz & Rix 1993)
| (1) |
where is the source luminosity function and is the distribution of total magnifications (, where the magnification of the th image is ) produced by a deflector for a certain class of imaging. Note that for a source population following a power-law luminosity function , the bias reduces to , independent of flux density. Therefore, source populations with steeper number-flux relationships and deflector models with larger average magnifications yield higher bias factors. The steepness of the number-flux relation is particularly important to a discussion of image multiplicities. Because four-image lens systems are, on average, more magnified than doubles, bias significantly enhances the fraction of quads in a sample relative to the ratio of areas within the two- and four-image caustic regions of a given deflector model.
The CLASS sample is dominated by sources with 5 GHz flux densities of mJy, while the brighter JVAS sample is limited to mJy. Due to the small number of JVAS/CLASS sources with measured redshifts (Marlow et al. 2000), there is little evidence for or against any redshift dependence of the number-flux relation, so we will follow Helbig et al. (1999) and assume that this is independent of redshift. We determine the approximate number-flux relation of flat-spectrum sources by fitting the 30 – 200 mJy sample to a power-law. We group the sources into bins of size mJy, and evaluate the fit statistic , where is the number of bins, is the number of sources in the th bin and is the number predicted by the power-law model. A plot of , normalized so that the best-fit model has , is plotted in Fig. 1. We find that (), and will assume throughout this paper unless specified. Note that the flat-spectrum CLASS sources have a steeper number-flux relation than predicted by the Dunlop & Peacock (1990) luminosity function ( for the faint sources relevant to this sample). Because both KKS and King & Browne (1996) assumed this shallower slope in their calculations, it is likely that they underestimated the expected fraction of quads in radio lens samples.
Magnification bias means that many CLASS lens systems are lensed from a source population that is an order of magnitude fainter than the nominal flux density cutoff of the survey. A complete statistical analysis of CLASS therefore requires an understanding of the flat-spectrum source population in the mJy range. Because very little is known about such faint radio sources, the direct measurement of the flat-spectrum radio luminosity function down to a few mJy is one of the key projects currently being undertaken by the CLASS Consortium for European Research on Extragalactic Surveys (CERES) team (McKean et al. 2001, in preparation). For this paper, however, we will make the simplest possible assumption: that the slope of the number-flux relation remains unchanged as we move to fainter flux density levels. Is such an assumption compatible with our observations? A simple quantitative check involves comparing the respective lensing rates of JVAS and CLASS. Because the surveys are lensed by the same galaxy population – and obviously probe the same cosmology! – the relative lensing rates depend only on the redshift distribution of the samples and the number-flux relations of the parent source populations. The redshift distribution of flat-spectrum sources in the mJy range has been investigated (Marlow et al. 2000) and appears to be quite similar to that of much brighter sources, though at a lower level of completeness. In fact, the mean redshift of flat-spectrum radio sources experiences remarkably little evolution over more than two orders of magnitude in flux density (Falco, Kochanek & Muñoz 1998; Marlow et al. 2000). Differences in the observed lensing rates should therefore be largely attributed to differences in the respective number-flux relations. However, preliminary results indicate that the lensing rate in the combined JVAS/CLASS sample () is compatible with that of the JVAS sample alone. We therefore believe that an assumption that the number-flux relation remains unchanged at low flux density levels is a reasonable and conservative one at this time.
3 A Simple Model for Image Multiplicities
In this section we test a simple model for predicting the frequency of different image geometries in radio lens surveys. The model is based on the following three assumptions: 1) elliptical lens galaxies can be described as singular isothermal ellipsoids, 2) the mass ellipticities of the E/S0 galaxy population at are similar to the light ellipticities of nearby cluster-bound early-type galaxies, and 3) the typical external shear fields in which lensing galaxies sit are negligible for statistical lensing considerations. We discuss the motivation for these assumptions, then determine whether the JVAS/CLASS multiplicity data is compatible with the model.
The first assumption concerns the mass distribution in lensing galaxies. Virtually all evidence from gravitational lensing, and in particular from the modeling of highly-constrained lens systems (Kochanek 1995; Grogin & Narayan 1996; Romanowsky & Kochanek 1999; Cohn et al. 2000), suggests that the lensing mass distribution of elliptical galaxies is close to isothermal. The isothermal paradigm for early-type galaxies is strongly supported by investigations of X-ray halos (Fabbiano 1989) and stellar dynamics (Rix et al. 1997). Furthermore, the absence of central images in deep radio maps of gravitational lens systems argues that the core radii must be quite small (e.g. Wallington & Narayan 1993; Kochanek 1996a), with the best constrained lenses requiring cores of less than a few tens of parsecs (Norbury et al. 2001). All lensing data are currently consistent with zero core radius.
We therefore approximate the lensing mass distribution in galaxies as a singular isothermal ellipsoid (SIE; Kormann, Schneider & Bartelmann 1994). For a galaxy with central velocity dispersion , the scaled surface mass density is
| (2) |
where , (with and the angular diameter distances from the lens to the source and from the observer to the source, respectively), is the axial ratio and is an additional ellipticity-dependent normalization factor. When comparing SIEs with different flattenings, the normalization should be chosen so that the circular velocity (or central line-of-sight stellar velocity dispersion) is independent of axial ratio (KKS). Following the arguments and calculations of KKS and Keeton & Kochanek (1998), we set . For simplicity all galaxies are assumed to be viewed edge-on. The lensing cross-section , and increases as the mass distribution is made flatter when the above normalization is employed.
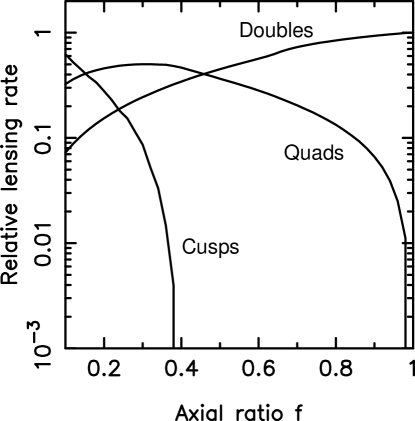
Fig. 2 concisely illustrates the effect of ellipticity on the lensing properties of singular isothermal deflectors. Spherical models have a single radial caustic curve on the source plane, inside of which two-image lens systems are formed. As the model is made more elliptical, a tangential (diamond) caustic emerges from the core and increases in size. Sources within both caustics produce four-image lens systems. Deflectors with small ellipticities preferentially produce two-image lens systems, but the fraction of quads increases rapidly as the mass distribution is flattened. The most elliptical deflectors are dominated by naked-cusp geometries, in which three bright images are formed on the same side of the lens with no counter-images. In this regime the number of quads is diluted, as some sources within the tangential caustic are now lensed into cusp configurations.
We tabulated the lensing properties of the SIE for via Monte Carlo simulations. For each , sources were placed randomly behind the mass distribution and the lens equation was numerically inverted using a modified downhill simplex optimization routine (Press et al. 1992) to solve for all image positions and magnifications. Our code makes use of the analytic deflection angles and shear vectors available for isothermal mass distributions (Kormann, Schneider & Bartelmann 1994). The cross-sections () and magnification biases () were then computed from this data for each class of imaging. The resolution of the simulations ensured that the relevant quantities were recovered to . We excluded from these calculations all lens systems with a magnification ratio between the brightest two images of greater than 15:1, in accordance with the flux ratio selection function appropriate for radio lens searches using the VLA. Because quads usually contain three relatively bright images while doubles often have one of their images significantly demagnified, the flux ratio cut rejects more two-image lens systems and will therefore slightly increase the fraction of quads. The relative lensing probabilities for doubles, quads, and naked-cusp configurations are shown in Fig. 3 as a function of axial ratio .
Second, we make the joint assumption that a) the projected mass axial ratios of early-type galaxies are similar to those of the light, and b) the population of galaxies at lensing redshifts () has similar ellipticities to the nearby cluster-bound population. Because the lensing mass of galaxies contains a substantial fraction of dark matter (e.g. Kochanek 1995), it is by no means necessary that the mass and light distributions have the same ellipticity. Investigations of polar-ring galaxies (Sackett et al. 1994; Combes & Arnaboldi 1995) and the X-ray halos of ellipticals (Buote & Canizares 1994, 1996) have suggested that dark matter halos may be quite flat (). This is in some conflict with recent N-body simulations incorporating gas dynamics (Cole & Lacey 1996), which indicate that CDM halos may be much rounder than previously suggested by Dubinski (1994). Both gravitational lens modeling and the statistics of image multiplicities are potentially powerful probes of the flattening of lensing mass distributions.
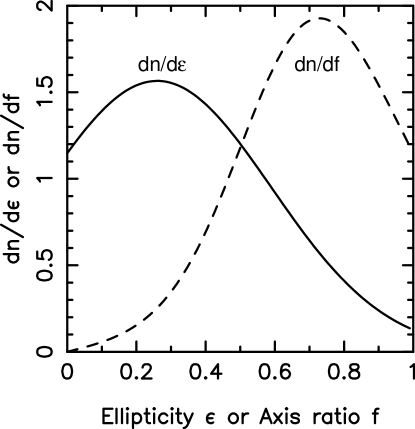
There is little evidence that distant early-type galaxies represent a different population than those found in nearby clusters. First, photometric studies by the CASTLES collaboration (Kochanek et al. 2000) demonstrate that lensing galaxies fall on the familiar fundamental plane. Second, the typical surface brightness axial ratios of lensing galaxies, which are found mostly in the field or poor groups (Keeton, Christlein & Zabludoff 2000), appear to be similarly distributed to those in the Coma cluster. Based on the measurements of Jorgensen & Franx (1994), KKS find that the Coma E/S0 galaxies are well described by a gaussian ellipticity distribution , where , and . This function is plotted in Fig. 4, and we will refer to the distribution as the “Coma ellipticity model.” We compare the Coma model with the surface brightness ellipticities of lensing galaxies listed in Keeton, Kochanek & Falco (1998) via a Kolmogorov-Smirnov test, and find that the two distributions are 76% compatible. Therefore, it is likely that the light ellipticities of lensing galaxies are drawn from a distribution similar to that of the the cluster-bound E/S0 galaxies in Coma.
The third assumption is that the external shear that typical lensing galaxies experience should be small. Using a shear model based on the galaxy-galaxy correlation function, which should be a good approximation if most lens galaxies are not embedded in groups or clusters (this is compatible with observations), KKS argue that galaxies tend to experience small external shears (), with only a small fraction of lenses () expected to have shear perturbations of . When external shears are small, the most important source of shear is internal, due to the ellipticity of the primary lensing galaxy itself. Furthermore, KKS claim that the influence of external shear on lensing cross-sections would be comparable to that of ellipticity only if the perturbations were about an order of magnitude larger than what is expected from their simple model. Optical observations and mass modeling of gravitational lens systems, however, suggest that the effect of nearby galaxies may be much higher than predicted by the correlation function model. Four lenses in our sample have significant and well-identified external shear contributors, which are required to provide reasonable fits to the image data. We will reopen the question of external shear fields in the following section, but for now will retain the assertion that shear fields are small enough to be insignificant to lensing statistics.
We now compute the fraction of four-image lens systems produced by a population of SIEs following the Coma ellipticity model. To accomplish this we integrate over the model to find the expected lensing optical depth (up to a constant) for each class of imaging:
| (3) |
where is the unbiased cross-section, is the magnification bias factor including the flux ratio cut, and is the normalized distribution of axial ratios derived from the Coma ellipticities (Fig. 4). We cut off the distribution at for all calculations. The fraction of lens systems of a given class is then simply . We find that the Coma model produces a quad fraction of . This value changes to if and if . The predicted quad fraction is much lower that the observed fraction of . (If the Dunlop & Peacock (1990) value of were assumed, , so the discrepancy would be worse.)
Since very flattened galaxies do not contribute significantly to the statistics of the SIE/Coma model, the probability of producing cusp-imaged triples is negligible. Therefore, the likelihood that a sample of radio lenses includes four-image systems is governed by binomial statistics:
| (4) |
Based on the above calculations, the probability for producing a set of lenses with fewer than quads is plotted in Fig. 5. The probability of our sample containing quads is 97.7%. In other words, the basic model for image multiplicities is ruled out at about the 98% level by the high fraction of four-image lenses in the JVAS/CLASS survey.
4 Why So Many Quads?
We have demonstrated that there exists a statistically significant overdensity of four-image lens systems in the JVAS/CLASS radio sample, despite that fact that the true number-flux relation of flat-spectrum radio sources leads to a higher quad fraction than predicted in previous analyses. We now consider a wide range of factors that may be increasing the frequency of quads, including flattened mass distributions, external shear, galaxy core radii, non-isothermal mass profiles, satellite galaxies, and a source luminosity function break below the CLASS survey cutoff. In each case we quantify the effect on the distribution of two- and four-image lens systems, and evaluate whether the corrections can account for the large number of quads found in the JVAS/CLASS survey while retaining consistency with other observations.
4.1 Very Flattened Dark Matter Halos
The most straightforward way of producing more quads is to make the mass distributions of lensing galaxies flatter than the light distributions of typical ellipticals. How flat must the characteristic galaxy mass distribution be to reproduce the JVAS/CLASS results? From Fig. 3 it is clear that the lensing data will bound the range of preferred SIE axial ratios on both ends. Large axial ratios will be excluded because they cannot produce a sufficient fraction of quads. Small axial ratios will be excluded because they are dominated by naked-cusp configurations, which are not observed in our sample (or anywhere).
To analyze the probability of a given projected axial ratio producing a sample of lenses with quads, doubles and zero naked-cusps, we employ the trinomial distribution. Therefore, if the fraction of doubles produced is , while that of quads is , the relative likelihood of the model is
| (5) |
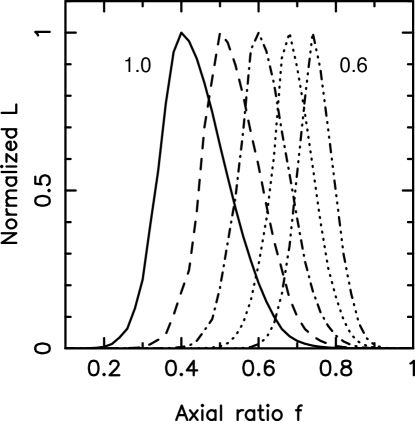
for the observed case where naked-cusp systems are absent. The results are plotted as part of Fig. 7d, normalized to the peak likelihood of unity. Using the SIE model, the JVAS/CLASS data require a typical mass axial ratio of (95% confidence).
While this solution has not been definitively ruled out, there are two potential inconsistencies with such flat mass distributions. First, analyses of mass-to-light ratios suggest that the lensing mass of galaxies contains approximately equal fractions of dark and luminous matter (e.g. Kochanek 1995; Jackson et al. 1998b). Because it is reasonable to assume that the mass distribution associated with the luminous component should have the same ellipticity as the light, extremely flattened dark matter distributions would be required to produce a total projected mass distribution with . No currently popular models of dark matter predict halos this flat (e.g. Cole & Lacey 1996; Davé et al. 2000). Second, if the mass distributions of galaxies are flatter than the light, there should be a systematic discrepancy between the mass axial ratios required by models of individual lens systems and the surface brightnesses of their lensing galaxies. Keeton, Kochanek & Falco (1998) present a variety of models and photometric data for more than a dozen systems lensed by early-type galaxies, and in most cases the mass and light ellipticities are consistent. An extensive and systematic modeling study of all gravitational lens systems should provide important evidence for or against the mass flattening hypothesis.
4.2 External Shear Fields
External shear can significantly affect the radial asymmetry of lensing potentials, and is an important component in models of highly-constrained lens systems (Hogg & Blandford 1994; Ros et al. 2000; Rusin et al. 2001a). KKS demonstrated that in many cases, lenses can be modeled equally well using either an SIE or a singular isothermal spheroid (SIS) plus shear. Furthermore, the models lead to similar quad-to-double ratios if , where is the magnitude of the external shear field. Intrinsically elliptical deflectors in external shear fields are more complicated, as one must consider the relative orientation angle () between the shear field and the galaxy major axis. When the internal and external shear axes are well-aligned (), the potential has a much larger effective ellipticity and more quads are formed relative to the pure SIE case. Misalignment has the opposite effect, and produces a “rounder” potential in which fewer quads can form. Therefore, one expects much of the effect of external shear to cancel out if the field is averaged over relative orientations, particularly for SIEs in which the internal shear term dominates ().
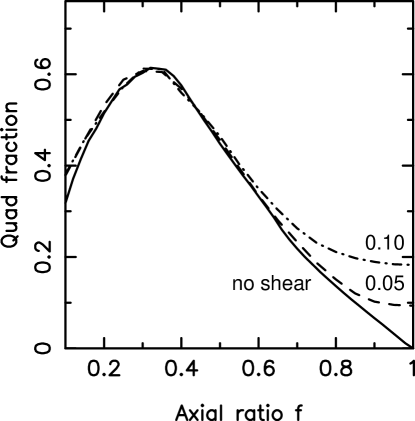
To evaluate the effect of shear on lensing statistics, we investigated the lensing properties of SIE deflectors in external shear fields of strength and . We repeated the trials for different orientation angles to , in increments of . Due to reflection symmetry, the analysis can be limited to a single quadrant. We then integrated the two- and four-image cross-sections over , assuming that the external shear is randomly oriented relative to the position angle of the galaxy major axis. The resulting frequency of quads, as a function of axial ratio , is plotted in Fig. 6. As anticipated, the effect of the random shear fields is limited to the regime of small ellipticity (). Integrating over the Coma ellipticity model, we find that for and for . In these cases, the probabilities of producing a 12-lens sample with fewer than 7 quads are 96.7% and 93.9%, respectively.
Estimates of the typical external shear fields experienced by lenses, both from the galaxy-galaxy correlation function (KKS) and large-scale structure (“cosmic shear”) studies (Barkana 1996), predict rather small shears. According to the KKS analysis, only of galaxies should experience shears in excess of . Assuming an isothermal model, is approximately the shear produced by an elliptical galaxy at a distance of from the primary deflector, or a group/cluster at . Because companions of this size have not been recognized for many lens galaxies, it is questionable whether the effects of shear alone can account for the high frequency of quads.
4.3 Core Radii
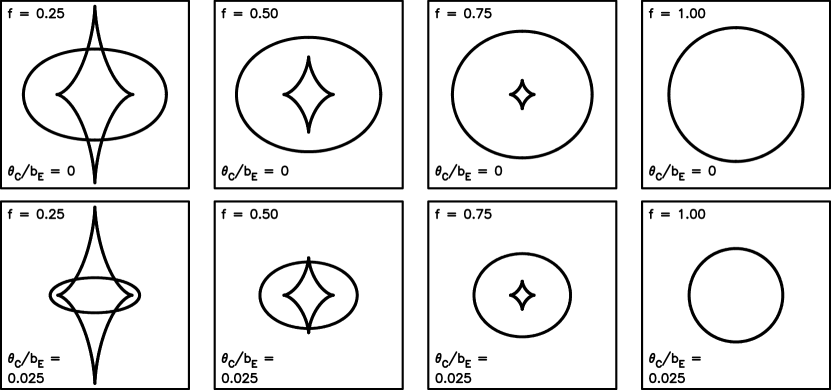
One can also increase the fraction of quads by decreasing the number of doubles produced by the deflector population. This may be achieved if the inner mass profile of lensing galaxies is shallower than isothermal, either by introducing a core radius or decreasing the power-law slope of the profile (Blandford & Kochanek 1987; Kassiola & Kovner 1993; Wallington & Narayan 1993; Kormann, Schneider & Bartelmann 1994). We will discuss cores first. Fig. 1 concisely illustrates the effect of core radii on lensing statistics. A core decreases the deflection angle near the center of the lens and thereby shrinks the size of the radial caustic, inside of which doubles form. However, the size of the tangential caustic depends only on the ellipticity of the potential, and is virtually undisturbed as the profile is modified. Consequently, for rounder deflectors, a core will tend to decrease the number of doubles while leaving the number of quads unmodified. For flatter deflectors, the smaller radial caustic attributed to the core implies that naked-cusp configurations become prominent at larger axial ratios. Because a fraction of the area inside the tangential caustic will form cusp systems, large cores dilute the quad fraction for high ellipticity deflectors.
Before continuing, we should note that introducing core radii to the isothermal model or decreasing the slope of the mass profile produces an additional lensed image near the center of the lensing galaxy (Rusin & Ma 2001; Norbury et al. 2001). The slower the mass distribution falls with radius, the brighter these images should appear. In this subsection, systems that we refer to as “doubles” and “quads” will actually contain an additional central component. Naked-cusp configurations still do not feature any counter-images. The absence of central images places powerful bounds on how far one can safely stray from a singular isothermal mass model, and we return to these priors below.
We consider the non-singular isothermal ellipsoid (NIE), which is described by the scaled surface mass density:
| (6) |
where is the angular core radius. The lensing properties of the NIE are determined by the axial ratio and the ratio between the core radius and the angular Einstein radius, . Again we performed a series of Monte Carlo simulations of the NIE over a grid of parameters (, ), calculating the cross-sections and magnification bias for each model. Angular core radii correspond to linear cores of several hundred parsecs at lensing redshifts, and are strongly ruled out by virtually all lensing data (Norbury et al. 2001). If , the deflector cannot produce multiple images (Kormann, Schneider & Bartelmann 1994). The magnification of the central image is included in the determination of the bias, and we make no cuts on its brightness.
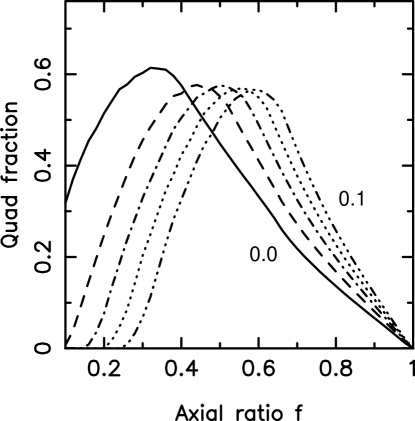
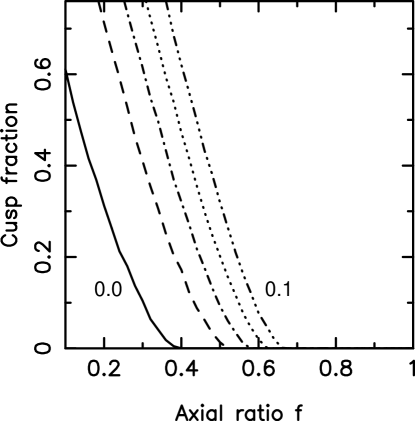
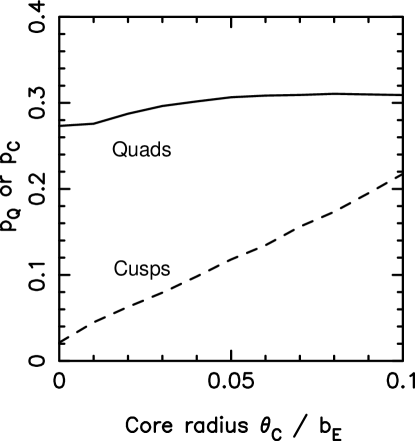
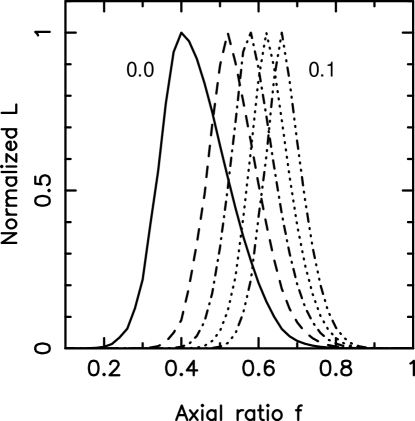
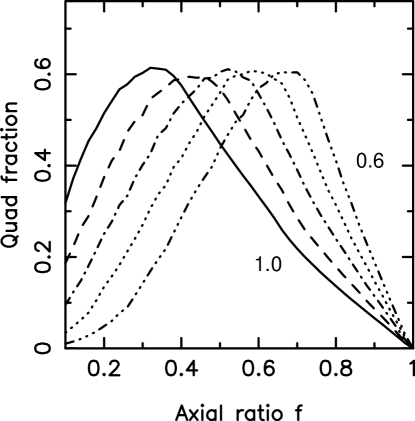
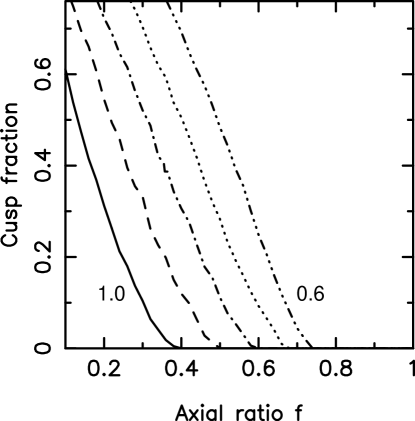
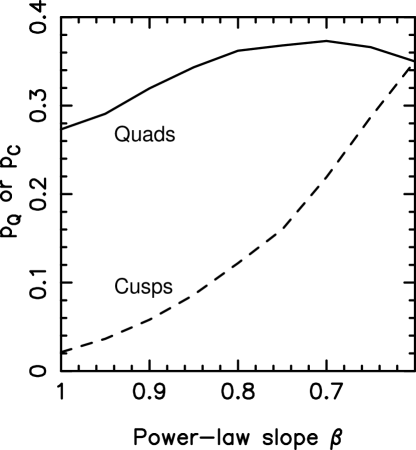
The frequency of quads as a function of is plotted for and in Fig. 7a. Adding large cores significantly increases the quad fraction for small to moderate ellipticities. For example, an deflector produces only 22% quads for the singular case, but this increases to 27% if and 43% if . However, the quad fraction is decreased at the high ellipticity end, as a large fraction of sources inside the tangential caustic form cusp-imaged triples (Fig. 7b). The total fractions of quads and cusps, integrated over the Coma ellipticity model, are plotted in Fig. 7c as a function of . Incredibly, the fraction of quads increases very little with increasing core radii. The effect is due to the specific parameters of Coma model, which lead to a dilution of quads at the high ellipticity end that almost completely cancels the increase in quads at the low ellipticity end. Therefore, if one assumes that the mass axial ratios of lensing galaxies are accurately described by the Coma model, any core radius does little to affect the overall fraction of quads produced. Finally, the typical axial ratios required to fit the lensing data, for various core radii, are calculated using (5) and plotted in Fig. 7d. Larger cores mean that the observed quad fraction can be reproduced at smaller characteristic ellipticities.
The lack of central images in deep maps of radio-loud gravitational lens systems implies that the core radii of lensing galaxies are unlikely to be very large. Norbury et al. (2001) use the absence of third images to constrain the size of the core in isothermal deflectors, and find that a number of lenses must have core radii smaller than a few tens of parsecs. For an elliptical at , (the smallest core we considered in the above simulations) corresponds to a linear core radius of pc assuming a flat cosmology with . Therefore, the extremely small cores allowed by lensing are unlikely to have any significant effect on the predicted image multiplicities.
4.4 Shallow Mass Profiles
Decreasing the power-law slope of the radial mass profile has a similar effect on the caustic structure as adding a core radius to an isothermal mass distribution (e.g. Rusin & Ma 2001). We consider singular mass distributions described by a power-law surface density of the form
| (7) |
where is the slope of the mass profile. For the isothermal case, . We performed Monte Carlo analyses of the lensing properties for the singular power-law ellipsoid (SPLE) as a function of and . Our calculations make use of the rapidly converging series solutions for the deflection angles and magnification matrices of power-law mass distributions derived by Barkana (1998) and implemented in the “FASTELL” software package. The results are plotted in Fig. 8. As was the case when adding cores to isothermal deflectors, decreasing the slope of the mass profile significantly increases the quad fraction for small ellipticities and dilutes it for large ones (Fig. 8a). Naked-cusp systems again become prominent at larger axial ratios as the mass distribution is made shallower (Fig. 8b). Assuming a Coma ellipticity distribution, the integrated fractions of quads and cusps are plotted in Fig. 8c, as a function . Once again, the Coma model cannot produce arbitrarily many quads. The typical axial ratios required to fit the lensing data, for various profiles, are calculated using (5) and plotted in Fig. 8d. It is interesting to note from Fig. 7a and 8a that regardless of axial ratio, core radius or mass profile, the largest fraction of quads any deflector can produce is . This was first pointed out by KKS for the singular isothermal case. Because the observed fraction of quads is nearly equal to this maximal value, the typical properties of galaxy mass distributions would have to be very finely tuned to fit the data. It is therefore not surprising that when integrating over a distribution of deflectors, we consistently fall far short of the preferred quad fraction. This is perhaps the most unsettling aspect of the quad problem.
The lack of detectable central images suggests that the mass distribution in lensing galaxies is unlikely to be much shallower than isothermal. Rusin & Ma (2001) demonstrate that the probability of finding no central images among the CLASS doubles falls off rapidly as the power-law mass profile is decreased, thereby strongly excluding characteristic profiles with . Moreover, direct modeling of highly-constrained lens systems (e.g. Kochanek 1995; Cohn et al. 2000), modern stellar dynamics (Rix et al. 1997) and X-ray halos (Fabbiano 1989) all suggest that the lensing mass distribution of early-type galaxies is close to isothermal. Therefore, shallow mass profiles are unlikely to be to blame for the large fraction of radio quads.
4.5 A Broken Faint-end Luminosity Function
Steeper luminosity functions lead to more four-image lens systems. As described in , the power-law number-flux law obeyed by flat-spectrum radio sources in the mJy range is tightly constrained to lie at . In our subsequent calculations, we made the assumption that the radio luminosity function in the mJy range is identical to that of the brighter CLASS sources, consistent with the relative lensing rates in JVAS and CLASS. Here we briefly evaluate our assumption in greater detail, exploring the possible effects of a faint-end luminosity function with a break below the CLASS cutoff.
Assuming that the mJy source population is well-described by , a break below mJy would have a maximal impact on the statistics of CLASS if it occurs right at the flux cutoff of the survey. We therefore investigate a broken power-law number-flux relation of the form
| (10) |
where mJy, the limiting CLASS 5 GHz flux density. A consequence of any luminosity function more complicated than a single power-law is that the magnification bias is no longer independent of source flux density. We therefore consider representative cases of and mJy for our calculations. We fix and revert back to the Coma/SIE model to investigate the effects of a broken luminosity function on the quad fraction and lensing rates.
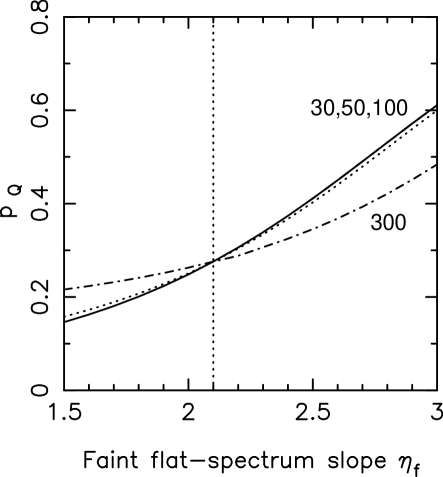
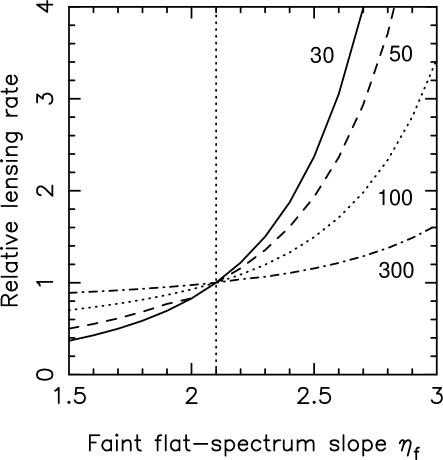
The predicted fraction of quads () is plotted against in Fig. 9a. As expected, steeper faint-end power-laws produce a larger number of quads than shallower ones, due to the increased magnification bias. The total lensing optical depth, relative to the unbroken case of , is shown in Fig. 9b. A larger also leads to a significantly increased lensing rate for the CLASS mJy sources. However, typical mJy JVAS sources are only slightly affected by the break. One requires for a moderately respectable quad fraction of in CLASS, but this will lead to a lensing rate among mJy sources that is more than twice that of the mJy population. Because the observed lensing rates in JVAS and CLASS are both , we conclude that modifications of the radio number-flux relation are unlikely to account for the high fraction of quads in our sample, while at the same time retaining consistency with the observed relative lensing rates. However, it is still very important to measure the faint-end luminosity function directly, for the purposes of both better investigating the quad problem and obtaining robust constraints on the cosmological density parameters through a full analysis of the CLASS survey statistics.
4.6 Faint Satellite Galaxies
Yet another possibility is that faint satellite galaxies are strongly affecting the caustic structure of lens systems. While lenses of nearly equal mass should not be common (Kochanek & Apostolakis 1988), many primary lens galaxies may have small satellites because the galaxy luminosity function diverges at the low luminosity end. Faint companions have been observed in several JVAS/CLASS lens systems – MG0414+054 (Schechter & Moore 1993), B1152+199 (Rusin et al. 2001c), and possibly B1030+074 (Xanthopoulos et al. 1998). For the highly-constrained four-image lens MG0414+054, the satellite is an important element of the lens model (Ros et al. 2000).
A systematic investigation of the influence of companion galaxies on the quad fraction would be extremely useful, but requires very computationally expensive simulations to sufficiently cover the large parameter space. While such a study is beyond the scope of this paper, we did perform a brief series of Monte Carlos to get a feel for the magnitude of the statistical correction due to companion galaxies. We modeled the primary galaxy as an SIE () with , and the satellite as an SIS. We considered cases with and , and assumed a flat cosmology with lens and source redshifts of and , respectively, to convert to real units. Based on the observed separation range of satellites, we placed the companions at , and from the center of the primary lens. We repeated the analysis for different relative orientation angles () between the major axis of the primary galaxy and the position angle of the satellite (), in increments of . We assumed randomly-oriented satellites and integrated over the position angles.
Satellites can have a large effect on the lensing properties for any particular orientation angle, greatly increasing the quad fraction when they are well-aligned with the major axis of the primary galaxy (), and decreasing it when they are anti-aligned (). Interaction between the SIE and SIS caustics can also produce more complex image configurations (see Rusin et al. 2001b). However, like shear, the orientation-integrated effect on quads is negligible. In five of the six sets of trials we undertook, the quad fraction increased by less than from the value predicted for an isolated SIE with (22%). For the case of and , the relative deflector strengths and separations produce significant overlap between the tangential caustic of the SIE and the radial caustic of the SIS. Sources sitting within one tangential and two radial caustics produce five observable images instead of four, and the quad fraction is attenuated to . We note that these fifth images are formed adjacent to the satellite and should be readily detectable, so the probability of confusing such systems with true quads is small. The superposition of caustics occurs for MG0414+054. We analyzed the caustic structure of the published SIE+SIS+shear model (Ros et al. 2000) and find that if the companion (SIS) is removed, the predicted quad fraction is . Including the companion results in a significant overlap of the SIE tangential and SIS radial caustics, decreasing the quad fraction to only . Therefore, in the case of MG0414+054, the system appears to be a quad not because of the satellite, but in spite of it.
From our preliminary analysis we find little evidence to suggest that faint companions are significantly increasing the quad fraction produced by moderate ellipticity galaxies. A more thorough numerical investigation of satellite galaxies is necessary for a full accounting of their statistical impact.
5 Discussion
We have investigated the distribution of image multiplicities in the JVAS/CLASS radio lens sample, and find that the large fraction of four-image gravitational lens systems poses some very interesting astrophysical questions. First we modeled early-type lensing galaxies at as a population of isothermal deflectors with a projected mass ellipticity distribution equal to that of the surface brightness ellipticities of E/S0 galaxies in the nearby Coma cluster. This is a reasonable assumption, as lensing galaxies have similar light ellipticities to the Coma sample. Our model predicts a quad fraction of , higher than the predictions of previous analyses that used a shallower flat-spectrum source luminosity function. However, the new prediction still falls far short of the quad fraction of the JVAS/CLASS sample, and would produce fewer than the observed number of quads of the time. The most basic model for image multiplicities is therefore excluded at about 98% confidence, confirming that the old quad problem, while not statistically severe, is stubbornly refusing to go away.
We next considered a range of potential solutions, effects that may be increasing the fraction of radio quads. One possibility is that the mass distributions of lensing galaxies are much flatter than the light of typical ellipticals. We find that a mass axial ratio of is required to fit the data. This solution may be problematic, as N-body simulations argue against such flattened dark matter halos, and lens modeling has thus far failed to present any convincing evidence that lensing mass distributions are systematically flatter than the light. Another possibility is that external shear fields are influencing the distribution of image multiplicities. If all lensing galaxies sit in rather large shear fields of , the quad fraction increases to only if the fields are randomly oriented. While shear of this magnitude does play an important role in the lensing potentials of several lens systems, external shear on its own is not likely to be the source of the discrepancy. We also considered increasing the quad fraction by decreasing the number of doubles produced by the deflector population. This can be achieved by introducing large cores or making the mass profiles of lensing galaxies shallower than isothermal. However, this is unlikely to be a viable solution, as the absence of central images in deep radio maps suggests that lensing mass distributions cannot be much shallower than isothermal, and cannot have significant core radii. Furthermore, while large cores or very shallow profiles can greatly enhance the number of quads in the small ellipticity regime, the Coma model is such that nearly an equal number of quads are lost in the high ellipticity regime. As a result, the quad fraction cannot be made arbitrarily large using the Coma ellipticities, even if large cores and shallow profiles were acceptable. We briefly investigated the effect of faint satellite galaxies on deflectors with moderate ellipticity, and find no significant changes to the quad fraction. More investigation of this important issue is required to solidify our preliminary conclusions. Finally, we considered modifications to the flat-spectrum source luminosity function below the 30 mJy 5 GHz cutoff of the CLASS survey. More quads can be produced if the number-flux relation grows steeper for low flux densities, but this will lead to a much larger lensing rate among the fainter CLASS sources than the brighter JVAS sources. The similar lensing rates in the surveys strongly argue against a steepening luminosity function below 30 mJy.
Perhaps the most disturbing possibility of all is that a number of two-image lens systems have remained unidentified in the JVAS/CLASS surveys. Could there exist some observational bias that favors the discovery of four-image systems over two-image systems? It is certainly true that a large fraction of quads can be identified from the JVAS/CLASS VLA survey maps alone, while virtually every two-image lens candidate requires an intense program of radio follow-ups to prove or disprove the lensing hypothesis (Myers et al. 2001). However, the selection of two-image candidates is very conservative, ensuring that even extremely unpromising sources are passed through at least one level of the high-resolution radio filter. Furthermore, deep radio imaging with the Multi-Element Radio-Linked Interferometer Network (MERLIN) and Very Long Baseline Array (VLBA) have proven themselves to be excellent tools for both confirming lens candidates through the detection of correlated milliarcsecond substructure in the radio components (e.g. Patnaik et al. 1995; Marlow et al. 2001; Rusin et al. 2001a), and in most cases disproving the lensing hypothesis through the observation of obvious core-jet morphologies. Any remaining ambiguous candidates are then observed optically in the attempt to detect a possible lensing galaxy. Therefore, while the confirmation of two-image lens candidates can be quite demanding, we have little reason to believe that the observational pipeline of CLASS is less than robust. In a particularly interesting turn of events, a reanalysis of the entire data set recently revealed a problem with the automatic candidate selection code that had actually been biasing against the identification of small four-image lens systems, due to the blending of closely-spaced components in the VLA survey maps (Phillips et al. 2000). A set of candidates selected with the upgraded code has resulted in the discovery of one additional CLASS lens – the quad B0128+437 (Phillips et al. 2000). We therefore believe that it is unlikely that selection effects can account for the large radio quad-to-double ratio.
In conclusion, none of the above-mentioned solutions to the quad problem are particularly satisfying on its own. Fortunately, future work is likely to shed new light on this mystery. A detailed and systematic modeling study of all gravitational lens systems should offer important evidence for or against the hypothesis that mass ellipticities trace the light. These same analyses may also help determine the typical shear fields in which gravitational lens galaxies reside. In addition, a reanalysis of the predicted image multiplicities may be worthwhile once the full radio luminosity function has been directly measured by programs currently being undertaken by the CLASS/CERES team. New well-selected lens samples, such those discovered as part of the PMN radio lens survey (Winn et al. 2000) and the Sloan Digital Sky Survey, should offer us greater statistical power in determining whether the large fraction of quads in JVAS/CLASS is telling us something about galaxies and their environments, or is merely a fluke.
References
- (1)
- (2) Augusto, P., et al. 2001, MNRAS, submitted
- (3)
- (4) Barkana, R. 1996, ApJ, 468, 17
- (5)
- (6) Barkana, R. 1998, ApJ, 502, 531
- (7)
- (8) Biggs, A.D., Browne, I.W.A., Helbig, P., Koopmans, L.V.E., Wilkinson, P.N., & Perley, R.A. 1999, MNRAS, 304, 349
- (9)
- (10) Blandford, R.D., & Kochanek, C.S. 1987, ApJ, 321, 658
- (11)
- (12) Browne, I.W.A., Wilkinson, P.N., Patnaik, A.R., & Wrobel, J.M. 1998, MNRAS, 293, 257
- (13)
- (14) Buote, D.A., & Canizares, C.R. 1994, ApJ, 427, 86
- (15)
- (16) Buote, D.A., & Canizares, C.R. 1996, ApJ, 457, 177
- (17)
- (18) Cohn, J.D., Kochanek, C.S., McLeod, B.A., & Keeton, C.R. 2001, ApJ, submitted (astro-ph/0008390)
- (19)
- (20) Cole, S., & Lacey, C. 1996, MNRAS, 281, 716
- (21)
- (22) Combes, F., & Arnaboldi, M. 1996, A&A, 305, 763
- (23)
- (24) Davé, R., Spergel, D.N., Steinhardt, P., & Wandelt, B.D. 2000, ApJ, 547, 574
- (25)
- (26) Dubinski, J. 1994, ApJ, 431, 617
- (27)
- (28) Dunlop, J.S., & Peacock, J.A. 1990, MNRAS, 247, 19
- (29)
- (30) Fabbiano, G. 1989, AR&A, 27, 87
- (31)
- (32) Falco, E.E., Kochanek, C.S., & Muñoz, J.A. 1998, ApJ, 494, 47
- (33)
- (34) Fassnacht, C.D., et al. 1999, AJ, 117, 658
- (35)
- (36) Grogin, N.A., & Narayan, R. 1996, ApJ, 464, 92
- (37)
- (38) Helbig, P.J., Marlow, D., Quast, R., Wilkinson, P.N., Browne, I.W.A., & Koopmans, L.V.E. 1999, A&A, 136, 297
- (39)
- (40) Hewitt, J.N., Turner, E.L., Lawrence, C.R., Schneider, D.P., & Brody, J.P. 1992, AJ, 104, 968
- (41)
- (42) Hogg, D.W., & Blandford, R.D. 1994, MNRAS, 268, 889
- (43)
- (44) Jackson, N., et al. 1995, MNRAS, 274L, 25
- (45)
- (46) Jackson, N., et al. 1998a, MNRAS, 296, 483
- (47)
- (48) Jackson, N., Helbig, P., Browne, I., Fassnacht, C.D., Koopmans, L., Marlow, D., & Wilkinson, P.N. 1998b, A&A, 334L, 33
- (49)
- (50) Jorgensen, I., & Franx, M. 1994, ApJ, 433, 553
- (51)
- (52) Kassiola, A., & Kovner, I. 1993, ApJ, 417, 450
- (53)
- (54) Keeton, C.R., Kochanek. C.S., & Seljak, U. 1997, ApJ, 482, 604
- (55)
- (56) Keeton, C.R., & Kochanek, C.S. 1998, ApJ, 495, 157
- (57)
- (58) Keeton, C.R., Kochanek, C.S., & Falco, E.E. 1998, ApJ, 509, 561
- (59)
- (60) Keeton, C.R., Christlein, D., & Zabludoff, A.I. 2000, ApJ, 545, 129
- (61)
- (62) King, L.J., & Browne, I.W.A 1996, MNRAS, 282, 67
- (63)
- (64) King, L.J., Browne, I.W.A., Muxlow, T.W.B., Narasimha, D., Patnaik, A.R., Porcas, R.W., & Wilkinson, P.N. 1997, MNRAS, 289, 450
- (65)
- (66) King, L.J., Browne, I.W.A., Marlow, D.R., Patnaik, A.R., & Wilkinson, P.N. 1999, MNRAS, 307, 225
- (67)
- (68) Kochanek, C.S. 1995, ApJ, 445, 559
- (69)
- (70) Kochanek, C.S. 1996a, ApJ, 466, 638
- (71)
- (72) Kochanek, C.S. 1996b, ApJ, 473, 595
- (73)
- (74) Kochanek, C.S., & Apostolakis, J. 1988, MNRAS, 235, 1073
- (75)
- (76) Kochanek, C.S., Falco, E.E., Impey, C.D., Léhar, J., McLeod, B.A., Rix, H.-R., Keeton, C.R., Muñoz, J.A., & Peng, C.Y. 2000, ApJ, 543, 131
- (77)
- (78) Koopmans, L.V.E., de Bruyn, A.G., & Jackson, N.J. 1998, MNRAS, 295, 534
- (79)
- (80) Koopmans, L.V.E., et al. 1999, MNRAS, 303, 727
- (81)
- (82) Koopmans, L.V.E., & Fassnacht, C.D. 1999, 527, 513
- (83)
- (84) Kormann, R., Schneider, P., & Bartelmann, M. 1994, A&A, 284, 285
- (85)
- (86) Maoz, D.,& Rix, H.-W. 1993, ApJ, 416, 425
- (87)
- (88) Marlow, D.R., et al. 1999, AJ, 118, 654
- (89)
- (90) Marlow, D.R., Rusin, D., Jackson, N.J., Wilkinson, P.N., Browne, I.W.A., & Koopmans, L. 2000, AJ, 119, 2629
- (91)
- (92) Marlow, D.R., et al. 2001, AJ, 121, 619
- (93)
- (94) Myers, S.T., et al. 1995, ApJ, 447L, 5
- (95)
- (96) Myers, S.T., et al. 1999, AJ, 117, 2565
- (97)
- (98) Myers, S.T., et al. 2001, AJ, submitted
- (99)
- (100) Norbury, M.A., Rusin, D., Jackson, N.J., Browne, I.W.A, & Wilkinson, P.N. 2001, MNRAS, submitted
- (101)
- (102) Patnaik, A.R., Browne, I.W.A., Wilkinson, P.N., & Wrobel, J.M. 1992a, MNRAS, 254, 655
- (103)
- (104) Patnaik, A.R., Browne, I.W.A., Walsh, D., Chaffee, F.H., & Foltz, C.B. 1992b, MNRAS, 259P, 1
- (105)
- (106) Patnaik, A.R., Browne, I.W.A., King, L.J., Muxlow, T.W.B., Walsh, D., & Wilkinson, P.N. 1993, MNRAS, 261, 435
- (107)
- (108) Patnaik, A.R., Porcas, R.W., & Browne, I.W.A. 1995, MNRAS, 274L, 5
- (109)
- (110) Phillips, P.M., et al. 2000, MNRAS, 319L, 7
- (111)
- (112) Press, W.H., Teukolsky, S.A., Vetterling, W.T., & Flannery, B.P 1992, Numerical Recipes in C (Cambridge: Cambridge University Press)
- (113)
- (114) Rix, H.-W., de Zeeuw, P.T., Cretton, N., van der Marel, R.P., & Carollo, C.M. 1997, ApJ, 488, 702
- (115)
- (116) Romanowsky, A.J., & Kochanek, C.S. 1999, ApJ, 516, 18
- (117)
- (118) Ros, E., Guirado, J.C., Marcaide, J.M., Pérez-Torres, M.A., Falco, E.E., Muñoz, J.A., Alberdi, A., & Lara, L. 2000, A&A, 362, 845
- (119)
- (120) Rusin, D., Hall, P.B., Nichol, R.C., Marlow, D.R., Richards, A.M.S., & Myers, S.T. 2000, ApJ, 533L, 89
- (121)
- (122) Rusin, D., & Ma, C.-P. 2001, ApJ, 549L, 33
- (123)
- (124) Rusin, D., et al. 2001a, AJ, in press (astro-ph/0104399)
- (125)
- (126) Rusin, D., et al. 2001b, ApJ, in press (astro-ph/0011505)
- (127)
- (128) Rusin, D., Norbury, M., Marlow, D.R., Jackson, N.J., Browne, I.W.A., Wilkinson, P.N., & Myers, S.T. 2001c, MNRAS submitted
- (129)
- (130) Sackett, P.D., Rix, H.-R., Jarvis, B.J., & Freeman, K.C. 1994, ApJ, 436, 629
- (131)
- (132) Schechter, P.L., & Moore, C.B. 1993, AJ, 105, 1
- (133)
- (134) Sykes, C.M., et al. 1998, MNRAS, 301, 310
- (135)
- (136) Turner, E.L., Ostriker, J.P., & Gott, J.R. 1984, ApJ, 284, 1
- (137)
- (138) Wallington, S., & Narayan, R. 1993, ApJ, 403, 517
- (139)
- (140) Wilkinson, P.N., Browne, I.W.A., Patnaik, A.R., Wrobel, J.M., & Sorathia, B. 1998, MNRAS, 300, 790
- (141)
- (142) Winn, J.N., et al. 2000, AJ, 120, 2868
- (143)
- (144) Xanthopoulos, E., et al. 1998, MNRAS, 300, 649
- (145)
| Survey | Lens | Images | Reference | Comments |
| CLASS | B0128+437 | 4 | Phillips et al. 2000 | no optical imaging |
| JVAS/MG | J0414+054 | 4 | Hewitt et al. 1992 | faint satellite |
| CLASS | B0712+472 | 4 | Jackson et al. 1998a | |
| JVAS | B1422+231 | 4 | Patnaik et al. 1992b | shear |
| CLASS | B1555+375 | 4 | Marlow et al. 1999 | no optical imaging |
| CLASS | B1608+656 | 4 | Myers et al. 1995 | compound |
| CLASS | B1933+503 | 4+4+2 | Sykes et al. 1998 | |
| CLASS | B2045+265 | 4 | Fassnacht et al. 1999 | shear |
| JVAS | B0218+357 | 2 | Patnaik et al. 1993 | spiral |
| CLASS | B0739+366 | 2 | Marlow et al. 2001 | |
| JVAS | B1030+074 | 2 | Xanthopoulos et al. 1998 | faint satellite |
| CLASS | B1127+385 | 2 | Koopmans et al. 1999 | compound |
| CLASS | B1152+199 | 2 | Myers et al. 1999 | faint satellite |
| CLASS | B1600+434 | 2 | Jackson et al. 1995 | spiral, shear |
| CLASS | B2319+051 | 2 | Rusin et al. 2001a | shear |
| CLASS | New lens | 2 | no optical imaging | |
| CLASS | B1359+154 | 6 | Rusin et al. 2001b | compound, shear |
| JVAS | B1938+666 | 4+2+ring | King et al. 1997 | |
| JVAS | B2114+022 | 2? 4? | Augusto et al. 2001 | compound |
 |
 |
 |
 |
 |
 |
 |
 |
 |
 |
 |
 |
 |
 |
 |