The Broad-Line and Narrow-Line Regions of the LINER NGC 4579111Based on observations with the NASA/ESA Hubble Space Telescope obtained at STScI, which is operated by AURA, Inc., under NASA contract NAS5-26555.
Abstract
We report the discovery of an extremely broad H emission line in the LINER nucleus of NGC 4579. From ground-based observations, the galaxy was previously known to contain a Type 1 nucleus with a broad H line of FWHM km s-1 and FWZI km s-1. New spectra obtained with the Hubble Space Telescope (HST) and a 02-wide slit reveal an H component with a FWZI of km s-1. The line is not obviously double-peaked, but it does possess “shoulders” on the red and blue sides which resemble the H profiles of double-peaked emitters such as NGC 4203 and NGC 4450. This similarity suggests that the very broad H profile in NGC 4579 may represent emission from an accretion disk. Three such objects have been found recently in two HST programs which have targeted a total of 30 galaxies, demonstrating that double-peaked or extremely broad-line emission in LINERs must be much more common than would be inferred from ground-based surveys. The ratio of the narrow [S II] 6716, 6731 lines shows a pronounced gradient indicating a steep rise in density toward the nucleus. The direct detection of a density gradient within the inner arcsecond of the narrow-line region confirms expectations from previous observations of linewidth-critical density correlations in several LINERs.
1 Introduction
In the twenty years since LINERs were first identified as a major component of the extragalactic population (Heckman, 1980), most research on these objects has been directed toward resolving the question of whether they represent a type of accretion-powered active galactic nucleus (AGN), or whether they are instead powered by purely stellar phenomena. The LINER class may be heterogeneous, but it is now very clear that at least some LINERs must be genuine AGNs (for a review, see Ho, 1999a). An exciting recent development has been the detection of very broad, double-peaked H emission lines in a handful of nearby LINERs (Storchi-Bergmann, Baldwin, & Wilson, 1993; Bower et al., 1996; Shields et al., 2000; Ho et al., 2000), a phenomenon which is most readily interpreted in terms of emission from a relativistic accretion disk.
NGC 4579 is a Virgo cluster Sb-type spiral with a redshift of km s-1 and a distance of 21 Mpc according to recent Tully-Fisher measurements (Gavazzi et al., 1999). It has long been known to host a LINER nucleus with broad wings on the H emission-line profile (Stauffer, 1982; Keel, 1983; Filippenko & Sargent, 1985). Using a ground-based spectrum obtained at the Palomar 5-m telescope, Ho et al. (1997b) found that the broad component of H has a full-width at half maximum (FWHM) of km s-1. Hubble Space Telescope (HST) Faint Object Spectrograph data have revealed substantially broader permitted lines in the ultraviolet (UV): for example, C IV 1549 has FWHM km s-1 and full-width at zero intensity (FWZI) of km s-1 (Barth et al., 1996). In this paper, we describe an HST optical spectrum of the NGC 4579 nucleus, which provides new insights into the properties of this low-luminosity AGN. Our analysis of the rather complex emission-line kinematics will be presented elsewhere.
2 Observations
We observed NGC 4579 with the Space Telescope Imaging Spectrograph (STIS) on 1999 April 21 UT as part of a program to study the emission-line kinematics of a sample of six nearby AGNs. The galaxy was observed at five parallel positions with the STIS 02-wide slit, with a gap of 005 between adjacent slit positions. Six spacecraft orbits were divided roughly equally among the five slit positions, and the exposure time for the central slit position was 2700 s. The telescope was oriented with the STIS slit at a position angle of 953.
The observations were obtained with the G750M grating and a tilt setting of 6300–6860 Å, giving coverage of [O I] 6300, 6363, the H+[N II] emission blend, and the [S II] 6716, 6731 doublet. For this setting, the point-source spectral resolution is Å. The CCD was read out in unbinned mode, for a pixel scale of 0.554 Å along the dispersion direction and 00507 along the spatial axis. Three separate exposures were combined with rejection of cosmic-ray hits. The data were calibrated by the standard pipeline at STScI. To remove remaining hot pixels, we performed one additional step of cleaning the data using a filtering algorithm which replaced deviant pixels with a local median value. The cleaned images were then geometrically rectified using the STIS calibration software.
3 Broad H Emission
3.1 Observed Properties
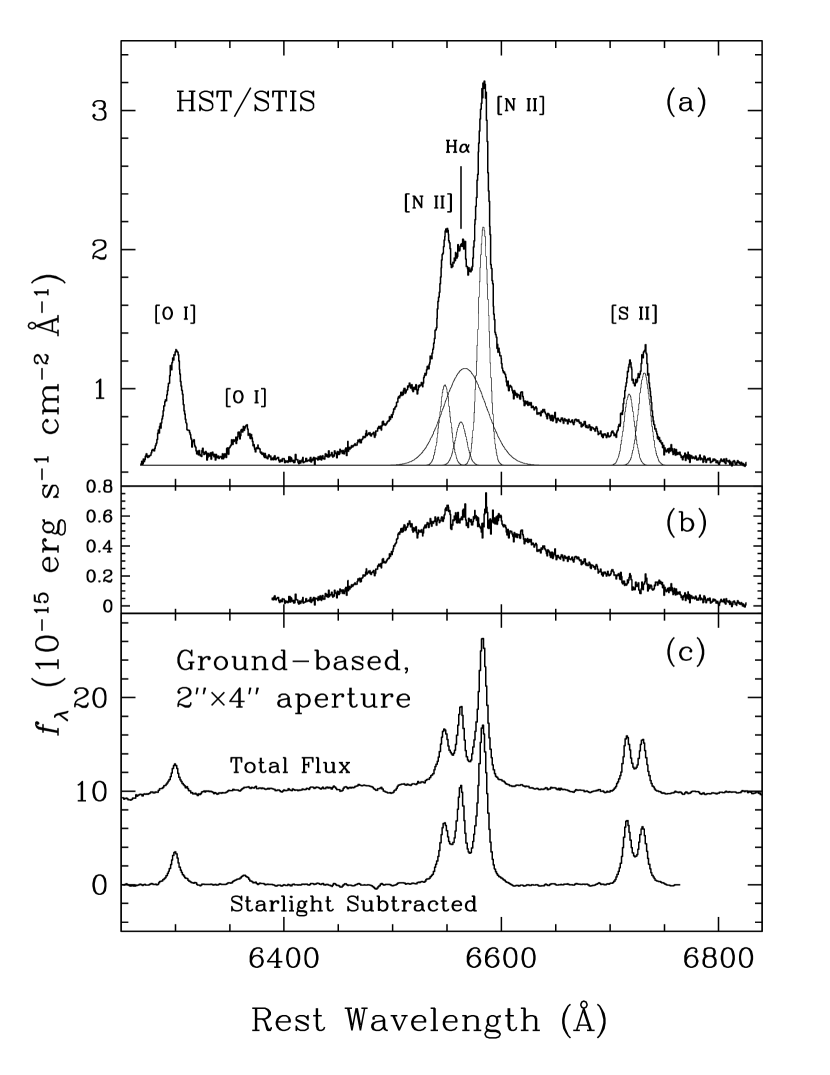
Figure 1 shows the HST spectrum of the NGC 4579 nucleus. The extraction is centered on the nucleus and is a sum of four CCD rows (02 total) in the 2-dimensional spectrum. The background level (including starlight from the galaxy bulge) is negligible in comparison with the nuclear brightness, and no background subtraction has been applied. In addition to the usual narrow-line features expected in a LINER spectrum, there is a surprisingly broad and asymmetric component to the H emission. On the blue side, the profile has a “shoulder” at 6520 Å, just blueward of the base of the [N II] 6548 line. The red side of the profile does not exhibit such well-defined features, although there is a shallow shoulder on the profile at Å. These shoulders are real features and not merely artifacts of the data reduction or geometric rectification, as they also appear in spectral extractions of the raw data, even for large extraction widths. The blue edge of the line appears to be at Å rest wavelength, while its red tail extends to the end of the spectrum at 6820 Å, giving FWZI km s-1. For comparison, Figure 1 also displays the ground-based spectrum from Ho, Filippenko, & Sargent (1997a), which was obtained at the Palomar 5-m telescope on 1984 February 12 UT.
We performed profile fits to remove the narrow-line contributions of H, [N II], and [S II]. To fit the narrow lines, we first fit a spline to the approximate shape of the very broad H emission profile, and subtracted this component from the spectrum, leaving only the narrow lines and a possible contribution from a “normal” broad H component. The [S II] doublet was fitted with a pair of Gaussians. For the H+[N II] blend, we used a four-Gaussian fit representing narrow and broad H and the two [N II] lines, which were constrained to have the same velocity width and a height ratio of 3:1. The narrow H, [N II], and [S II] lines have FWHM = 520–570 km s-1, while the normal broad component of H has FWHM = 2100 km s-1, very similar to the value of 2300 km s-1 found by Ho et al. (1997a).
After subtracting the fitted components, the remaining very broad component of H has erg cm-2 s-1, corresponding to a luminosity of erg s-1 for a distance of 21 Mpc. Since there have been no previous optical HST spectra of the NGC 4579 nucleus, it is not possible to determine whether this component has always been present or whether it is a transient feature. The amplitude of the broad feature is sufficiently low that it could be present but undetected in the Palomar spectrum. In general, it is extremely difficult to detect such broad, low-amplitude features in ground-based spectra, because of the overwhelming contamination by starlight from the bulge of the host galaxy. To make matters worse, elliptical galaxies and spiral bulges generally display a broad continuum hump in the region 6400-6700 Å (e.g., Filippenko & Sargent, 1985). The starlight subtraction method employed by Ho et al. (1997a) was designed to yield zero continuum flux in the subtracted spectrum, and this procedure could have removed a faint, very broad H feature by oversubtracting the stellar continuum template.
No other broad optical lines have been detected in NGC 4579, but the HST UV spectrum (taken in 1994 December) clearly demonstrates that other permitted lines are very broad as well. The UV spectrum has low signal-to-noise ratio (S/N) in the grating setting that covers Ly and C IV, but emission from background starlight in this wavelength range is negligible. As shown in Figure 2, the Ly and C IV profiles have blue wings which extend to km s-1 from the systemic velocity, comparable to the maximum extent of the blue wing of H. The red wing of H extends to velocities roughly 4000 km s-1 greater than the red wing of C IV. It is difficult to discern the maximum extent of the red wing of Ly due to the low S/N and a possible contribution from N V 1240, but Ly emission is seen out to perhaps km s-1 from the systemic velocity.
3.2 Relationship to the Central Engine
Double-peaked broad H emission lines have previously been detected in six LINERs as well as in several radio galaxies and radio-loud quasars; see Eracleous & Halpern (1994), Filippenko (1996), and Ho et al. (2000) for reviews of their properties. Models of emission from rotating, Keplerian accretion disks provide the best explanation for the origin of the double-peaked H lines in these objects (e.g., Halpern & Filippenko, 1988; Chen, Halpern, & Filippenko, 1989; Halpern et al., 1996; Storchi-Bergmann et al., 1997). The width of the broad-line profile in NGC 4579 is comparable to the linewidths in these double-peaked emitters, which have typical FWZI km s-1. While the NGC 4579 H profile is not clearly double-peaked, the shoulders at and 5000 km s-1 are very similar to the features detected in NGC 4203 (Shields et al., 2000) and NGC 4450 (Ho et al., 2000). The overall similarities in the line profiles suggest a common origin for the broad-line emission in these three galaxies. Their profile shoulders are much less pronounced than the broad humps in “classic” double-peaked emitters such as Arp 102b (e.g., Halpern & Filippenko, 1988), but Ho et al. (2000) have shown that a relativistic accretion disk model can fit the double-peaked profile in NGC 4450.
Assuming that the very broad emission from NGC 4579 originates in an accretion disk, the inner radius of the line-emitting portion of the disk can be estimated from the maximum velocity extent of the line. For a disk inclination of 45°, the projected velocity of the red wing of H ( km s-1) corresponds to a radius of 160 Schwarzschild radii (). The very broad line does not uniquely imply the presence of an accretion disk, however. Since the line does not possess a disklike, strongly double-peaked profile, other models may be able to explain the H profile. Spherical broad-line region (BLR) models incorporating radial outflows can produce line profiles with horns and shoulders as well as very broad wings (Robinson, Pérez, & Binette, 1990), qualitatively resembling the H profile in NGC 4579. In addition, the broad-line profiles produced by the outflow models possess an intermediate-width core similar in appearance to the “normal” broad-line component observed in NGC 4579. If the accretion disk model does apply to NGC 4579, then the intermediate-width component of H most likely originates in the “normal” BLR of NGC 4579 rather than in the accretion disk, as the disk alone will produce a double-horned rather than centrally peaked profile (e.g., Eracleous et al., 1995). Linewidths of km s-1 are typical for the broad H components seen in ground-based spectra of LINERs (Ho et al., 1997b).
Alternatively, models based on binary black holes (Gaskell, 1983) can also produce very broad, asymmetric emission-line profiles. Such models have been ruled out, at least for a few well-studied objects, because the velocities of the broad wings do not exhibit the pattern of long-term variability that would be expected from orbital motion of a close pair of black holes (Eracleous et al., 1997).
NGC 4579 shares other properties in common with the double-peaked emitters, most notably the overall shape of its spectral energy distribution (SED). In particular, NGC 4579 lacks a “big blue bump” component, and its radio-to-optical flux ratio qualifies it as radio-loud although its radio luminosity on an absolute scale is small (Ho, 1999b). Advection-dominated accretion flows (ADAFs; Narayan & Yi, 1994) have been proposed as an explanation for these properties, and Quataert et al. (1999) have shown that the SED of NGC 4579 can be explained by emission from a thin accretion disk with a transition at to an ADAF for the innermost accretion flow. By truncating the thin-disk portion of the accretion flow and removing the innermost, hottest portion of the thin disk, the models are able to produce an SED without a big blue bump. Interior to the truncation radius, the disk is presumed to evaporate into an ADAF, and this portion of the accretion flow generates the X-ray emission. The broad H linewidth is consistent with this scenario, as it requires the truncation radius of the thin disk to be at .
However, the value of used by Quataert et al. (1999) in modeling the SED of NGC 4579 is probably too low by an order of magnitude. The black-hole mass can be estimated using the recently discovered correlation between and bulge velocity dispersion (Ferrarese & Merritt, 2000; Gebhardt et al., 2000). Central velocity dispersion measurements for NGC 4579 range from 130 to 187 km s-1 (Whitmore, McElroy, & Tonry, 1985; González-Delgado & Pérez, 1996; Palacios et al., 1997; Héraudeau & Simien, 1998). Applying the Gebhardt et al. (2000) and Ferrarese & Merritt (2000) relations, the predicted black-hole mass is in the range .111In applying the Gebhardt et al. (2000) relation, we neglect the small () difference between the central velocity dispersion and the luminosity-weighted velocity dispersion within the effective radius, as spatially resolved measurements of are not available. The smaller value of used by Quataert et al. (1999) was a crude estimate based on the UV broad-line widths and ionization parameter (Barth et al., 1996), and the correlations probably predict the central mass more accurately. With this larger central mass, the model predictions for the SED are altered, and it may be possible to fit the UV/optical portion of the SED with a thin disk extending all the way in to , as described by Quataert et al. (1999) for the case of M81. It remains to be seen whether models of a truncated thin disk surrounding an ADAF can be constructed to simultaneously fit the UV/optical continuum and the X-ray luminosity of NGC 4579, for a central mass of .
Other evidence for an accretion disk in NGC 4579 is ambiguous. Iron K-line emission observed in ASCA spectra (Terashima et al., 1998, 2000) may originate from the inner accretion disk. However, the line does not clearly show a disk-like, relativistically broadened profile like those seen in some Seyfert 1 nuclei (e.g., Tanaka et al., 1995; Nandra et al., 1999), which would be expected if the disk extended all the way in to the black hole. Future X-ray observations with greater sensitivity and higher spectral resolution can better constrain the nature of the inner accretion flow and the possible presence of an ADAF.
4 Narrow-line Properties
Shock heating was the first mechanism proposed for the excitation of LINER narrow-line regions (NLRs), largely because observations of the [O III] 4959, 5007 and 4363 lines seemed to indicate electron temperatures higher than would be expected for photoionized gas (e.g., Koski & Osterbrock, 1976; Fosbury et al., 1978). Subsequent studies demonstrated that the observed [O III] line ratios could be reproduced by photoionization models provided that a high-density component ( cm-3) is present in the NLR to boost emission in the [O III] 4363 line (Filippenko & Halpern, 1984). Correlations between narrow-line width and critical density for collisional deexcitation (), found in several LINERs, support this hypothesis by demonstrating the probable presence of radial density gradients in the NLR (Filippenko & Halpern, 1984; Filippenko, 1985; Filippenko & Sargent, 1988). Due to the difficulty of obtaining spectra with subarcsecond spatial resolution, however, there has been little direct evidence (in the form of spatially resolved density measurements) for density stratification in LINERs. The STIS observations present an opportunity to revisit this issue, using the ratio of the [S II] 6716, 6731 lines as a density diagnostic.
Since the S/N of the observations is not sufficient for fitting the [S II] lines on a row-by-row basis, we performed multi-row extractions at several locations along the slit, for all five slit positions. When possible, we extracted regions corresponding to a well-defined cloud or clump. For each extraction region, we subtracted the local background level and fitted the [S II] doublet using a pair of Gaussians. The two components were assumed to have the same velocity width, except at the nucleus where the higher S/N permitted a fit with fewer constraints. The line ratios were then converted to an electron density at each position using the STSDAS task TEMDEN, for an assumed temperature of K. The [O I] 6300 line intensity was also measured by fitting a single Gaussian. Due to the large difference between the critical densities of the [S II] ( and cm-3) and [O I] ( cm-3) transitions, the intensity ratio of [O I]/[S II] is sensitive to the nebular density as well.
The results of these measurements are shown in Figure 3. The electron density measured from the [S II] lines rises from cm-3 in the outer parts of the NLR ( pc) to cm-3 at the nucleus. Overall, the trend of increasing toward the nucleus directly supports the picture of a radially stratified density in the NLR. Although the [S II] line ratio cannot probe densities greater than cm-3, the intensity and width of [O I] at the nucleus implies still greater densities in the inner NLR. The [O I]/[S II] ratio exhibits a sharp “spike” at the nucleus. Also, in the extraction centered on the nucleus, [O I] 6300 (FWHM = 930 km s-1) is nearly twice as broad as the [S II] lines (FWHM = 500 and 570 km s-1 for 6716 and 6731, respectively), indicating that the linewidth- relation continues to hold at the smallest radii resolvable by HST. The difference between the widths of the two [S II] lines in the nuclear extraction (an effect first seen in M81; Filippenko & Sargent, 1988) also demonstrates the presence of a linewidth- correlation within the inner pc.
A simple model for the density structure can be constructed under the assumption that the ionization parameter (defined as the ratio of ionizing photon density to electron density at the illuminated face of a cloud) is roughly independent of radius (Filippenko & Halpern, 1984). Then, . The assumption of constant is certainly an oversimplification, as the UV spectrum of NGC 4579 demonstrates that the NLR contains clouds with a range of values of and (Barth et al., 1996), and the observed values of show considerable scatter. However, the model curve shown in Figure 3 demonstrates that an density law approximates the general trend of density as a function of radius. The [S II] density in the nuclear extraction falls well below the model prediction, but as noted already, the [S II] ratio at the nucleus most likely underestimates the central density.
To confirm that the [O I]/[S II] ratio is indeed indicative of higher densities at the nucleus, we calculated a grid of photoionization models using Cloudy (Ferland et al., 1998) for a single, plane-parallel slab of solar-metallicity gas. Conditions were assumed to be typical of LINERs and of NGC 4579 in particular: an ionization parameter of and an ionizing continuum slope of (Barth et al., 1996). We find that [O I]/[S II] is only achieved at densities cm-3 for dust-free gas, or at cm-3 when gas-phase depletion and dust grains with a Galactic dust-to-gas mass ratio are included in the calculations. Thus, the observed [O I]/[S II] intensity ratio of at the nucleus indicates that continues to rise well above cm-3 within the unresolved, inner portion of the NLR, and the inferred density increases further for the high-velocity material which contributes to the wings of the [O I] profile.
5 Conclusions
STIS observations have recently revealed very broad double-peaked or double-shouldered broad H profiles in three LINERs: NGC 4203 (Shields et al., 2000) and NGC 4450 (Ho et al., 2000) from HST program GO-7361 (which observed a total of 24 targets), and NGC 4579 from program GO-7403 (with 6 targets observed). In contrast, no double-peaked emitters were found during the course of the Ho et al. (1997a) Palomar Observatory survey, which observed 486 nearby galaxies. Ground-based spectroscopy is apparently a very inefficient way to detect such features, except in much more luminous AGNs such as Arp 102B (Stauffer, Schild, & Keel, 1983) and Pictor A (Halpern & Eracleous, 1994). Among nearby ( Mpc), low-luminosity ( erg s-1) AGNs, NGC 1097 is the only example of a double-peaked emitter discovered from the ground (Storchi-Bergmann et al.1993). It is difficult to determine meaningful statistics on the incidence of broad double-peaked emission in the LINER population, but an HST spectroscopic survey of a larger sample of galaxies would provide useful constraints.
From the width of the very broad H line in NGC 4579, we infer an inner radius of for the line-emitting portion of the accretion disk. Alternatively, BLR models based on radial outflow rather than emission from a rotating disk may also be able to explain the observed H profile. Periodic HST monitoring of this galaxy (and other LINERs having double-peaked emission) would be valuable, as line-profile variability can provide tests of the accretion-disk and outflow models.
Finally, the direct detection of a radial density gradient within the inner NLR of NGC 4579 provides support for the interpretation of LINERs as photoionized AGNs.
References
- Barth et al. (1996) Barth, A. J., Reichert, G. A., Filippenko, A. V., Ho, L. C., Shields, J. C., Mushotzky, R. F., & Puchnarewicz, E. M. 1996, AJ, 112, 1829
- Bower et al. (1996) Bower, G. A., Wilson, A. S., Heckman, T. M., & Richstone, D. O. 1996, AJ, 111, 1901
- Chen, Halpern, & Filippenko (1989) Chen, K., Halpern, J. P, & Filippenko, A. V. 1989, ApJ, 339, 742
- Eracleous & Halpern (1994) Eracleous, M., & Halpern, J. P. 1994, ApJS, 90, 1
- Eracleous et al. (1997) Eracleous, M., Halpern, J. P,. Gilbert, A. M., Newman, J. A., & Filippenko, A. V. 1997, ApJ, 490, 216
- Eracleous et al. (1995) Eracleous, M., Livio, M., Halpern, J. P., & Storchi-Bergmann, T. 1995, ApJ, 438, 610
- Ferland et al. (1998) Ferland, G. J., Korista, K. T., Verner, D. A., Ferguson, J. W., Kingdon, J. B., & Verner, E. M. 1998, PASP, 110, 761
- Ferrarese & Merritt (2000) Ferrarese, L., & Merritt, D. 2000, ApJ, 539, L9
- Filippenko (1985) Filippenko, A. V. 1985, ApJ, 289, 475
- Filippenko (1996) Filippenko, A. V. 1996, in The Physics of LINERs in View of Recent Observations, ed. M. Eracleous, A. Koratkar, C. Leitherer, & L. Ho (San Francisco: ASP), 17
- Filippenko & Halpern (1984) Filippenko, A. V., & Halpern, J. P. 1984, ApJ, 285, 458
- Filippenko & Sargent (1985) Filippenko, A. V., & Sargent, W. L. W. 1985, ApJS, 57, 503
- Filippenko & Sargent (1988) Filippenko, A. V., & Sargent, W. L. W. 1988, ApJ, 324, 134
- Fosbury et al. (1978) Fosbury, R. A. E., Mebold, U., Goss, W. M., & Dopita, M. A. 1978, MNRAS, 183, 549
- Gaskell (1983) Gaskell, C. M. 1983, in Quasars and Gravitational Lenses; Proceedings of the Twenty-Fourth Liège International Astrophysical Colloquium (Cointe-Ougree: Univ. Liège), 473
- Gavazzi et al. (1999) Gavazzi, G., Boselli, A., Scodeggio, M., Pierini, D., & Belsole, B. 1999, MNRAS, 304, 595
- Gebhardt et al. (2000) Gebhardt, K., et al.2000, ApJ, 539, L13
- González-Delgado & Pérez (1996) González-Delgado, R. M., & Pérez, E. 1996, MNRAS, 281, 1105
- Halpern & Eracleous (1994) Halpern, J. P., & Eracleous, M. 1994, ApJ, 433, L17
- Halpern et al. (1996) Halpern, J. P., Eracleous, M., Filippenko, A. V., & Chen, K. 1996, ApJ, 485, 570
- Halpern & Filippenko (1988) Halpern, J. P., & Filippenko, A. V. 1988, Nature, 331, 46
- Heckman (1980) Heckman, T. M. 1980, A&A, 87, 152
- Héraudeau & Simien (1998) Héraudeau, Ph., & Simien, F. 1998, A&AS, 133, 317
- Ho (1999a) Ho, L. C. 1999a, in The AGN/Normal Galaxy Connection, ed. H. R. Schmitt, A. L. Kinney, & L. C. Ho (Oxford: Pergamon), 813
- Ho (1999b) Ho, L. C. 1999b, ApJ, 516, 672
- Ho et al. (1997a) Ho, L. C., Filippenko, A. V., & Sargent, W. L. W. 1997a, ApJS, 112, 315
- Ho et al. (1997b) Ho, L. C., Filippenko, A. V., Sargent, W. L. W., & Peng, C. Y. 1997b, ApJS, 112, 391
- Ho et al. (2000) Ho, L. C., Rudnick, G., Rix, H.-W., Shields, J. C., McIntosh, D. H., Filippenko, A. V., Sargent, W. L. W., & Eracleous, M. 2000, ApJ, in press.
- Keel (1983) Keel, W. C. 1983, ApJ, 269, 466
- Koski & Osterbrock (1976) Koski, A. T., & Osterbrock, D. E. 1976, ApJ, 203, L49
- Nandra et al. (1999) Nandra, K., George, I. M., Mushotzky, R. F., Turner, T. J., & Yaqoob, T. 1999, ApJ, 523, L17
- Narayan & Yi (1994) Narayan, R., & Yi, I. 1994, ApJ, 428, L13
- Palacios et al. (1997) Palacios, J., García-Vargas, M. L., Díaz, A., Terlevich, R., & Terlevich, E. 1997, A&A, 323, 749
- Quataert et al. (1999) Quataert, E., Di Matteo, T., Narayan, R., & Ho, L. C. 1999, ApJ, 525, L89
- Robinson, Pérez, & Binette (1990) Robinson, A., Pérez, E., & Binette, L. 1990, MNRAS, 246, 349
- Shields et al. (2000) Shields, J. C., Rix, H.-W., McIntosh, D. H., Ho, L. C., Rudnick, G., Filippenko, A. V., Sargent, W. L. W., & Sarzi, M. 2000, ApJ, 534, L27
- Stauffer (1982) Stauffer, J. R. 1982, ApJ, 262, 66
- Stauffer, Schild, & Keel (1983) Stauffer, J., Schild, R., & Keel, W. 1983, ApJ, 270, 465
- Storchi-Bergmann, Baldwin, & Wilson (1993) Storchi-Bergmann, T., Baldwin, J. A., & Wilson, A. S. 1993, ApJ, 410, L11
- Storchi-Bergmann et al. (1997) Storchi-Bergmann, T., Eracleous, M., Ruiz, M. T., Livio, M., Wilson, A. S., & Filippenko, A. V. 1997, ApJ, 489, 87
- Tanaka et al. (1995) Tanaka, Y., et al.1995, Nature, 375, 659
- Terashima et al. (1998) Terashima, Y., Kuneida, H., Misaki, K., Mushotzky, R. F., Ptak, A. F., & Reichert, G. A. 1998, ApJ, 503, 212
- Terashima et al. (2000) Terashima, Y., Ho, L. C., Ptak, A. F., Yaqoob, T., Kuneida, H., Misaki, H., & Serlemitsos, P. J. 2000, ApJ, 535, L79
- Whitmore, McElroy, & Tonry (1985) Whitmore, B. C., McElroy, D. B., & Tonry, J. L. 1985, ApJS, 59, 1