Kinematics and morphology of the Narrow-Line Region in the Seyfert galaxy NGC 1386 ††thanks: Based on observations collected at the European Southern Observatory, La Silla, Chile
Abstract
We present a high spatial and spectral resolution 2-D echelle spectrogram of the Narrow–Line Region in the Seyfert 2 galaxy NGC 1386. This Seyfert galaxy was observed with CASPEC in the wavelength range 5270–7725 Å which covers the H and the [N ii] lines. With the use of spatially high resolved images taken with the WFPC2 aboard the Hubble Space Telescope we could identify individual components of the Narrow–Line Region in our spectra. A Gaussian decomposition of the spectra revealed 9 distinct emission–line complexes. The brightest component is blue-shifted by with respect to the systemic velocity and shows an offset of relative to the nucleus of the galaxy. The true nucleus of NGC 1386 has a much lower apparent H luminosity than this component. The nucleus is probably highly absorbed. Although the majority of the Narrow–Line Region components follows a regular velocity field, we find evidence for a separate kinematic component. The Narrow–Line Region is aligned anti–parallel to the radio–jet which propagates from the center of NGC 1386 to the south.
Key Words.:
galaxies: active – galaxies: Seyfert – galaxies: individual: NGC 1386 – galaxies: kinematics and dynamics – galaxies: structure1 Introduction
The emission line regions of active galactic nuclei (AGN) can be divided into the Broad–Line Region (BLR) and the Narrow–Line Region (NLR). The study of velocity fields of the narrow emission–line region in nearby AGN offers an exciting perspective to study details of the circumnuclear kinematics. Besides the primary component, which is given by the rotation of the galaxy, additional velocity components are likely to be present. Especially, in AGN velocity components, such as inflow or outflow motions, may be superimposed onto the regular rotational velocity field (e.g., Osterbrock Osterbrock (1993)). The morphology of the ionized gas component often coincides with radio structures, seen in VLA maps (e.g., Ulvestad & Wilson UW (1984); Pogge RWP (1989)). Such extended radio structures (e.g., radio jets) are often aligned with the optical emission (cf. Capetti et al. Capetti3 (1997); Gallimore et al. GBD (1996)).
First hints for a complex structure of the emission line region of AGN were mentioned by Walker (quoted by Burbidge et al. BBP (1959)) in NGC 4151 und NGC 1068. In the late 60s and later on particularly for NGC 1068 strong indication for a structured emission line region und indiviual substructures were found (Walker W68 (1968); Anderson A70 (1970); Glaspey et al. 1976 a , b; Alloin et al. APBS (1983)). Recent investigations of nearby Seyfert galaxies with high spatial resolution, as it is achieved with the Hubble Space Telescope (HST), showed that it is feasible to resolve individual NLR components in the nearest Seyfert galaxies (e.g., NGC 1068, Macchetto et al. Macchetto (1994); NGC 4151, Winge et al. Wi97 (1997); Mkn 3, Mkn 78, Mkn 348, Capetti et al. Ca95 (1995), 1996 b ) on scales as small as 01. In the case of NGC 1068 the morphology of the NLR can be characterized as a clumpy structure of several dozen individual emission line knots.
1.1 NGC 1386
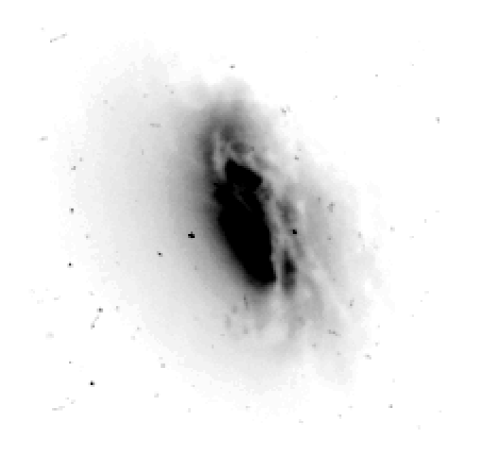
The galaxy NGC 1386 (Fig. 1) has been classified as a Seyfert type 2 galaxy by Phillips & Frogel (PF (1980)). The spectra show characteristic strong emission lines of H, H, [N ii], and [O iii] with expected line ratios and line widths typical for a Seyfert nucleus.
| Galaxy | R. A. (J 2000)111All data have been taken or have been calculated from the RC 3 (de Vaucouleurs et al. Vau91 (1991)), except where indicated | Dec. (J 2000) | Hubble type222taken from Weaver et al. (WWB (1991)) | AGN type | 333taken from Huchtmeier & Richter (HR (1989)) | 444taken from the NASA Extragalactic Database (NED) | |||
| NGC 1386 | Sa | Sy 2 | 12.2 Mpc | 11.24 |
There is some debate on the morphological galaxy type, whether it is Sa or S0, due to the relatively high inclination of . Tully (Tully (1988)) lists it as S0 while generally a Sa classification is assumed (e.g., Sandage & Tammann ST (1981); Weaver et al. WWB (1991)). The assumption from the Weaver et al. study was based on the line ratios found for the outer regions of NGC 1386 which were characteristic of H ii regions. In the recent literature one can also find classifications with SB0+ (Tsvetanov & Petrosian TP (1995)), although there are no clear indications for the existence of a bar.
Since attention was first paid on this galaxy, there was some uncertainty whether NGC 1386 belongs to the Fornax galaxy cluster or not. Huchtmeier & Richter (HR (1989)) list a heliocentric corrected systemic velocity of , derived from H i measurements which is in agreement with the value of obtained by Weaver et al. (WWB (1991)), as derived from the rotation curve.
We assume a Hubble parameter, that will be used throughout this paper, of . Assuming no effect from the Fornax Cluster the radial velocity, obtained by Huchtmeier & Richter (HR (1989)), translates to a distance to NGC 1386 of 12.2 Mpc. Basic data on NGC 1386 are listed in Table 1.
The distance to the Fornax Cluster has been determined by McMillan et al. (McMillan (1993)), using the Planetary Nebula Luminosity Function (PNLF). From their study of three member galaxies of the Fornax Cluster they derived a distance of . This value is coincident with the value that Tully (Tully (1988)) listed in his Nearby Galaxies Catalog. More recent measurements using Cepheid based distances yielded Mpc (Madore et al. Ma99 (1999)). They also derived a mean velocity of the Fornax Cluster of with . We therefore assume that NGC 1386 is located in the foreground of the Fornax Cluster.
Being one of the closest Seyfert nuclei, NGC 1386 is an ideal candidate for high spectral and spatial resolution investigations of the NLR, and we therefore chose NGC 1386 for a detailed investigation of the NLR kinematics and morphology. One of the techniques applied to this object class besides narrowband imaging (e.g., Evans et al. Evans (1991); Lynds et al. Lynds (1991); Pogge & De Robertis Pogge (1993)) is the speckle masking method (e.g., Mauder et al. Mauder (1992)), although there are alternative techniques that have already been applied to the nearest Seyfert galaxies successfully (e.g., Wagner & Appenzeller SWIA (1988); Dietrich & Wagner DW (1998)). However, the first attempt to resolve individual NLR components within NGC 1386 was made using speckle masking observations (Mauder et al. Mauder (1992)). From their study it was inferred that the morphology of the gas distribution is cone–like.
Weaver et al. (WWB (1991)) studied the NLR in NGC 1386 with medium spectral resolution. They reported on the velocity field as a combination of a normally rotating component and a component undergoing high velocity infall or outflow, as derived from the shape and width of the line profiles. The line width amounts to at the nucleus with a double peak line profile. These measurements are in agreement with our better resolved line profiles (due to higher spectral and spatial resolution) which yield a FWHM of . Furthermore, they reported that the optical nucleus is displaced from the kinematical center of the rotation curve by which corresponds to 60–90 pc.
2 Observations and data reduction
2.1 Echelle spectroscopy
The Seyfert galaxy NGC 1386 was observed at ESO La Silla, Chile (Nov. 16, 1992) with the Cassegrain Echelle Spectrograph (CASPEC) attached to the ESO 3.6m telescope. The achieved spectral resolution with the short camera is which corresponds to . With the use of the red cross-disperser the echelle spectrum covers the range 5270–7725 Å. The slit covered an area of and was oriented at p.a. . The CCD chip, a TEK 512M–12 with pixels of 27m offers a spatial scale of . The NGC 1386 spectrum had an integration time of 5400 sec.
The data reduction was performed with the IRAF555IRAF is distributed by the National Optical Astronomy Observatories, which is operated by the Association of Universities for Research in Astronomy, Inc. (AURA) under cooperative agreement with the National Science Foundation. and MIDAS666Munich Image Data Analysis System, distributed by ESO software packages. The spectrum was bias corrected creating a master bias which was subtracted from the spectrum. The tracing was determined from standard star exposures. In this process a Chebychev polynomial of order was fitted along the dispersion axis of each aperture. The master trace was defined by the spectrum with the smallest rms deviations. The echelle spectrum was then background corrected making use of the interorder sections of the 2D echelle spectrogram.
The flatfield correction was done in two different steps. Due to spatial offsets and different slit lengths, we had to create several groups of flatfields. The internal scatter of the spatial offsets was less than 1 pix within a flatfield group. The deviation between the individual flatfield groups had offsets of the order of 2 pix. For each group a normalized flatfield was computed which were used to correct for overall sensitivity variations of the corresponding science frames. Due to the flexure of the spectrograph the echelle object spectra had small offsets with respect to the corresponding flatfield exposure. Hence, we were forced to restrict the 2D flatfield correction to the inner 3″while the 15 wide stripes above and below this region were not corrected in this step. The normalized flatfield was set to unity for the region of these stripes. The criterium for the selection of these scans based on an intensity of less than 50 % of the maximal intensity on the position of the individual scan. In the second step the final extracted 1D spectra of the inner 6″of the individual spatial scans were flatfield corrected with a 1D flatfield generated. It was created by normalizing the individual scans of the used flatfield for the 2D correction with the average 1D flatfield of it. Finally we are able to make use of the 2D echelle spectrograms covering the NLR gas of NGC 1386 out to a radius of from the nucleus.
Subsequently the data were wavelength calibrated by using a ThAr lamp reference spectrum. The unit step was set to 0.1464 Å. The scatter of our wavelength calibration had an rms of 0.014 Å. The spectral resolution of our spectra was obtained from measurements of several night–sky lines in our spectra and was found to be 0.3 Å. A final flux calibration was applied using the standard HR 3454 ( Hya) which was reduced in the same way as the 2-D spectrum of NGC 1386. The extracted spectrum was finally merged and a two-dimensional image was created from the 11 pixel scans. To correct for the effect of slit illumination, we divided our 2-D galaxy echelle–spectrogram by an identically processed normalized sky–flatfield exposure. Finally a cosmics correction was applied to the spectrum using the MIDAS modify/gcurs routine.
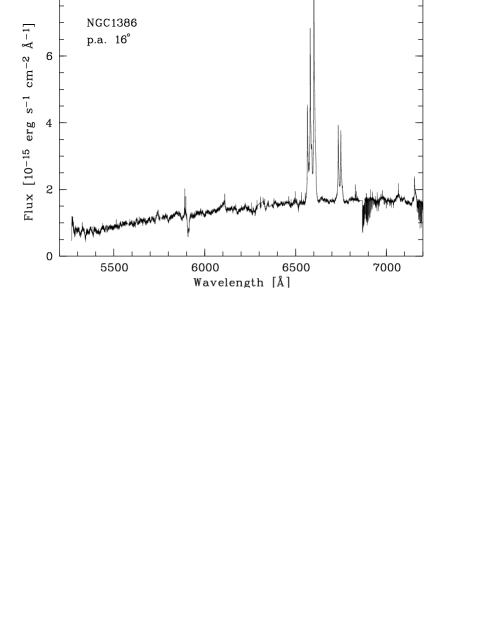
In Fig. 2 we present the spectrum of NGC 1386 from the central . The typical strong emission lines of Seyfert galaxies, e.g., H, [N ii], [S ii] are visible. Above 6900 Å the spectrum is dominated by strong atmospheric absorption bands (b-band, A-band).
2.2 Imaging
We retrieved high resolution images of NGC 1386 from the Space Telescope Science Institute (STScI) data archive (from the survey by Malkan et al. MGT (1998), Prop.–No. 5479). This image had been obtained with the WFPC 2 aboard the Hubble Space Telescope (HST). It was taken with the F606W filter (=5843.3 Å, FWHM=1578.7 Å). Further details are given in Biretta et al. (Biretta (1996)).
Additionally, further WFPC 2 images of NGC 1386 became available from a survey of Seyfert galaxies carried out by Wilson et al. (Prop.–No. 6419). These images had been taken in two narrowband and two broadband filters. In our study we made use of the F547M and F658N filter images. The narrowband (F658N) image covers the H+[N ii] emission within the filter FWHM of 28.5 Å. The WFPC 2 images of NGC 1386 were used to identify the individual components of the NLR in our 2-D spectrum which will be described in detail in Sect. 4.3.
3 Analysis
In addition to the pure emission line fluxes the calibrated spectrum also contains the radiation from the underlying stellar population (continuum). To remove this effect in a simple approach we calculated a linear continuum fit to our spectrum across the emission lines of interest (e.g., H, [N ii]). This linear interpolation which based on the mean flux in continuum windows (10 Å width) at either side of the H+[N ii] doublet emission line complex (=6538 Å, =6675 Å) was determined for each spatial scan and subtracted.
The 2-D echelle spectrogram was transformed from wavelength space into velocity space as described by Dietrich & Wagner (DW (1998)). We used the heliocentric velocity of NGC 1386, as given by Huchtmeier & Richter (HR (1989)). We checked this value by measuring the centroid of the redshifted interstellar Na I line and applying the appropriate heliocentric correction. This results in , in good agreement with Huchtmeier & Richter (HR (1989)).
Since our spectrum covers the wavelength range 5270–7725Å, we have several strong emission lines which are useful for the kinematical study of the line emitting gas. We use H and the [N ii] lines for our kinematical investigation. The less intense [S ii] 6717,6731 doublet, [O i] 6300 and the [Fe vii] 5721,6087 lines will be used for the investigation of the spatial variations of the physical conditions in the individual NLR emission–line clumps.
4 Results
4.1 Kinematics
By transforming the spectrum into the velocity space, the map shown in Fig. 5 c has been obtained. At a distance of 12.2 Mpc, the area covered by the slit of the spectrograph projected onto the plane of the galaxy is . The smallest details visible in the –map are estimated to be of the order of 03 which corresponds to a linear size at the distance of NGC 1386 of only . With this high spatial resolution in our spectra it is possible to obtain a detailed picture of the kinematics of the NLR in NGC 1386, based on a 2-D echelle spectrum with spatial information as a function of velocity. In Fig. 3 the spatial scans of the velocity space transformed spectrum in the [N ii] 6583 line are shown. In order to make a quantitative approach, a decomposition using elliptical Gaussians was applied to the spectrum. This yielded the position and velocity of the individual components in the –map as well as the line widths for each individual cloud in the space. The detailed description of the process of decomposing a 2-D echelle spectrogram is given by Dietrich & Wagner (DW (1998)) for the Seyfert galaxy NGC 1068.
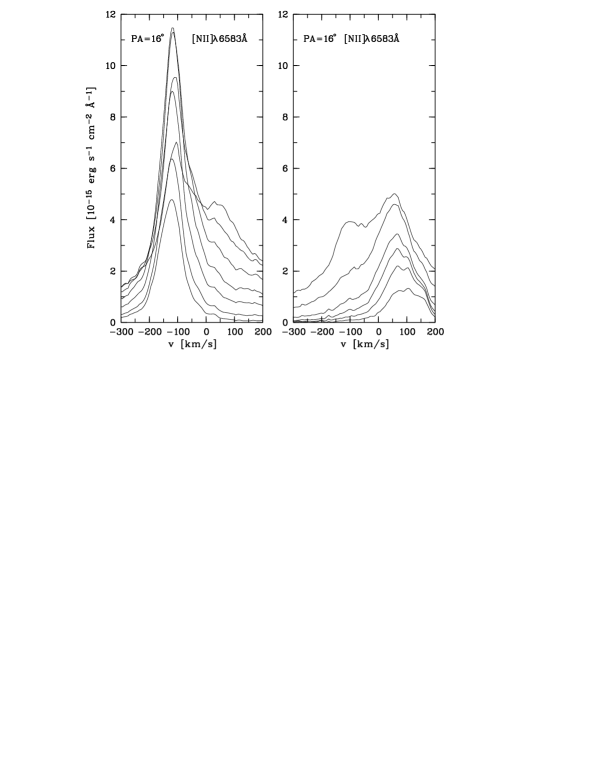
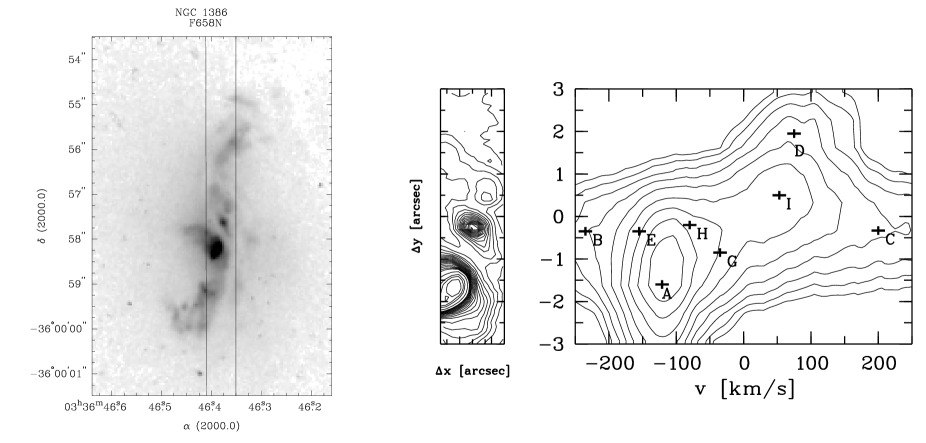
The decomposition of the NGC 1386 spectra yielded 9 individual NLR clouds which show mean velocity differences up to 400 in [N ii] 6583. The individual NLR components, marked by letters, and derived by the Gaussian decomposition (see Fig. 5 c) are located at different velocities and spatial locations relative to the nucleus. The line widths of these clouds vary from about (clouds A, D, F-I) and are accompanied by clouds with considerably higher values of FWHM = (clouds B, C, and E). The largest and most prominent region in this –map is component A which is blueshifted with respect to the systemic velocity by and shows an offset of relative to the nucleus.
| H6563 | [N ii] 6583 | |||||||
| Component | FWHM | Pos. [″]33footnotemark: 3 | FWHM [″] | FWHM | Pos. [″] | FWHM [″] | ||
| at P.A. | ||||||||
| A | 99 | 2.35 | 89 | 2.35 | ||||
| B | 400 | 2.24 | 471 | 2.24 | ||||
| C | 353 | 2.47 | 377 | 2.47 | ||||
| D | 130 | 2.59 | 153 | 2.59 | ||||
| E | 271 | 2.59 | 271 | 2.59 | ||||
| F | 283 | 2.35 | 235 | 2.35 | ||||
| G | 118 | 2.47 | 141 | 2.47 | ||||
| H | 95 | 2.12 | 118 | 2.35 | ||||
| I | 106 | 1.88 | 113 | 1.88 | ||||
3 all positional accuracies are of the order of 01.
We have plotted the velocities versus the position in Fig. 5 c with the derived uncertainties, which show the various velocity components for the [N ii] 6583 line. The analysis for H provided nearly identical results.
The identified components with their respective velocities (relative to the systemic velocity) and their positions in our –map are listed both for H and [N ii] 6583 in Table 2. The uncertainties arise from the positional accuracies of our –map. The velocity uncertainties are of the order of and in spatial direction of .
4.2 Morphology of the NLR
Several emission lines of different ionization levels are covered by the wavelength range of our 2-D echelle spectrogram. Therefore, it is possible to search for differences in the morphology of the extended line emission as a function of the ionization potential. With this method one can roughly discriminate NLR components from luminous H ii regions since H ii regions are not supposed to be visible in the high ionization lines as [Fe vii] for instance. The mechanism for exciting the gas to temperatures of that degree, where highly ionized Fe–lines become apparent, e.g., [Fe vii], can not be achieved with common stellar continuum emission as for instance in a massive starburst, since starbursts can not supply such high temperatures. Therefore, the most likely process is photoionization of the gas by a nonstellar power law continuum provided by the central continuum source or by continuum emission of fast radiative shocks (e.g., Dopita & Sutherland DS1 (1996)). The usual discrimination between H ii regions, AGN–like, and starburst galaxy regions is described in the diagnostic diagrams by plotting the intensity ratios of different emission lines (e.g., vs. , cf. Baldwin et al. BPT1 (1981); Veilleux & Osterbrock VeOs (1987); Allen et al. ADT (1998)).
Luminous H ii regions in the vicinity of an Seyfert nucleus are frequently found. These regions are indicative of massive starbursts. Sometimes the H ii regions appear in a ring structure around the nucleus, which is seen for instance in NGC 7469 (De Robertis & Pogge DP (1985)) and NGC 1068 (Balick & Heckman BH (1985)). In NGC 1386 there are 44 H ii regions visible which were detected by Tsvetanov & Petrosian (TP (1995)) in their survey of H ii regions in Seyfert galaxies. These reside in larger radii to the nucleus, outside our studied central region.
The brightest component which we refer to as cloud A, was initially suspected to be an ultraluminous H ii region (Rossa Rossa96 (1996)), based on the morphology of the 2-D echelle line profiles of different excitation levels. The reason that NGC 1386 is a low luminosity Seyfert galaxy and a detection of an apparent ultraluminous H ii region may lead to the conclusion that NGC 1386 is a starburst galaxy. However, the detection of the high ionization lines, which are characteristic for AGN, rules out that possibility. Furthermore, the line ratio [N ii] 6583/H2 rules out the possibility even that component A is a H ii region. It turns out that component A is located in the classical region for power law excitation in the Seyfert regime, according to diagnostic diagrams (e.g., Baldwin et al. BPT1 (1981)).
The comparison of the morphology of the NLR in the Seyfert 2 galaxy NGC 1386 with each of the low ionization lines (e.g., H, [N ii], [S ii]) shows a similar pattern, whereby the higher ionization lines like [Fe vii] show a different morphology. In the low ionization lines the bright component A is the dominant source in the –map. Comparing this with the velocity field in the [Fe vii] line shows that this component is not visible. Here only a central component is appearing which is most likely identified with the nucleus of the Seyfert galaxy. Hence, there is some evidence that the true nucleus has a much lower apparent luminosity than the NLR component A, indicating a hidden nucleus. This picture is supported by HST imaging studies. It has clearly shown, that nuclear dust lanes which are also visible in NGC 1386 are a common feature with typical scale heights of 20–50 pc (Capetti et al. 1996 b ) which often leads to obscuration of the central region of an AGN. Furthermore this is indeed evidenced by X–ray measurements, which show that the active nucleus in NGC 1386 is covered by a Compton–thick (i.e. ) screen (Maiolino et al. MSB (1998)).
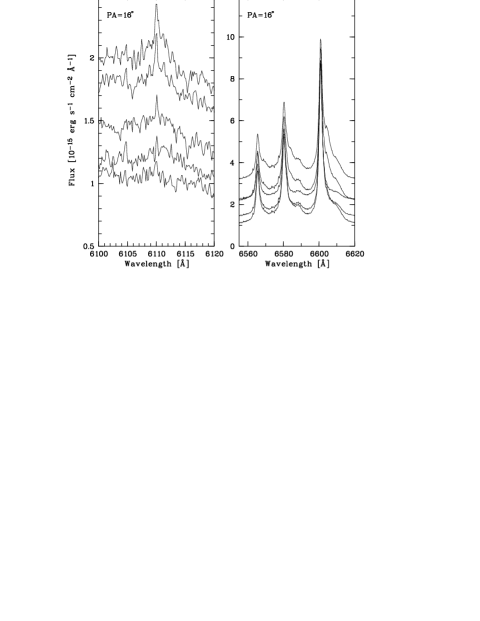
In Fig. 4 we show the spatial variation of profiles of the [N ii], H lines together with the [Fe vii] 6087 Å line.
4.3 Identification of individual NLR components
Next we made a detailed comparison of our reduced 2-D echelle spectrogram with WFPC 2 archive images taken with the HST. In Fig. 5 a we show a superposition of the inner part of NGC 1386 of the F658N filter HST image with the CASPEC slit. In Fig. 5 b we show the region (in contours) which is covered by the CASPEC slit. In the right–hand panel of Fig. 5 the direct comparison of our CASPEC spectrum of the [N ii] 6583 Å line as a –map is shown. The contours are given in logarithmic scale. The outer two spectral scans of our echelle spectra are severely affected as a result of the flatfielding process as described in Sect. 2. We limit our study to the central , where only the outermost regions are to some point influenced by the flatfield uncertainties on a small scale.
Now we can identify the individual NLR components seen in our echelle spectrogram with the components in the WFPC 2 image. Due to the high dispersion individual components of line emission are separated in velocity space and can be located spatially with high precision (as discussed in Dietrich & Wagner DW (1998)). Therefore, we can cross–check the components (or emission knots) in the two ‘images’. This investigation of the morphology can also be regarded as an additional method to the direct imaging studies in the respective narrow–bands (e.g., [O iii], H).
In Fig. 5 c we have plotted the velocities of the individual NLR components that have been identified in our [N ii] 6583 Å –map (after Gaussian decomposition) as a function of the distance to the nucleus in arcseconds. The error bars arise from the uncertainties in the determination of the and coordinates in our map.
The velocity field of NGC 1386 is not as much disturbed as the velocity field in NGC 1068 (Wagner & Dietrich WD (1996)) which shows velocity differences up to . Weaver et al. (WWB (1991)) tried to determine the position of the nucleus in their spectroscopic study. Since their spectra were taken at medium resolution, the position of the nucleus of NGC 1386 could not be identified unambiguously. Most likely a definitive answer would be given by polarimetric studies, such as it was done in the case of NGC 1068 (Capetti et al. 1996 a , Capetti3 (1997)), or by astrometry of the radio nucleus.
The brightest component in our echelle spectrum coincides with the brightest component in the WFPC 2 image of NGC 1386. This bright component A is offset by 95 pc with respect to the nucleus. A comparison of the HST WFPC 2 image (F658N) with our map of [NII] 6583 suggests a correspondence of the components A and G with the bright dominating component at in the HST image of NGC 1386. These two components have a similar velocity dispersion of FWHM100 km s-1 and are blueshifted with respect to the nucleus. Our components D and I are associated with the emission knots at and in the HST image, respectively. The FWHM of D and I is comparable to the FWHM of A,G, and H, however the components D and I are redshifted with respect to the nucleus. The components B,C,E,H might be connected with the central bright emission complex at in the WFPC 2 image. In contrast to the other components they are nearly located along the line of sight and show a velocity dispersion of the order of FWHM 350 km s-1. The velocity split of the individual components is of the order of 400 km s-1 and taking the weak and quite uncertain component F into account it rises to 800 km s-1. Due to the large separation in velocity space from the other components we have not plotted component F into the map.
5 Discussion
One of the motivations for the investigation of the velocity field of the NLR in NGC 1386 is to examine whether there are correlations between radio– structures and optical emission. In the theoretical picture the deviations from a pure rotational component of the velocity are manifested in infall or outflow motions. In the case of an outflow motion, this often leads to the detection of corresponding radio structures in the highly resolved VLA maps. Those structures are mostly identified with a jet, propagating through the ambient medium. The interaction of the outflowing radio plasma with the NLR gas will produce shocks and this shock gas can be described as an expanding cooling cocoon around the radio jet (Taylor et al. TDA (1992); Axon et al. Axon (1998)). Evidence for this scenario is found by Axon et al. (Axon (1998)) who mapped spectroscopically the inner few arcseconds of NGC 1068 at high resolution. They detected a velocity split of the order of 1000 km s-1 of individual components which was also found by Dietrich & Wagner (DW (1998)). The observed velocity difference in NGC 1386 can be explained within the framework of the models suggested by Taylor et al. (TDA (1992)) and Axon et al. (Axon (1998)).
The slit position of NGC 1386 in our investigation was chosen because the study by Mauder et al. (Mauder (1992)) showed that the NLR has an elongated structure, with an asymmetrical biconical shape. A distinct substructure is visible in their speckle images and a few components could be resolved in the central part (100 pc). From their speckle imaging an opening angle could be derived and the extended H–emission is mostly visible at a position angle of . Our identifications of the NLR components are in agreement with the observed NLR morphology by Mauder et al. (Mauder (1992)).
Our simple approach to reconstruct the H, [NII] emission line complex using elliptical Gaussian profiles provide some evidence for two components of the NLR velocity field of NGC1386. Our components can be associated with the bright emission line complexes of an HST narrow-band image (F658N). The components which might be dominated by the general galactic rotation can be characterized by FWHM 100 km s-1 while the components with FWHM 350 km s-1 might be in radial motion. This result is in good agreement with Weaver et al. (WWB (1991)) who also provide evidence for a two component velocity field of NGC 1386.
Even the velocity difference of the components with larger FWHM is of the order of 400 km s-1 only, there might be some interaction of the NLR gas with the outflowing radio plasma. The study by Ulvestad & Wilson (UW (1984)) revealed a slightly elongated structure in their VLA map (=6 cm) of NGC 1386 at the p.a. . So the radio–emission points anti-parallel to the optical emission. However, a more recent investigation by Nagar et al. (NWMG (1999)) revealed a 300 pc extended feature in p.a. in their VLA cm map.
A further interesting result of our analysis is the detection of the bright component (cloud A) which is displaced by from the nucleus. In the study by Weaver et al. (WWB (1991)) they reported a displacement of the optical nucleus by from their kinematical studies (kinematical center), which is most likely coincident with cloud A in our investigation. The true nucleus of NGC 1386 has a much less apparent luminosity than cloud A, and hence is most likely highly absorbed. This is also evidenced by X–ray observations (Maiolino et al. MSB (1998)). We conclude that component A is excited by photoionization, as is evident from the measured line ratios.
The fact that there is a cone–like geometry of the NLR on small scales, hints that absorption plays a role on those scales and that effect implies that the ionizing radiation can not escape isotropically from the circumnuclear regions. The observation of cone–like geometries in the central regions of Seyfert galaxies is a common feature. Evans et al. (Evans (1991)) have shown that the NLR in NGC 1068 is cone–like and comprises of several components. The kinematics of the strong components of this cloud ensemble have been studied by Dietrich & Wagner (DW (1998)). At least 16 components are visible in their –map obtained for the [O iii] 5007 Å–line down to the scale of that reside in the central region. From their study it was inferred that the velocity field of NGC 1068 is driven by shocks due to the interaction of the radio jet with the ambient medium.
6 Summary and Conclusions
We have studied the kinematics and the morphology of the NLR in the Seyfert galaxy NGC 1386 with high spatial resolution with CASPEC and archival HST images. The following results have been obtained.
-
•
the NLR of NGC 1386 is composed of 9 individual components with 5 components being redshifted and 4 being blueshifted with respect to the systemic velocity.
-
•
the brightest component (cloud A) is blueshifted by and shows an offset of to the south.
-
•
this cloud A is identified with the brightest region in the HST image, and is excited by photoionization
-
•
the true nucleus NGC 1386 has a much lower apparent luminosity, and is possibly hidden by nuclear dust lanes.
-
•
there is evidence for a two component velocity field in NGC 1386
The results show that with this technique of sub–arcsecond mapping, which makes use of highly resolved 2-D spectra, it is possible to identify individual NLR components in the nearest Seyfert galaxies. In this respect it is a powerful tool to describe the kinematics and morphology of the NLR.
Acknowledgements.
We would like to thank Dr. Andreas Jüttner who carried out the spectroscopic observations. We thank Dr. Hartmut Schulz for valuable comments on the manuscript. The Space Telescope Science Institute (STScI) is acknowledged for making the NGC 1386 images available to us through their HST–data archive. This research was supported by the DFG (Deutsche Forschungsgemeinschaft) through SFB 328. In addition, JR acknowledges financial support from the DLR (Deutsches Zentrum für Luft– und Raumfahrt) through grant 50 0R 9707. MD is supported through NASA grant NAG 5-3234.References
- (1) Allen M.G., Dopita M.A., Tsvetanov Z.I., 1998, ApJ 493, 571
- (2) Alloin D., Pelat D., Boksenberg A., Sargent W.L.W., 1983, ApJ 275, 493
- (3) Anderson K.S., 1970, ApJ 162, 743
- (4) Axon D.J., Marconi A., Capetti A., et al., 1998, ApJ 496, 75
- (5) Baldwin J.A., Phillips M.M., Terlevich R., 1981, PASP 93, 5
- (6) Balick B., Heckman T.M., 1985, AJ 90, 197
- (7) Biretta J.A., Burrows C., Holtzman J., et al., 1996, WFPC 2 Instrument Handbook, Version 4.0 (Baltimore: STScI)
- (8) Burbidge E.M., Burbidge G.R., Prendergast K.H., 1959, ApJ 130, 26
- (9) Capetti A., Macchetto F.D., Axon D.J., Sparks W.B., Boksenberg A., 1995, ApJ 448, 600
- (10) Capetti A., Axon D.J., Macchetto F.D., Sparks W.B., Boksenberg A., 1996 a, ApJ 466, 169
- (11) Capetti A., Axon D.J., Macchetto F.D., Sparks W.B., Boksenberg A., 1996 b, ApJ 469, 554
- (12) Capetti A., Macchetto F.D., Lattanzi M.G., 1997, ApJ 476, L67
- (13) De Robertis M.M., Pogge R.W., 1985, AJ 91, 1026
- (14) Dietrich M., Wagner S.J., 1998, A&A 338, 405
- (15) Dopita M.A., Sutherland R.S., 1996, ApJS 102, 161
- (16) Evans I.N., Ford H.C., Kinney A.L., et al., 1991, ApJ 369, L27
- (17) Gallimore J.F., Baum S.A., O’Dea C.P., Pedlar A., 1996, ApJ 458, 136
- (18) Glaspey J.W., Eilek J.A., Fahlman G.G., Auman J.R., 1976 a, ApJ 203, 335
- (19) Glaspey J.W., Walker G.A.H., Stockton A., 1976 b, ApJ 210, 27
- (20) Huchtmeier W.K., Richter O.-G., 1989, A General Catalog of H i Observations of Galaxies, Springer Verlag
- (21) Lynds R., Faber S.M., Groth E.J., et al., 1991, ApJ 369, L31
- (22) Macchetto F.D., Capetti A., Sparks W.B., Axon D.J., Boksenberg A., 1994, ApJ 435, L15
- (23) Madore B.F., Freedman W.L., Silbermann N., et al., 1999, ApJ 515, 29
- (24) Maiolino R., Salvati M., Bassani L., et al., 1998, A&A 338, 781
- (25) Malkan M.A., Gorjian V., Tam R., 1998, ApJS 117, 25
- (26) Mauder W., Appenzeller I., Hoffmann K.-H., et al., 1992, A&A 264, L9
- (27) McMillan R., Ciardullo R., Jacoby G.H., 1993, ApJ 416, 62
- (28) Nagar N.M., Wilson A.S., Mulchaey J.S., Gallimore J.F., 1999, ApJS 120, 209
- (29) Osterbrock D.E., 1993, ApJ 404, 551
- (30) Phillips M.M., Frogel J.A., 1980, ApJ 235, 761
- (31) Pogge R.W., 1989, ApJ 345, 730
- (32) Pogge R.W., DeRobertis M.M., 1993, ApJ 404, 563
- (33) Rossa J., 1996, Diploma thesis, University of Heidelberg
- (34) Sandage A., Tammann G., 1981, A Revised Shapley-Ames Catalog of Bright Galaxies, The Carnegie Institution
- (35) Taylor D., Dyson J.E., Axon D.J., 1992, MNRAS 255, 351
- (36) Tsvetanov Z.I., Petrosian A.R., 1995, ApJS 101, 287
- (37) Tully R.B., 1988, Nearby Galaxies Catalog, University of Cambridge Press
- (38) Ulvestad J.S., Wilson A.S., 1984, ApJ 285, 439
- (39) de Vaucouleurs G., de Vaucouleurs A., Corwin H.G., Jr., et al., 1991, Third Reference Catalogue of Bright Galaxies (RC 3), Springer Verlag
- (40) Veilleux S., Osterbrock D.E., 1987, ApJS 63, 295
- (41) Wagner S.J., Appenzeller I., 1988, A&A 197, 75
- (42) Wagner S.J., Dietrich M., 1996, in: Science with the Hubble Space Telescope–II, Benvenuti P., Macchetto F.D., Schreier E.J. (eds.), STScI/ST–ECF Workshop Proc. 1996, p. 214
- (43) Walker M.F., 1968, ApJ 151, 71
- (44) Weaver K.A., Wilson A.S., Baldwin J.A., 1991, ApJ 366, 50
- (45) Winge C., Axon D.J., Macchetto F.D., 1997, ApJ 487, L121