Updated AGASA event list above 4 1019eV
N. Hayashida1, K. Honda2, N. Inoue3, K. Kadota4, F. Kakimoto4, S. Kakizawa5,
K. Kamata6, S. Kawaguchi7, Y. Kawasaki8, N. Kawasumi9, E. Kusano10,
A. M. Mahrous3, K. Mase1, T. Minagawa1, M. Nagano11, D. Nishikawa1, H. Ohoka1,
S. Osone1, N. Sakaki1, M. Sasaki1, K. Shinozaki3, M. Takeda1, M. Teshima1,
R. Torii1, I. Tsushima9, Y. Uchihori12, T. Yamamoto1, S. Yoshida1, and H. Yoshii13
1 Institute for Cosmic Ray Research, University of Tokyo, Tokyo 188-8502, Japan
2 Faculty of Engineering, Yamanashi University, Kofu 400-8511, Japan
3 Department of Physics, Saitama University, Urawa 338-8570, Japan
4 Department of Physics, Tokyo Institute of Technology, Tokyo 152-8551, Japan
5 Faculty of Science, Shinshu University, Matsumoto 390-8621, Japan
6 Nishina Memorial Foundation, Komagome, Tokyo 113-0021, Japan
7 Faculty of General Education, Hirosaki University, Hirosaki 036-8560, Japan
8 RIKEN (The Institute of Physical and Chemical Research), Saitama 351-0198, Japan
9 Faculty of Education, Yamanashi University, Kofu 400-8510, Japan
10
KEK, High Energy Accelerator Research Organization, Institute of Particle and Nuclear Studies, Tsukuba 305-0801, Japan
11 Department of Applied Physics and Chemistry, Fukui Institute of Technology, Fukui 910-8505, Japan
12 National Institute of Radiological Sciences, Chiba 263-8555, Japan
13 Department of Physics, Ehime University, Matsuyama 790-8577, Japan
Abstract
After our Ap.J. publication of the Akeno Giant Air Shower Array (AGASA) results in 1999 (Takeda et al., 1999), we observed nine events with energies above 4 1019eV until May 2000. This short report lists the coordinates of these events, and shows the updated energy spectrum and arrival direction map. The analysis was carried out with the same procedure employed in the Ap.J. publication.
1 Introduction
The Akeno Giant Air Shower Array (AGASA) has been operated in stable since 1990 and the exposure exceeds 4.0 1016 m2 s sr until the end of May 2000. Since there are many requests to use new events after the publication of the event list in PRL [1] and Ap.J. [2], we show the updated list in this report. The analysis was carried out with the same parameters used in the previous papers [1, 2].
Although the zenith angle range is limited less than 45∘ in the present analysis, our dataset has now enough statistics to determine experimentally the lateral distribution of shower particles and the attenuation of S(600) with atmospheric depth to larger zenith angles in energy range of 3 1019eV. Our energy estimation procedure for larger zenith angles is now under careful investigation, and we may be able to apply a refined attenuation length beyond 45∘. This may modify the parameters in the energy estimation procedure slightly; but we can extend our observable sky to larger zenith angles than 45∘ and increase the effective exposure of AGASA in our next full-paper publication.
In this report, we first show the updated energy spectrum above 3 1018eV with events until May 2000. And then we show the cosmic-ray arrival direction distribution with the additional dataset of the Akeno 20 km2 array (A20) before 1990. Important informations for the present analysis are listed below, and for details refer our publications [1, 2, 3, 4, 5, 6, 7, 8].
| Exposure : | 4.0 1016 m2 s sr | |
| Energy conversion formula : | E 2.03 1017 S0(600) eV | |
| Attenuation of S(600) : |
| Error in S(600) determination : | 30 % above 1019eV | |
| Error in arrival direction determination : | 1.6∘ above 4 1019eV |
2 Updated Results
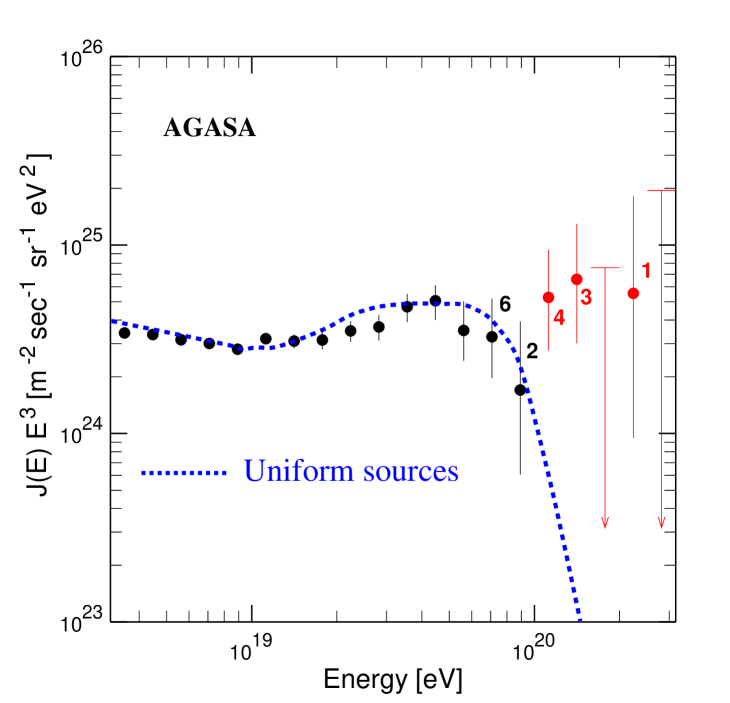
The updated energy spectrum observed with AGASA (without A20) is shown in Figure 1, multiplied by E3 in order to emphasize details of the steeply falling spectrum. Error bars represent the Poisson upper and lower limits at and arrows are C.L. upper limits. Numbers attached to points show the number of events in each energy bin. The dashed curve represents the spectrum expected for extragalactic sources distributed uniformly in the Universe, taking account of the energy determination error [9]. Now we observed 8 events above 1020eV.
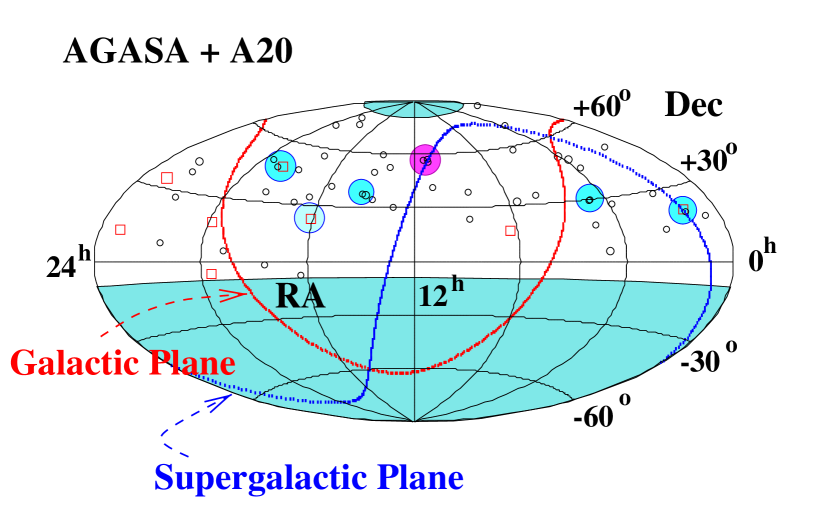
Figure 2 shows arrival directions of cosmic rays with energies above 4 1019eV in the equatorial coordinates. Open circles, and Open squares represent cosmic rays with energies of (4 – 10) 1019eV, and 1020eV, respectively. The shaded regions indicate the celestial regions excluded in this paper due to the zenith angle cut of 45∘. The galactic and supergalactic planes are drawn by the red and blue curves. The shaded circle near the center is the C2 triplet – three events are observed within 2.5∘ – and the chance probability of observing such triplet under an isotropic distribution is about 1 %. This value becomes somewhat larger than our Ap.J. publication [2], but this triplet is an interesting phenomenon. A new doublet is observed around (14h 10m, 37.5∘), which is referred to as “C6” on the basis of our Ap.J. publication [2].
| Date | Time | Energy | Coordinates | ||||
| 84/12/12 | 14:18:02 | 6.81 1019 eV | 22h 21m | 38.4∘ | 93.3∘ | 15.7∘ | |
| 84/12/17 | 10:28:16 | 9.79 | 18h 29m | 35.3∘ | 63.5∘ | 19.4∘ | |
| 86/01/05 | 19:31:03 | 5.47 | 4h 38m | 30.1∘ | 170.4∘ | 11.2∘ | C4 |
| 86/10/23 | 14:25:15 | 6.22 | 14h 02m | 49.9∘ | 96.8∘ | 63.4∘ | |
| 87/11/26 | 17:49:20 | 4.82 | 21h 57m | 27.6∘ | 82.1∘ | 21.1∘ | |
| 89/03/14 | 02:45:39 | 5.27 | 13h 48m | 34.7∘ | 68.3∘ | 75.6∘ | |
| 89/08/16 | 08:32:01 | 4.07 | 5h 51m | 58.5∘ | 154.5∘ | 15.6∘ | |
| 90/11/25 | 11:05:39 | 4.51 | 16h 17m | 7.2∘ | 6.1∘ | 29.6∘ | |
| 91/04/03 | 00:32:40 | 5.09 | 15h 47m | 41.0∘ | 65.7∘ | 51.5∘ | |
| 91/04/20 | 08:24:49 | 4.35 | 18h 59m | 47.8∘ | 77.9∘ | 18.4∘ | C3 |
| 91/05/31 | 13:07:04 | 5.53 | 3h 37m | 69.5∘ | 136.6∘ | 11.2∘ | |
| 91/11/29 | 14:53:03 | 9.10 | 19h 06m | 77.2∘ | 108.8∘ | 25.6∘ | |
| 91/12/10 | 18:59:10 | 4.24 | 0h 12m | 78.6∘ | 121.0∘ | 15.9∘ | |
| 92/01/07 | 03:16:49 | 4.51 | 9h 36m | 38.6∘ | 184.3∘ | 48.0∘ | |
| 92/01/24 | 12:26:17 | 4.88 | 17h 52m | 47.9∘ | 74.8∘ | 29.4∘ | |
| 92/02/01 | 17:20:52 | 5.53 | 0h 34m | 17.7∘ | 117.2∘ | 45.0∘ | |
| 92/03/30 | 03:05:30 | 4.47 | 17h 03m | 31.4∘ | 53.6∘ | 35.6∘ | |
| 92/08/01 | 13:00:47 | 5.50 | 11h 29m | 57.1∘ | 143.2∘ | 56.6∘ | C2 |
| 92/09/13 | 08:59:44 | 9.25 | 6h 44m | 34.9∘ | 180.5∘ | 13.9∘ | |
| 93/01/12 | 02:41:13 | 10.1 | 8h 17m | 16.8∘ | 206.7∘ | 26.4∘ | |
| 93/01/21 | 07:58:06 | 4.46 | 13h 55m | 59.8∘ | 108.8∘ | 55.5∘ | |
| 93/04/22 | 09:39:56 | 4.42 | 1h 56m | 29.0∘ | 139.8∘ | 31.7∘ | |
| 93/06/12 | 06:14:27 | 6.49 | 1h 16m | 50.0∘ | 127.0∘ | 12.7∘ | |
| 93/12/03 | 21:32:47 | 21.3 | 1h 15m | 21.1∘ | 130.5∘ | 41.4∘ | C1 |
| 94/07/06 | 20:34:54 | 13.4∗ | 18h 45m | 48.3∘ | 77.6∘ | 20.9∘ | C3 |
| 94/07/28 | 08:23:37 | 4.08 | 4h 56m | 18.0∘ | 182.8∘ | 15.5∘ | |
| 95/01/26 | 03:27:16 | 7.76 | 11h 14m | 57.6∘ | 145.5∘ | 55.1∘ | C2 |
| 95/03/29 | 06:12:27 | 4.27 | 17h 37m | 1.6∘ | 22.8∘ | 15.7∘ | |
| 95/04/04 | 23:15:09 | 5.79 | 12h 52m | 30.6∘ | 117.5∘ | 86.5∘ | |
| 95/10/29 | 00:32:16 | 5.07 | 1h 14m | 20.0∘ | 130.2∘ | 42.5∘ | C1 |
| The value on the Ap.J. publication is a typo. | |||||||
Table 1: AGASA A20 events above 4 1019eV (contd.)
| Date | Time | Energy | Coordinates | ||||
|---|---|---|---|---|---|---|---|
| 95/11/15 | 04:27:45 | 4.89 1019 eV | 4h 41m | 29.9∘ | 171.1∘ | 10.8∘ | C4 |
| 96/01/11 | 09:01:21 | 14.4 | 16h 06m | 23.0∘ | 38.9∘ | 45.8∘ | C5 |
| 96/01/19 | 21:46:12 | 4.80 | 3h 52m | 27.1∘ | 165.4∘ | 20.4∘ | |
| 96/05/13 | 00:07:48 | 4.78 | 17h 56m | 74.1∘ | 105.1∘ | 29.8∘ | |
| 96/10/06 | 13:36:43 | 5.68 | 13h 18m | 52.9∘ | 113.8∘ | 63.7∘ | |
| 96/10/22 | 15:24:10 | 10.5 | 19h 54m | 18.7∘ | 56.8∘ | 4.8∘ | |
| 96/11/12 | 16:58:42 | 7.46 | 21h 37m | 8.1∘ | 62.7∘ | 31.3∘ | |
| 96/12/08 | 12:08:39 | 4.30 | 16h 31m | 34.6∘ | 56.2∘ | 42.8∘ | |
| 96/12/24 | 07:36:36 | 4.97 | 14h 17m | 37.7∘ | 68.5∘ | 69.1∘ | C6 |
| 97/03/03 | 07:17:44 | 4.39 | 19h 37m | 71.1∘ | 103.0∘ | 21.9∘ | |
| 97/03/30 | 07:58:21 | 15.0 | 19h 38m | 5.8∘ | 33.1∘ | 13.1∘ | |
| 97/04/28 | 13:46:18 | 4.20 | 2h 18m | 13.8∘ | 152.9∘ | 43.9∘ | |
| 97/11/20 | 07:23:25 | 7.21 | 11h 09m | 41.8∘ | 171.2∘ | 64.6∘ | |
| 98/02/06 | 00:12:26 | 4.11 | 9h 47m | 23.7∘ | 207.2∘ | 48.6∘ | |
| 98/03/30 | 08:17:26 | 6.93 | 17h 16m | 56.3∘ | 84.5∘ | 35.3∘ | |
| 98/04/04 | 20:07:03 | 5.35 | 11h 13m | 56.0∘ | 147.5∘ | 56.2∘ | C2 |
| 98/06/12 | 06:43:49 | 12.0 | 23h 16m | 12.3∘ | 89.5∘ | 44.3∘ | |
| 98/09/03 | 23:42:48 | 4.69 | 19h 36m | 50.7∘ | 83.1∘ | 14.0∘ | |
| 98/10/27 | 00:45:37 | 6.11 | 3h 45m | 44.9∘ | 152.4∘ | 7.8∘ | |
| 99/01/22 | 08:43:54 | 7.53 | 19h 11m | 5.3∘ | 39.9∘ | 2.1∘ | |
| 99/07/22 | 08:11:14 | 4.09 | 7h 39m | 32.2∘ | 187.5∘ | 23.6∘ | |
| 99/07/28 | 04:08:49 | 7.16 | 3h 46m | 49.5∘ | 149.8∘ | 4.0∘ | |
| 99/09/22 | 01:43:30 | 10.4 | 23h 03m | 33.9∘ | 98.5∘ | 23.8∘ | |
| 99/09/25 | 20:13:49 | 4.95 | 22h 40m | 42.6∘ | 98.8∘ | 14.0∘ | |
| 99/10/20 | 03:46:21 | 6.19 | 4h 37m | 5.1∘ | 191.3∘ | 26.5∘ | |
| 99/10/20 | 22:01:35 | 4.29 | 4h 02m | 51.7∘ | 150.3∘ | 0.7∘ | |
| 00/05/26 | 18:38:16 | 4.98 | 14h 08m | 37.1∘ | 69.3∘ | 71.0∘ | C6 |
| 97/04/10 | 02:48:48 | 3.89∗∗ | 15h 58m | 23.7∘ | 39.1∘ | 47.8∘ | C5 |
| This energy is just below the 4 1019eV cut. | |||||||
Acknowledgments
We are grateful to Akeno-mura, Nirasaki-shi, Sudama-cho, Nagasaka-cho, Ohizumi-mura, Tokyo Electric Power Co. and Nihon Telegram and Telephone Co. for their kind cooperation. The authors are indebted to other members of the Akeno group in the maintenance of the AGASA array.
References
- [1] M. Takeda et al., Phys. Rev. Lett., 81, 1163 (1998).
- [2] M. Takeda et al., Ap.J., 522, 225 (1999) [astro-ph/9902239].
- [3] M. Teshima et al., Nucl. Instr. and Meth., A 247, 399 (1986).
- [4] H. Y. Dai et al., J. Phys. G: Nucl. Phys., 14, 793 (1988).
- [5] N. Chiba et al., Nucl. Instr. and Meth., A 311, 338 (1992).
- [6] H. Ohoka et al., Nucl. Instr. and Meth., A 385, 268 (1997).
- [7] S. Yoshida et al., J. Phys. G:Nucl. Part. Phys., 20, 651 (1994).
- [8] S. Yoshida et al., Astropart. Phys., 3, 105 (1995).
- [9] S. Yoshida and M. Teshima, Prog. Theor. Phys., 89, 833 (1993).
- [10] K. Greisen, Phys. Rev. Lett., 16, 748 (1966).
- [11] G. T. Zatsepin, and V. A. Kuz’min, Zh. Eksp. Teor. Fiz., 4, 114 (1966) [JETP Letters, 4, 78].