Search for young stars among ROSAT All-Sky Survey X-ray sources in and around the R CrA dark cloud ††thanks: Partly based on observations collected at the 1.52m and 3.5m telescopes of the European Southern Observatory, Chile, in programs 55.E-0549, 57.E-0646, and 63.L-0023, and on observations collected at the 0.9m, 1.5m, and 4.0m CTIO telescope.
Abstract
We present the ROSAT All-Sky Survey data in a 126 deg2 area in and around the CrA star forming region. With low-resolution spectroscopy of unidentified ROSAT sources we could find 19 new pre-main sequence stars, two of which are classical T Tauri stars, the others being weak-lined. The spectral types of these new T Tauri stars range from F7 to M6. The two new classical T Tauri stars are located towards two small cloud-lets outside of the main CrA cloud. They appear to be Myrs old, by comparing their location in the H-R diagram with isochrones for an assumed distance of 130 pc, the distance of the main CrA dark cloud. The new off-cloud weak-line T Tauri stars may have formed in similar cloud-lets, which have dispersed recently. High-resolution spectra of our new T Tauri stars show that they have significantly more lithium absorption than zero-age main-sequence stars of the same spectral type, so that they are indeed young. From those spectra we also obtained rotational and radial velocities. For some stars we found the proper motion in published catalogs. The direction and velocity of the 3D space motion – south relative to the galatic plane – of the CrA T Tauri stars is consistent with the dark cloud being formed originally by a high-velocity cloud impact onto the galactic plane, which triggered the star formation in CrA. We also present VRIJHK photometry for most of the new T Tauri stars to derive their luminosities, ages, and masses.
Key Words.:
Stars: formation – Stars: late-type – Stars: pre-main sequence – X-rays: stars1 Introduction
The Corona Australis (CrA) molecular cloud complex (Dame et al. 1987) is one of the nearest regions of ongoing and/or recent intermediate- and low-mass star formation. The dark cloud near the emission line star R CrA (Knacke et al. 1973) is the densest cloud core with extinction up to mag (Wilking et al. 1992). This cloud is also called FS 445-47 (Feitzinger & Stüwe 1984) and condensation A (Rossano 1978); Harju et al. (1993) resolved cloud A into five condensations, the star R CrA being located in A2. Cambrésy (1999) mapped the cloud using optical star counts. Between the stars R and T CrA, there is the reflection nebula NGC 6729; TY CrA and HD 176386 illuminate the nebula NGC 6726/6727. Several infrared (IR) surveys revealed a large population of embedded IR sources (Taylor & Storey 1984, Wilking et al. 1984, 1986, 1992, 1997), some of which are IR Class I objects, extremely young stars still deeply embedded in their dense circumstellar envelopes (Adams et al. 1987, André & Montmerle 1994). From the main-sequence contraction time of the early-type stars R, T, and TY CrA, the age of the cloud is estimated to be between (Knacke et al. 1973) and Myrs (Wilking et al. 1992).
The distance towards the CrA star forming region was estimated by Gaposchkin & Greenstein (1936) to be pc and later by Marraco & Rydgren (1981) to be pc (assuming R=4.5). The Hipparcos satellite tried to measure the parallax of the star R CrA and found mas, i.e. no reliable solution. Casey et al. (1998) estimated the distance towards the eclipsing double-lined spectroscopic binary TY CrA to be pc from their orbit solution.
Only a few low-mass pre-main sequence (PMS) stars, so-called T Tauri stars (TTS), associated with the CrA dark cloud had been found by H and IR surveys (Knacke et al. 1973, Glass & Penston 1975, Marraco & Rydgren 1981, Wilking et al. 1984, 1986, 1992, 1997), all being classical TTS (cTTS) with IR excess and strong H emission (see Table 1). Patten (1998) obtained optical photometry and spectroscopy of some more sources of, by then, unknown nature around R CrA, previously found by Knacke et al. (1973), Glass & Penston (1975), and Marraco & Rydgren (1981), and of some X-ray sources found in a pointed ROSAT observation. He classified some of them as new association members due to H emission.
Table 1 gives a list of all previously known optically visible young stars in CrA, with their names, PMS types (Herbig Ae/Be or T Tauri stars), spectral types, H and lithium equivalent widths, and some remarks, e.g. on radial velocity and binarity.
PMS types are either cTTS or wTTS or intermediate-mass Herbig Ae/Be stars, one being of spectral type F0e. We also list spectral types, H and lithium 6708Å equivalent widths (negative when in emission) as well as radial velocities (RV in ), if available. Data for stars with CrAPMS designations are from Walter et al. (1997), for other stars with HBC number from the Herbig-Bell catalog (HBC, Herbig & Bell 1988), unless otherwise noted. At the end of the table, we also list four more late B-type stars, which might be associated with the CrA cloud. Some of the previously suspected TTS have been confirmed by our spectroscopy, but for MR81 H 10 and Kn anon 2, we could not detect lithium.
| No. | Designation | GP75 | Other name | PMS | Spec | (Li) | Remarks | |
| HBC | name | type | type | [Å] | [Å] | |||
| 286 | S CrA | Hen 3-1731 | cTTS | K6 | 0.39e | RV=0, 1.37” binary | ||
| 287 | TY CrA | CrAPMS 11 | HeBe | B9ea | yes | triple, d=129 pcb | ||
| 288 | R CrA | CoD | HeAe | A5e II | RV= | |||
| 289 | DG CrA | Hen 3-1734 | cTTS | K0e | 0.57e | |||
| 290 | T CrA | HeFe | F0e | |||||
| 291 | VV CrA | Hen 3-1736 | cTTS | K1e | ||||
| 673 | MR81 H 10 | K | noe | non-TTSe,g | ||||
| 674 | MR81 H 6 | CrAPMS 7 | cTTS | M1 | 0.36 | |||
| 675 | Kn anon 2 | j2 | G0e | noe | non-TTSe,g | |||
| 676 | CoD | i2 | CrAPMS 1 | wTTS | K1 | 0.39 | RV= | |
| 677 | MR81 H 2 | i | HaGr 1-100 | cTTSe | K8 | |||
| 678 | V702 CrA | a2 | CrAPMS 2 | wTTS | G5 | 0.28 | RV= | |
| 679 | CrAPMS 3 | w | wTTS | K2 | 0.41 | RV=, 4.5” pair | ||
| CrAPMS 3/c | wTTSe | M4e | 4.5” pair | |||||
| 680 | MR81 H 14 | wTTSe | M3e | 0.64e | TTSg | |||
| e2 | M3-5g | em.g | TTSg | |||||
| g2 | M3-5g | em.g | TTSg | |||||
| f2 | K4g | TTSg | ||||||
| n | cTTSg | em.g | ||||||
| MR81 H 12 | M3-5g | em.g | TTSg | |||||
| MR81 H 13 | M3-5g | em.g | TTSg | |||||
| MR81 H 15 | M3-5g | em.g | TTSg | |||||
| MR81 H 16 | M1g | em.g | TTSg | |||||
| MR81 H 17 | M3-5g | em.g | TTSg | |||||
| CrAPMS 4NW | wTTS | M0.5 | 0.45 | RV= | ||||
| CrAPMS 4SE | wTTS | G5 | 0.36 | RV= | ||||
| CrAPMS 5 | wTTS | K5 | 0.44 | RV= | ||||
| MR81 H 11NE | CrAPMS 6NE | wTTS | M3 | 0.70 | NE/SW 3” pair | |||
| MR81 H 11SW | CrAPMS 6SW | wTTS | M3.5 | 0.44 | NE/SW 3” pair | |||
| CrAPMS 8 | g2 | wTTS | M3 | 0.57 | ||||
| CrAPMS 9 | wTTS | M2 | 0.5 | |||||
| RXJ1855.1-3754 | GSC 07916-00050 | wTTSd | K3d | (Li)(Ca)d | ||||
| RXJ1857.7-3719 | Patten R1c | M3-5g | em.g | TTSg | ||||
| RXJ1858.9-3640 | Patten R17c | M3-5g | em.g | TTSg | ||||
| RXJ1859.7-3655 | Patten R13a | M3g | em.g | TTSg | ||||
| HR 7169 | l | HD 176269 | B9 | 7.7e | pcf (*) | |||
| HR 7170 | k | HD 176270 | B8 | 7.0e | pcf (*) | |||
| SAO 210888 | HD 177076 | B9.5 | pcf | |||||
| HD 176386 | p | HIP 93425 | B9 | RV=7.3c, pcf, 4” binaryc |
References: (a) HBC, (b) Casey et al. 1998, (c) Simbad, (d) Neuhäuser et al.
1997, (e) this work, (f) Hipparcos, (g) Patten 1998.
Note:
(*) Both HR 7169 and HR 7170 are spectroscopic binaries (Hoffleit 1982).
With a separation of 13” in 1982.66 (Torres 1985), this visual pair may be bound.
The system was also detected by EO as the spatially unresolved
source PMSCrA 10 (Walter et al. 1997).
With optical follow-up observations of previously unidentified X-ray sources detected with the Einstein Observatory (EO), Walter (1986) and Walter et al. (1997) found eleven new TTS members, namely CrAPMS 1 to 9, two of them (CrAPMS 4 and 6) being visual pairs consisting of two PMS stars (see Table 1). With only one exception (the cTTS CrAPMS 7), all of them are weak-emission line TTS111 Because most wTTS lack the IR excess typical for cTTS and, hence, are probably not surrounded by circumstellar disks, Walter (1986) called them naked TTS. However, because wTTS and nTTS populate both the convective and radiative PMS tracks, the wTTS and nTTS population is different from the so-called post-TTS population. Post-TTS are older than cTTS and do not show signatures of circumstellar disks and accretion (H, UV, IR); post-TTS are expected to exist in large numbers, if star formation has been going on for longer than the typical life-time of circumstellar disks (Herbig 1978). (wTTS).
In Table 1 we list all the previously known and suspected young stars in CrA, which are optically visible. Walter et al. (1997) could also establish the typical radial velocity of kinematic members of the CrA association: All the seven TTS, for which radial velocities are known, show velocities in the range of to (heliocentric). Chen et al. (1997) also compiled a list of young stars in CrA and estimated their bolometric luminosities. We omit IR Class I sources and brown dwarf candidates in this paper, because they are too faint in X-rays to be detected in the ROSAT All-Sky Survey (RASS).
The early-type stars TY CrA, HR 7169, and HR 7170, all being spectroscopic binaries, were also detected by EO (Walter et al. 1997), but their X-ray emission may originate from late-type companions. While many of the optically visible TTS are known to be rather strong and variable X-ray emitters (eg. Montmerle et al. 1983, Walter et al. 1988, Neuhäuser et al. 1995), it was surprising that a few IR Class I objects were also detected by ASCA and ROSAT X-ray observations (Koyama et al. 1996, Neuhäuser & Preibisch 1997). Wilking et al. (1997) also found five brown dwarf candidates, but they are not detected in deep ROSAT pointings (Neuhäuser et al. 1999).
Because there are several early-type stars in the CrA association, there should be much more than the dozen TTS listed in Table 1, if its initial mass function (IMF) is consistent with the Miller-Scalo IMF (Miller & Scalo 1979). From the spatial incompleteness of the EO observations and the X-ray variability of TTS, Walter et al. (1997) concluded that there should be TTS in CrA. From their IR survey, Wilking et al. (1997) estimated the number of the low-mass members to be 22 to 40 for an association age of Myrs. If star formation has been ongoing in CrA for more than Myrs, there should be even more PMS stars. Such older PMS stars, i.e. the post-TTS, should partly be found around the CrA dark cloud, because they had enough time to disperse out.
Optical follow-up observations of RASS sources in and around other star forming regions (Tau-Aur, Orion, Cha, Oph, Lup-Sco-Cen, etc.) revealed large populations of previously unknown PMS stars most of them being wTTS (see Neuhäuser 1997 for a review), identified as such with low- to intermediate resolution spectroscopy showing late spectral types, H emission (or emission filling-in the absorption), and lithium 6708Å absorption, a youth indicator. Because some of them were found even outside the star forming clouds, it was argued (Briceño et al. 1997) that many of these young stars are not PMS, but zero-age main-sequence (ZAMS) stars similar to the Pleiades, which also show strong X-ray emission, H absorption, and lithium 6708Å absorption. However, in the meantime, Covino et al. (1997), Neuhäuser et al. (1997), Wichmann et al. (1999), and Alcalá et al. (2000) have shown with high-resolution spectra that most of the previously claimed wTTS really are PMS stars, because they show more lithium than ZAMS stars of the same spectral type. Also, Neuhäuser & Brandner (1997) found that all 15 Li-rich stars found by ROSAT, which could be placed accurately into the H-R diagram using Hipparcos data, clearly are PMS stars. The young stars newly found outside of the clouds could either be ejected out of their parent cloud (Sterzik & Durisen 1995), or they could have formed locally in small cloud-lets which dispersed since then (Feigelson 1996, Mizuno et al. 1998). Many of the new ROSAT TTS in Taurus, Orion, and Lup-Sco-Cen are probably members of the Gould Belt (Guillout et al. 1998a,b), young stars still at least slightly above the ZAMS.
The CrA dark cloud is located below the galactic plane. According to Olano (1982, see also Fig. 1.10 in Pöppel 1997), the CrA and Chamaeleon clouds are not part of the Gould Belt nor of the Lindblad ring, because both CrA and Cha are far below the galactic plane, while the belt and the ring are both above the plane. In the cross-correlation of Tycho and RASS, the CrA association is seen as a small cluster of X-ray active stars around and , see Fig. 3 in Guillout et al. (1998a) and Fig. 3 in Guillout et al. (1998b). The Gould Belt is above the galactic plane in this quadrant. Hence, neither CrA nor Cha are part of the belt, so that we should not expect to detect Gould Belt members in CrA. Many new TTS were discovered around the Cha clouds (Alcalá et al. 1995, Covino et al. 1997), so that we may expect to find many such TTS also here around the CrA dark cloud. Hence, we carried out an optical identification program to find more PMS in and around the CrA dark cloud among unidentified RASS sources.222Four new PMS stars were already identified among ROSAT sources: GSC 07916-00050 as the optical counterpart to RXJ1855.1-3754 (Neuhäuser et al. 1997), an X-ray source found with the ROSAT High Resolution Imager (HRI) in a deep pointed observation centered on RXJ1856.5-3754, an isolated radio-quiet neutron star (Walter et al. 1996, Walter & Matthews 1997). Neuhäuser et al. (1997) identified GSC 07916-00050 in order to confirm that it is the true (i.e. possibly X-ray emitting) counterpart to RXJ1855.1-3754, to be able to perform a correct boresight correction of the position of the central HRI source. In addition, Patten (1998) identified three new PMS stars among X-ray sources found in a pointed observation with the ROSAT Positional Sensitive Proportional Counter (PSPC), also listed in Table 1. In Sect. 2, we describe the X-ray data reduction and list all X-ray sources found with RASS (Table 2). Our spectra are presented in Sect. 3 together with lists of potential optical counterparts (Table 3). Then, in Sect. 4, we discuss the results of the spectroscopy including Table 4 with our new TTS. In Sect. 5 we list the available optical and IR photometry for the new TTS; the H-R diagram is shown and discussed in Sect. 6. Then, in Sect. 7, we present proper motions of some of our new PMS stars and discuss the 3D space motion of young stars in CrA. Finally, in Sect. 8, we estimate the completeness of our survey. We summarize our results in the last section.
2 X-ray data reduction
The previously known young stars associated with the CrA dark cloud are located in a small, area around R CrA near and . Because we also expect to find previously unknown young stars around the dark cloud, we investigated the area to and to .
We reduced all RASS II data333Prior to the optical follow-up observations, we reduced the earlier version of the ROSAT data (RASS I) with an earlier version of EXSAS; although the source lists and X-ray properties are sightly different, all newly identified young stars are detected in both RASS I and RASS II. pertaining to that area with the Extended Scientific Analysis Software (EXSAS, Zimmermann et al. 1994) version 98APR running under ESO-MIDAS version 97NOV. We performed standard local and map source detection in the bands soft ( to ), hard 1 ( to ), hard 2 ( to ), hard ( to ), and broad ( to ), as described in detail in Neuhäuser et al. (1995). After merging the source lists, each source was again tested in the above mentioned five bands by a maximum likelihood source detection algorithm. Following Neuhäuser et al. (1995) we accept only sources with corresponding to as real.
The moderate energy resolution of the PSPC allows to extract some spectral information from the RASS data, namely so-called hardness ratios, i.e., X-ray colors, which are defined as follows: If are the count rates in the bands soft, hard 1, and hard 2, respectively, then
| (1) |
I.e., hardness ratios range from to , hardness ratio errors can be larger than . If no counts are detected, e.g, in the soft band, then HR , but one can estimate a lower limit to HR by using the upper limit to the soft band count rate in Eq. (1), similar for upper limits to HR as well as for upper and lower limits to HR .
Listed are all X-ray sources detected in the ROSAT All-Sky Survey sorted by right ascension. We list a running number (used in other tables for cross-reference), the ROSAT source designation, the X-ray source position (), the maximum likelihood of existence , the hardness ratios with errors, the (background subtracted and vignetting corrected) number of counts in the broad band ( to ) with errors, the exposure time in seconds, and for the energy conversion factor in counts .
| No. | Designation | (X-ray) | HR 1 | HR 2 | Counts | Exp. [s] | ||||
|---|---|---|---|---|---|---|---|---|---|---|
| 1 | RXJ1835.1-3404 | 18:35:08.0 | -34:04:20.0 | 10.2 | 8.9 | 4.0 | 147.2 | -10.87 | ||
| 2 | RXJ1835.3-3927 | 18:35:21.5 | -39:27:13.3 | 8.1 | 7.1 | 3.2 | 124.3 | -11.04 | ||
| 3 | RXJ1835.7-3259 | 18:35:47.0 | -32:59:41.5 | 1240.1 | 364.0 | 19.6 | 163.0 | -10.88 | ||
| 4 | RXJ1835.8-3813 | 18:35:49.2 | -38:13:24.1 | 9.8 | 11.7 | 4.3 | 139.4 | -10.91 | ||
| 5 | RXJ1835.8-4046 | 18:35:53.4 | -40:46:23.5 | 10.2 | 3.6 | 2.3 | 125.7 | -10.87 | ||
| 6 | RXJ1835.9-3525 | 18:35:58.3 | -35:25:35.5 | 7.7 | 6.1 | 3.4 | 143.3 | -10.91 | ||
| 7 | RXJ1836.3-4010 | 18:36:18.7 | -40:10:20.2 | 13.1 | 11.2 | 4.0 | 131.5 | -11.31 | ||
| 8 | RXJ1836.6-3451 | 18:36:40.6 | -34:51:33.5 | 13.2 | 9.4 | 3.9 | 139.1 | -10.87 | ||
| 9 | RXJ1837.3-3442 | 18:37:18.2 | -34:42:39.0 | 13.1 | 9.2 | 3.5 | 133.2 | -11.02 | ||
| 10 | RXJ1838.2-3838 | 18:38:17.1 | -38:38:12.9 | 11.8 | 8.0 | 3.3 | 142.1 | -10.87 | ||
| 11 | RXJ1838.3-3523 | 18:38:20.2 | -35:23:32.6 | 10.3 | 9.4 | 3.8 | 140.0 | -11.32 | ||
| 12 | RXJ1839.0-3705 | 18:39:05.8 | -37:05:46.8 | 21.6 | 13.4 | 4.2 | 139.0 | -10.89 | ||
| 13 | RXJ1839.0-3726 | 18:39:05.9 | -37:26:36.0 | 12.3 | 9.7 | 3.9 | 142.1 | -10.90 | ||
| 14 | RXJ1839.2-3854 | 18:39:16.1 | -38:54:13.8 | 9.2 | 3.3 | 2.5 | 135.4 | -10.87 | ||
| 15 | RXJ1839.7-3458 | 18:39:46.8 | -34:58:58.2 | 7.8 | 5.8 | 3.2 | 167.4 | -10.87 | ||
| 16 | RXJ1840.1-3640 | 18:40:09.5 | -36:40:09.1 | 7.9 | 8.6 | 3.6 | 154.6 | -11.02 | ||
| 17 | RXJ1840.6-3728 | 18:40:38.3 | -37:28:44.3 | 13.0 | 8.6 | 3.6 | 150.6 | -10.87 | ||
| 18 | RXJ1840.6-3612 | 18:40:39.7 | -36:12:14.1 | 7.8 | 11.1 | 4.2 | 150.4 | -10.99 | ||
| 19 | RXJ1840.8-3547 | 18:40:53.8 | -35:47:06.2 | 32.7 | 20.2 | 5.0 | 147.3 | -11.12 | ||
| 20 | RXJ1840.9-3350 | 18:40:55.1 | -33:50:52.5 | 14.9 | 16.4 | 5.1 | 180.2 | -11.01 | ||
| 21 | RXJ1841.2-3821 | 18:41:13.5 | -38:21:55.9 | 9.1 | 5.7 | 3.1 | 151.9 | -11.52 | ||
| 22 | RXJ1841.5-3508 | 18:41:34.2 | -35:08:27.7 | 11.2 | 9.5 | 3.8 | 154.7 | -11.04 | ||
| 23 | RXJ1841.8-3525 | 18:41:49.7 | -35:25:44.3 | 58.2 | 26.6 | 5.6 | 140.0 | -10.97 | ||
| 24 | RXJ1842.1-3732 | 18:42:12.0 | -37:32:33.0 | 9.4 | 9.7 | 3.8 | 141.1 | -11.07 | ||
| 25 | RXJ1842.8-3845 | 18:42:48.6 | -38:45:28.3 | 8.7 | 8.7 | 3.6 | 137.4 | -10.87 | ||
| 26 | RXJ1842.9-3451 | 18:42:58.2 | -34:51:00.3 | 7.6 | 3.7 | 2.4 | 154.3 | -10.87 | ||
| 27 | RXJ1842.9-3532 | 18:42:58.4 | -35:32:34.6 | 21.7 | 10.9 | 3.9 | 135.3 | -10.88 | ||
| 28 | RXJ1843.0-3331 | 18:43:05.2 | -33:31:07.6 | 8.1 | 8.7 | 3.9 | 191.5 | -10.99 | ||
| 29 | RXJ1843.4-3314 | 18:43:24.5 | -33:14:31.4 | 11.8 | 14.3 | 5.0 | 194.2 | -11.25 | ||
| 30 | RXJ1844.3-3541 | 18:44:19.5 | -35:41:43.5 | 30.0 | 24.5 | 5.8 | 149.5 | -10.92 | ||
| 31 | RXJ1844.5-3723 | 18:44:31.1 | -37:23:59.8 | 43.4 | 23.2 | 5.2 | 141.1 | -10.94 | ||
| 32 | RXJ1844.5-3739 | 18:44:31.3 | -37:39:13.9 | 10.4 | 6.9 | 3.3 | 134.9 | -10.95 | ||
| 33 | RXJ1844.7-3313 | 18:44:43.4 | -33:13:56.1 | 8.9 | 7.4 | 3.8 | 206.1 | -10.90 | ||
| 34 | RXJ1844.7-3450 | 18:44:45.9 | -34:50:55.2 | 7.9 | 4.8 | 2.9 | 185.1 | -10.92 | ||
| 35 | RXJ1845.1-3324 | 18:45:10.4 | -33:24:26.3 | 10.6 | 9.6 | 3.9 | 200.1 | -11.16 | ||
| 36 | RXJ1845.5-3750 | 18:45:34.4 | -37:50:24.3 | 57.7 | 39.6 | 6.9 | 143.7 | -10.94 | ||
| 37 | RXJ1846.3-3552 | 18:46:18.9 | -35:52:34.0 | 7.9 | 5.6 | 3.0 | 161.1 | -11.52 | ||
| 38 | RXJ1846.7-3604 | 18:46:44.3 | -36:04:40.4 | 8.0 | 5.1 | 2.9 | 143.7 | -10.87 | ||
| 39 | RXJ1846.7-3636 | 18:46:46.2 | -36:36:21.3 | 29.2 | 19.1 | 4.9 | 142.0 | -11.06 | ||
| 40 | RXJ1846.8-3911 | 18:46:53.3 | -39:11:10.3 | 7.8 | 8.9 | 3.6 | 125.3 | -10.97 | ||
| 41 | RXJ1846.9-3503 | 18:46:58.0 | -35:03:59.4 | 9.1 | 7.9 | 3.8 | 176.3 | -10.89 | ||
| 42 | RXJ1847.2-3709 | 18:47:14.3 | -37:09:43.3 | 8.6 | 6.5 | 3.2 | 136.3 | -10.97 | ||
| 43 | RXJ1847.5-3642 | 18:47:32.9 | -36:42:43.9 | 9.6 | 4.6 | 2.3 | 136.0 | -10.88 | ||
| 44 | RXJ1847.7-3606 | 18:47:46.5 | -36:06:12.4 | 29.7 | 15.7 | 4.4 | 154.3 | -10.87 | ||
| 45 | RXJ1847.7-4024 | 18:47:46.9 | -40:24:14.2 | 69.8 | 36.7 | 6.5 | 130.2 | -11.08 | ||
| 46 | RXJ1847.8-3828 | 18:47:51.9 | -38:28:45.9 | 7.4 | 2.2 | 1.7 | 122.5 | -10.87 | ||
| 47 | RXJ1848.2-3415 | 18:48:12.1 | -34:15:41.3 | 8.2 | 9.4 | 4.0 | 202.0 | -10.98 | ||
| 48 | RXJ1848.6-3458 | 18:48:36.1 | -34:58:58.0 | 8.0 | 8.7 | 3.8 | 200.2 | -11.06 | ||
| 49 | RXJ1849.0-3734 | 18:49:02.0 | -37:34:22.7 | 9.6 | 6.0 | 3.0 | 157.8 | -10.87 | ||
| 50 | RXJ1849.1-3546 | 18:49:08.7 | -35:46:41.7 | 45.0 | 22.5 | 5.2 | 193.1 | -10.92 | ||
| 51 | RXJ1851.4-3455 | 18:51:26.1 | -34:55:31.6 | 8.1 | 5.3 | 3.0 | 211.0 | -10.87 | ||
| 52 | RXJ1852.1-3607 | 18:52:10.2 | -36:07:24.9 | 7.8 | 9.4 | 3.8 | 171.9 | -11.03 | ||
| Table 2. X-ray data of our sample (cont.) | ||||||||||
| No. | Designation | (X-ray) | HR 1 | HR 2 | Counts | Exp. [s] | ||||
| 53 | RXJ1852.3-3700 | 18:52:18.2 | -37:00:20.4 | 36.3 | 14.7 | 4.3 | 155.5 | -10.88 | ||
| 54 | RXJ1852.4-3730 | 18:52:25.6 | -37:30:32.4 | 54.4 | 29.4 | 6.0 | 152.8 | -11.21 | ||
| 55 | RXJ1853.1-3609 | 18:53:06.5 | -36:09:54.7 | 55.5 | 37.1 | 6.8 | 190.8 | -11.00 | ||
| 56 | RXJ1853.4-4020 | 18:53:26.3 | -40:20:02.8 | 9.2 | 7.7 | 3.4 | 147.6 | -11.13 | ||
| 57 | RXJ1853.5-3544 | 18:53:36.0 | -35:44:32.7 | 9.4 | 6.4 | 3.3 | 214.1 | -10.87 | ||
| 58 | RXJ1854.4-4010 | 18:54:25.7 | -40:10:21.7 | 9.3 | 7.1 | 3.4 | 154.8 | -10.87 | ||
| 59 | RXJ1854.4-3738 | 18:54:28.2 | -37:38:39.7 | 7.7 | 6.0 | 3.1 | 173.8 | -10.87 | ||
| 60 | RXJ1854.5-3823 | 18:54:34.3 | -38:23:22.2 | 8.5 | 13.0 | 4.6 | 161.7 | -11.18 | ||
| 61 | RXJ1854.9-3600 | 18:54:59.4 | -36:00:26.0 | 8.9 | 9.5 | 4.0 | 232.8 | -10.87 | ||
| 62 | RXJ1855.5-3806 | 18:55:32.5 | -38:06:41.2 | 12.7 | 8.4 | 4.0 | 171.9 | -10.87 | ||
| 63 | RXJ1856.5-3754 | 18:56:35.1 | -37:54:32.7 | 2643.8 | 637.3 | 25.5 | 166.8 | -11.46 | ||
| 64 | RXJ1856.6-3545 | 18:56:43.7 | -35:45:23.1 | 8.9 | 4.7 | 2.7 | 216.0 | -10.87 | ||
| 65 | RXJ1856.7-4021 | 18:56:46.2 | -40:21:10.7 | 12.0 | 7.0 | 3.5 | 166.0 | -10.87 | ||
| 66 | RXJ1857.3-3635 | 18:57:19.8 | -36:35:49.3 | 10.6 | 11.4 | 4.2 | 211.7 | -11.23 | ||
| 67 | RXJ1857.3-3554 | 18:57:22.4 | -35:54:19.4 | 10.0 | 6.7 | 3.3 | 244.5 | -11.52 | ||
| 68 | RXJ1857.5-3732 | 18:57:33.7 | -37:32:57.3 | 10.5 | 5.8 | 2.9 | 176.8 | -10.90 | ||
| 69 | RXJ1857.9-3651 | 18:58:00.1 | -36:51:10.7 | 8.5 | 8.3 | 3.8 | 225.4 | -11.52 | ||
| 70 | RXJ1858.0-3640 | 18:58:05.3 | -36:40:57.2 | 8.1 | 10.3 | 4.3 | 236.1 | -11.08 | ||
| 71 | RXJ1858.4-3446 | 18:58:29.4 | -34:46:53.2 | 32.1 | 27.8 | 6.4 | 312.3 | -10.90 | ||
| 72 | RXJ1858.6-3630 | 18:58:40.4 | -36:30:38.8 | 12.3 | 12.5 | 4.6 | 257.0 | -11.13 | ||
| 73 | RXJ1858.7-3706 | 18:58:43.5 | -37:06:18.3 | 25.1 | 20.9 | 5.3 | 229.4 | -11.14 | ||
| 74 | RXJ1859.0-4051 | 18:59:01.1 | -40:51:19.5 | 8.5 | 6.0 | 3.2 | 154.6 | -10.87 | ||
| 75 | RXJ1859.3-3406 | 18:59:21.7 | -34:06:09.9 | 7.5 | 6.1 | 3.7 | 300.1 | -10.87 | ||
| 76 | RXJ1900.6-3810 | 19:00:38.9 | -38:10:19.5 | 14.2 | 13.4 | 4.9 | 234.9 | -10.87 | ||
| 77 | RXJ1900.8-3453 | 19:00:51.4 | -34:53:08.0 | 7.9 | 9.9 | 4.3 | 296.8 | -10.87 | ||
| 78 | RXJ1900.9-3928 | 19:00:59.6 | -39:28:55.6 | 10.3 | 8.1 | 3.8 | 190.4 | -10.87 | ||
| 79 | RXJ1901.1-3333 | 19:01:08.8 | -33:33:40.8 | 8.9 | 3.6 | 2.4 | 233.9 | -10.87 | ||
| 80 | RXJ1901.1-3648 | 19:01:09.2 | -36:48:01.7 | 9.8 | 9.7 | 4.0 | 272.1 | -10.98 | ||
| 81 | RXJ1901.4-4022 | 19:01:24.6 | -40:22:31.9 | 11.3 | 11.0 | 4.2 | 188.3 | -10.93 | ||
| 82 | RXJ1901.4-3422 | 19:01:26.8 | -34:22:44.8 | 48.4 | 37.7 | 7.1 | 295.0 | -11.05 | ||
| 83 | RXJ1901.5-3700 | 19:01:31.4 | -37:00:55.1 | 37.7 | 26.8 | 6.1 | 268.0 | -10.90 | ||
| 84 | RXJ1901.6-3652 | 19:01:38.9 | -36:52:55.0 | 38.3 | 24.6 | 5.8 | 278.8 | -10.90 | ||
| 85 | RXJ1901.6-3644 | 19:01:39.0 | -36:44:52.4 | 27.1 | 15.2 | 4.8 | 279.1 | -10.87 | ||
| 86 | RXJ1902.0-3822 | 19:02:03.1 | -38:22:02.4 | 8.9 | 8.3 | 3.5 | 237.5 | -11.04 | ||
| 87 | RXJ1902.0-3707 | 19:02:03.1 | -37:07:47.7 | 22.6 | 17.5 | 4.8 | 268.1 | -10.92 | ||
| 88 | RXJ1902.3-3310 | 19:02:20.0 | -33:10:45.8 | 8.0 | 8.1 | 3.7 | 187.4 | -11.40 | ||
| 89 | RXJ1902.3-3655 | 19:02:22.7 | -36:55:42.8 | 7.5 | 4.8 | 2.8 | 282.5 | -10.87 | ||
| 90 | RXJ1902.3-3922 | 19:02:22.8 | -39:22:11.2 | 9.5 | 9.4 | 3.8 | 204.3 | -11.18 | ||
| 91 | RXJ1902.4-3617 | 19:02:24.0 | -36:17:53.5 | 7.6 | 4.1 | 2.7 | 306.9 | -10.87 | ||
| 92 | RXJ1902.5-3504 | 19:02:31.6 | -35:04:58.8 | 9.5 | 7.0 | 3.6 | 305.2 | -11.52 | ||
| 93 | RXJ1902.7-3418 | 19:02:45.6 | -34:18:36.0 | 8.8 | 5.3 | 3.3 | 288.8 | -10.87 | ||
| 94 | RXJ1903.0-3906 | 19:03:01.6 | -39:06:09.4 | 12.9 | 10.4 | 4.1 | 222.5 | -10.87 | ||
| 95 | RXJ1903.0-4009 | 19:03:03.4 | -40:09:09.7 | 18.6 | 13.6 | 4.3 | 194.3 | -10.93 | ||
| 96 | RXJ1904.0-3817 | 19:04:01.7 | -38:17:05.0 | 7.7 | 4.4 | 2.8 | 286.9 | -10.87 | ||
| 97 | RXJ1904.0-3804 | 19:04:04.0 | -38:04:19.0 | 10.2 | 13.5 | 4.8 | 299.3 | -11.31 | ||
| 98 | RXJ1904.0-3824 | 19:04:04.7 | -38:24:56.8 | 7.4 | 5.2 | 3.0 | 293.0 | -11.52 | ||
| 99 | RXJ1904.3-3835 | 19:04:23.7 | -38:35:15.9 | 10.6 | 7.4 | 3.8 | 289.8 | -10.87 | ||
| 100 | RXJ1904.5-3307 | 19:04:34.0 | -33:07:16.0 | 8.0 | 7.9 | 3.7 | 115.6 | -10.88 | ||
| 101 | RXJ1904.5-4028 | 19:04:34.4 | -40:28:31.9 | 7.5 | 7.4 | 3.8 | 218.5 | -11.52 | ||
| 102 | RXJ1904.6-4048 | 19:04:36.4 | -40:48:24.2 | 8.9 | 7.3 | 3.4 | 211.3 | -10.87 | ||
| 103 | RXJ1904.7-3604 | 19:04:43.8 | -36:04:58.5 | 17.8 | 17.6 | 5.1 | 326.7 | -10.94 | ||
| 104 | RXJ1905.0-3817 | 19:05:04.9 | -38:17:46.3 | 9.6 | 11.7 | 4.3 | 313.2 | -11.06 | ||
| 105 | RXJ1905.0-3629 | 19:05:05.2 | -36:29:14.0 | 8.8 | 6.8 | 3.6 | 332.1 | -10.89 | ||
| 106 | RXJ1905.3-3855 | 19:05:18.8 | -38:55:15.1 | 12.1 | 17.5 | 5.1 | 304.2 | -10.92 | ||
| 107 | RXJ1905.3-4030 | 19:05:19.6 | -40:30:59.1 | 8.5 | 12.3 | 4.5 | 247.9 | -11.19 | ||
| 108 | RXJ1906.4-3703 | 19:06:25.0 | -37:03:34.9 | 25.2 | 14.3 | 4.2 | 325.1 | -11.39 | ||
| 109 | RXJ1906.5-3932 | 19:06:31.9 | -39:32:58.1 | 8.8 | 8.6 | 3.9 | 289.6 | -11.47 | ||
| Table 2. X-ray data of our sample (cont.) | ||||||||||
| No. | Designation | (X-ray) | HR 1 | HR 2 | Counts | Exp. [s] | ||||
| 110 | RXJ1906.8-3748 | 19:06:51.2 | -37:48:40.3 | 12.8 | 8.4 | 3.4 | 325.3 | -11.52 | ||
| 111 | RXJ1907.8-3923 | 19:07:50.8 | -39:23:39.8 | 74.9 | 28.8 | 5.9 | 294.9 | -10.87 | ||
| 112 | RXJ1909.6-3949 | 19:09:40.9 | -39:49:37.6 | 35.1 | 20.4 | 5.0 | 322.2 | -10.96 | ||
| 113 | RXJ1909.8-3343 | 19:09:50.9 | -33:43:17.9 | 10.6 | 7.0 | 3.4 | 222.6 | -11.52 | ||
| 114 | RXJ1910.8-3854 | 19:10:48.8 | -38:54:48.4 | 20.0 | 20.7 | 5.4 | 351.6 | -11.09 | ||
| 115 | RXJ1911.5-3434 | 19:11:34.8 | -34:34:59.3 | 40.6 | 26.9 | 6.0 | 323.7 | -10.92 | ||
| 116 | RXJ1911.7-3641 | 19:11:47.4 | -36:41:54.9 | 11.3 | 10.3 | 3.9 | 320.2 | -11.37 | ||
| 117 | RXJ1912.6-3431 | 19:12:36.6 | -34:31:40.5 | 16.7 | 13.8 | 4.5 | 322.2 | -10.95 | ||
| 118 | RXJ1913.0-3633 | 19:13:01.2 | -36:33:04.4 | 22.2 | 16.4 | 4.7 | 319.0 | -10.92 | ||
| 119 | RXJ1913.1-3622 | 19:13:10.2 | -36:22:06.1 | 8.6 | 7.6 | 3.5 | 318.8 | -10.87 | ||
| 120 | RXJ1913.3-3530 | 19:13:21.8 | -35:30:40.1 | 8.3 | 4.7 | 2.8 | 317.9 | -10.87 | ||
| 121 | RXJ1913.6-3543 | 19:13:36.6 | -35:43:10.1 | 11.7 | 5.8 | 3.3 | 307.7 | -10.87 | ||
| 122 | RXJ1913.7-3303 | 19:13:46.3 | -33:03:59.8 | 9.3 | 10.8 | 4.1 | 194.9 | -10.96 | ||
| 123 | RXJ1913.8-3347 | 19:13:50.2 | -33:47:49.1 | 13.9 | 15.8 | 5.2 | 275.4 | -11.10 | ||
| 124 | RXJ1914.4-3532 | 19:14:28.9 | -35:32:27.2 | 8.1 | 7.5 | 3.6 | 292.3 | -10.87 | ||
| 125 | RXJ1914.6-3601 | 19:14:36.3 | -36:01:12.9 | 8.0 | 8.4 | 4.0 | 286.1 | -11.52 | ||
| 126 | RXJ1915.5-3759 | 19:15:32.2 | -37:59:35.3 | 8.5 | 4.6 | 2.7 | 316.6 | -11.52 | ||
| 127 | RXJ1915.5-3528 | 19:15:34.3 | -35:28:45.2 | 7.8 | 9.8 | 4.2 | 283.4 | -10.92 | ||
| 128 | RXJ1915.7-3321 | 19:15:46.7 | -33:21:58.7 | 9.7 | 5.7 | 2.9 | 228.0 | -10.87 | ||
| 129 | RXJ1915.9-3350 | 19:15:58.7 | -33:50:47.7 | 9.3 | 5.1 | 3.2 | 267.5 | -10.87 | ||
| 130 | RXJ1916.2-3548 | 19:16:13.1 | -35:48:20.1 | 11.3 | 13.6 | 4.6 | 283.9 | -10.94 | ||
| 131 | RXJ1916.5-3458 | 19:16:33.7 | -34:58:55.7 | 9.2 | 9.2 | 4.1 | 292.7 | -11.52 | ||
| 132 | RXJ1916.9-4024 | 19:16:58.2 | -40:24:32.0 | 7.8 | 6.0 | 2.9 | 246.5 | -11.42 | ||
| 133 | RXJ1917.0-3331 | 19:17:04.0 | -33:31:04.4 | 28.0 | 17.0 | 5.0 | 219.5 | -10.87 | ||
| 134 | RXJ1917.2-3931 | 19:17:12.9 | -39:31:25.8 | 7.6 | 4.1 | 2.5 | 287.9 | -10.87 | ||
| 135 | RXJ1917.4-3756 | 19:17:24.3 | -37:56:55.4 | 122.6 | 58.1 | 8.2 | 310.7 | -10.97 | ||
| 136 | RXJ1917.8-3927 | 19:17:51.3 | -39:27:33.4 | 7.8 | 5.7 | 3.1 | 286.2 | -10.87 | ||
| 137 | RXJ1918.0-4000 | 19:18:00.7 | -40:00:28.6 | 7.6 | 6.7 | 3.2 | 250.7 | -11.02 | ||
| 138 | RXJ1918.2-3823 | 19:18:12.9 | -38:23:05.8 | 1044.6 | 319.8 | 18.3 | 307.7 | -11.10 | ||
| 139 | RXJ1918.4-3913 | 19:18:25.1 | -39:13:30.9 | 7.7 | 7.8 | 3.6 | 299.9 | -10.94 | ||
| 140 | RXJ1919.4-4031 | 19:19:29.1 | -40:31:34.7 | 9.0 | 12.1 | 4.4 | 209.3 | -11.09 | ||
| 141 | RXJ1919.5-3639 | 19:19:31.5 | -36:39:37.2 | 9.4 | 8.3 | 3.9 | 298.4 | -11.49 | ||
| 142 | RXJ1919.9-3924 | 19:19:55.3 | -39:24:56.6 | 16.5 | 14.8 | 4.7 | 306.5 | -11.21 | ||
| 143 | RXJ1919.9-4009 | 19:19:59.1 | -40:09:22.0 | 7.5 | 10.4 | 4.1 | 252.7 | -11.25 | ||
| 144 | RXJ1920.6-3911 | 19:20:41.4 | -39:11:29.6 | 7.9 | 7.3 | 3.3 | 314.8 | -10.93 | ||
| 145 | RXJ1920.9-3320 | 19:20:59.0 | -33:20:06.7 | 9.5 | 10.4 | 4.0 | 257.8 | -11.00 | ||
| 146 | RXJ1921.1-4002 | 19:21:09.2 | -40:02:14.4 | 9.6 | 8.6 | 4.1 | 264.9 | -11.52 | ||
| 147 | RXJ1921.4-3459 | 19:21:28.9 | -34:59:04.4 | 472.1 | 202.2 | 14.9 | 300.4 | -11.11 | ||
| 148 | RXJ1922.0-3549 | 19:22:01.8 | -35:49:16.1 | 9.8 | 7.8 | 4.0 | 311.7 | -10.87 | ||
| 149 | RXJ1922.4-3806 | 19:22:24.3 | -38:06:13.6 | 8.3 | 6.7 | 3.4 | 303.9 | -10.87 | ||
| 150 | RXJ1922.9-3545 | 19:22:55.3 | -35:45:39.2 | 21.4 | 10.5 | 3.9 | 303.9 | -10.87 | ||
| 151 | RXJ1923.3-3658 | 19:23:18.9 | -36:58:39.3 | 9.7 | 10.2 | 4.0 | 320.7 | -11.10 | ||
| 152 | RXJ1923.6-3551 | 19:23:37.6 | -35:51:39.8 | 8.7 | 6.2 | 3.2 | 298.5 | -10.87 | ||
| 153 | RXJ1923.8-3700 | 19:23:51.9 | -37:00:08.2 | 7.6 | 7.4 | 3.3 | 311.9 | -10.96 | ||
| 154 | RXJ1923.8-4036 | 19:23:53.3 | -40:36:46.4 | 66.9 | 33.1 | 6.3 | 275.6 | -11.10 | ||
| 155 | RXJ1924.1-3333 | 19:24:09.9 | -33:33:10.2 | 8.0 | 9.7 | 4.2 | 296.8 | -10.91 | ||
| 156 | RXJ1924.3-4008 | 19:24:20.2 | -40:08:35.5 | 7.7 | 10.0 | 4.3 | 309.0 | -11.08 | ||
| 157 | RXJ1924.4-3959 | 19:24:27.9 | -39:59:29.1 | 10.3 | 6.9 | 3.2 | 307.9 | -10.95 | ||
| 158 | RXJ1924.5-3442 | 19:24:34.0 | -34:42:34.6 | 20.5 | 15.0 | 4.5 | 298.9 | -11.17 | ||
| 159 | RXJ1924.7-3601 | 19:24:47.3 | -36:01:15.1 | 7.5 | 7.7 | 3.5 | 297.7 | -11.11 | ||
| 160 | RXJ1925.0-3621 | 19:25:02.7 | -36:21:39.1 | 10.1 | 8.2 | 3.4 | 297.3 | -11.06 | ||
| 161 | RXJ1925.0-3549 | 19:25:03.9 | -35:49:34.4 | 7.6 | 10.8 | 4.6 | 297.0 | -10.87 | ||
| 162 | RXJ1925.3-3413 | 19:25:21.4 | -34:13:06.4 | 7.4 | 9.6 | 4.3 | 312.5 | -11.52 | ||
| 163 | RXJ1926.5-3426 | 19:26:31.8 | -34:26:25.7 | 7.6 | 6.8 | 3.5 | 300.9 | -11.52 | ||
| 164 | RXJ1927.1-3713 | 19:27:06.2 | -37:13:42.2 | 14.6 | 10.2 | 4.0 | 316.9 | -10.87 | ||
| 165 | RXJ1927.4-3847 | 19:27:28.0 | -38:47:06.9 | 28.3 | 17.3 | 5.0 | 307.7 | -10.87 | ||
| 166 | RXJ1927.9-3955 | 19:27:55.0 | -39:55:03.8 | 7.9 | 5.5 | 3.0 | 325.6 | -11.52 | ||
| Table 2. X-ray data of our sample (cont.) | ||||||||||
| No. | Designation | (X-ray) | HR 1 | HR 2 | Counts | Exp. [s] | ||||
| 167 | RXJ1928.0-4050 | 19:28:04.8 | -40:50:04.0 | 46.2 | 31.1 | 6.5 | 322.3 | -10.94 | ||
| 168 | RXJ1928.2-3352 | 19:28:13.1 | -33:52:16.1 | 11.9 | 8.2 | 3.5 | 281.6 | -10.87 | ||
| 169 | RXJ1928.2-3915 | 19:28:13.3 | -39:15:13.5 | 7.4 | 5.1 | 3.0 | 320.8 | -10.91 | ||
| 170 | RXJ1928.3-4031 | 19:28:20.6 | -40:31:19.7 | 10.3 | 9.4 | 4.4 | 325.7 | -10.87 | ||
| 171 | RXJ1928.5-3508 | 19:28:31.6 | -35:08:02.0 | 268.9 | 88.8 | 9.9 | 307.2 | -10.90 | ||
| 172 | RXJ1928.7-3646 | 19:28:46.3 | -36:46:38.6 | 13.6 | 9.7 | 3.7 | 308.9 | -10.87 | ||
| 173 | RXJ1929.0-3805 | 19:29:03.2 | -38:05:15.8 | 8.6 | 7.5 | 4.0 | 324.6 | -10.98 | ||
| 174 | RXJ1929.2-4055 | 19:29:16.0 | -40:55:20.4 | 9.1 | 5.4 | 2.8 | 329.9 | -11.52 | ||
| 175 | RXJ1929.6-4018 | 19:29:36.5 | -40:18:53.6 | 39.3 | 26.9 | 5.9 | 344.0 | -10.90 | ||
| 176 | RXJ1929.8-3702 | 19:29:50.0 | -37:02:35.7 | 14.8 | 12.9 | 4.6 | 318.8 | -11.36 | ||
| 177 | RXJ1929.9-3338 | 19:29:57.4 | -33:38:16.7 | 8.9 | 8.5 | 3.9 | 281.0 | -10.87 | ||
| 178 | RXJ1930.0-3302 | 19:30:03.1 | -33:02:55.2 | 7.9 | 6.0 | 3.7 | 248.9 | -11.52 | ||
| 179 | RXJ1930.6-3525 | 19:30:39.2 | -35:25:47.5 | 13.8 | 13.6 | 4.7 | 324.4 | -10.87 | ||
| 180 | RXJ1931.1-3441 | 19:31:08.1 | -34:41:06.6 | 11.0 | 9.6 | 4.1 | 319.5 | -10.87 | ||
| 181 | RXJ1931.4-4008 | 19:31:25.1 | -40:08:46.9 | 8.8 | 6.4 | 3.2 | 344.1 | -10.93 | ||
| 182 | RXJ1931.5-3340 | 19:31:32.5 | -33:40:15.9 | 7.8 | 5.8 | 3.3 | 272.9 | -11.52 | ||
| 183 | RXJ1931.6-3354 | 19:31:37.7 | -33:54:38.7 | 96.7 | 52.5 | 8.4 | 285.2 | -10.88 | ||
| 184 | RXJ1932.3-3804 | 19:32:19.3 | -38:04:58.6 | 7.4 | 6.0 | 3.3 | 324.9 | -10.87 | ||
| 185 | RXJ1932.5-3506 | 19:32:33.5 | -35:06:32.9 | 7.8 | 8.0 | 3.8 | 313.0 | -10.87 | ||
| 186 | RXJ1932.5-3837 | 19:32:34.1 | -38:37:00.5 | 10.6 | 6.5 | 3.6 | 329.6 | -10.87 | ||
| 187 | RXJ1932.7-3432 | 19:32:44.3 | -34:32:22.7 | 11.8 | 13.4 | 4.6 | 305.7 | -11.19 | ||
| 188 | RXJ1932.7-3858 | 19:32:45.6 | -38:58:39.6 | 9.5 | 7.4 | 3.6 | 336.0 | -10.89 | ||
| 189 | RXJ1932.9-3554 | 19:32:56.0 | -35:54:23.0 | 7.9 | 5.6 | 3.2 | 314.9 | -10.87 | ||
| 190 | RXJ1933.2-3337 | 19:33:18.1 | -33:37:29.4 | 10.5 | 8.8 | 3.9 | 284.4 | -10.95 | ||
| 191 | RXJ1933.3-3812 | 19:33:20.2 | -38:12:30.8 | 14.7 | 10.9 | 4.0 | 350.1 | -10.92 | ||
| 192 | RXJ1933.5-3743 | 19:33:33.5 | -37:43:46.7 | 7.4 | 5.6 | 3.5 | 336.1 | -11.52 | ||
| 193 | RXJ1933.6-3453 | 19:33:41.6 | -34:53:27.1 | 11.8 | 13.2 | 4.7 | 321.7 | -10.91 | ||
| 194 | RXJ1933.8-3522 | 19:33:51.3 | -35:22:53.1 | 7.6 | 9.0 | 3.9 | 320.6 | -11.17 | ||
| 195 | RXJ1934.5-3620 | 19:34:33.6 | -36:20:43.0 | 9.0 | 6.8 | 3.7 | 318.2 | -10.87 | ||
| 196 | RXJ1934.6-3433 | 19:34:41.1 | -34:33:33.2 | 7.7 | 9.0 | 4.2 | 328.1 | -11.52 | ||
| 197 | RXJ1934.7-3805 | 19:34:46.7 | -38:05:06.0 | 52.9 | 30.8 | 6.3 | 342.6 | -10.91 | ||
| 198 | RXJ1935.5-3536 | 19:35:34.2 | -35:36:10.9 | 9.9 | 8.3 | 3.5 | 329.8 | -10.98 | ||
| 199 | RXJ1936.0-3325 | 19:36:03.6 | -33:25:59.1 | 8.8 | 4.5 | 2.7 | 274.4 | -10.88 | ||
| 200 | RXJ1936.0-4002 | 19:36:05.6 | -40:02:24.6 | 10.7 | 9.9 | 3.8 | 335.3 | -11.14 | ||
| 201 | RXJ1936.9-3429 | 19:36:56.9 | -34:29:28.0 | 9.4 | 8.7 | 3.8 | 305.6 | -11.01 | ||
| 202 | RXJ1937.2-3958 | 19:37:12.6 | -39:58:01.1 | 22.1 | 21.6 | 5.6 | 333.6 | -10.98 | ||
| 203 | RXJ1937.2-4010 | 19:37:13.2 | -40:10:21.5 | 11.8 | 8.8 | 4.0 | 335.8 | -10.87 | ||
| 204 | RXJ1938.0-3801 | 19:38:03.0 | -38:01:05.8 | 10.3 | 7.7 | 3.6 | 346.1 | -11.07 | ||
| 205 | RXJ1938.1-3914 | 19:38:09.4 | -39:14:02.4 | 9.3 | 3.6 | 2.6 | 345.0 | -10.87 | ||
| 206 | RXJ1938.2-4006 | 19:38:13.1 | -40:06:38.1 | 7.8 | 7.6 | 4.0 | 333.7 | -10.95 | ||
In Table 2, we list all RASS X-ray sources detected in our study area with X-ray position, likelihood for existence, hardness ratio, number of counts, exposure time, and individual energy conversion factor
| (2) |
according to Schmitt et al. (1995).
In Table 3, we list the optical counterparts to the X-ray sources, most of which are the closest counterparts, but in four cases, the most likely counterpart turned out to be not the closest potential optical counterpart. Table 3 gives optical positions, offsets between X-ray and optical positions, V magnitudes, X-ray to optical flux ratios, identification information, e.g. whether it is a new young star, and remarks, e.g. on previously known stars found among our X-ray sources. The typical positional error of RASS sources is 40 arc sec (Neuhäuser et al. 1995), which we allow as offset between optical and X-ray position for source identification. We searched for stellar counterparts in Simbad, the Hubble Space Telescope Guide Star Catalog (GSC), and the NASA Extragalactic Database (NED). We list in Table 3 the optical positions, V magnitude, X-ray to optical flux ratio, as well as some more information on the identified counterparts. See Sect. 3 for details on the identification. For calculating the X-ray to optical flux ratio, we use
| (3) |
(with in ) and the X-ray flux, which we get from the data in Table 2 via
| (4) |
For sources where we can list only an upper or lower limit to HR 1 (in Table 2), we use HR or HR, respectively, for calculating the flux according to Eq. (2). The X-ray to optical flux ratio already gives some hints on the nature of an unidentified X-ray source: Extragalactic X-ray sources are optically faint but X-ray bright with , while normal stars usually have (Stocke et al. 1983, Motch et al. 1998).
For each X-ray source listed in Table 2, we list here the optical counterpart from Simbad, GSC, or NED, unless no counterpart is found within arc sec around the X-ray position (in all but four cases, these counterparts are the closest ones). We list running number as in Table 2, optical position, offset between X-ray and optical position (in arc seconds), optical magnitude ( in mag), and the (log of the) X-ray to optical flux ratio. In the column ID, we list the nature of the counterpart, i.e. y for new young star listed in Table 4, z for zero-age main-sequence stars (i.e. low lithium), d for dKe or dMe stars, e for extra-galactic, n for neither of the above (mostly old stars), p for previously known TTS or non-TTS (not observed optically except TY CrA); counterparts without any entry in the column ID have not been observed optically. Finally, some remarks are given as found in Simbad (like proper motion PM as in milli arc seconds per year and radial velocity RV in ). or from our optical follow-up observations. Data on optical counterparts are taken from Simbad or NED, if remarks are listed, otherwise from GSC. Some GSC counterparts appear on several GSC plates which may have different colors and different filters; we have always chosen the closest counterpart. For stars with V mag given with colons, positions and magnitudes are estimated from the DSS charts, because the identified counterpart is different from the relevant Simbad/GSC/NED counterpart.
| No. | Optical position | ID | Remarks | ||||
|---|---|---|---|---|---|---|---|
| Tab. 2 | [”] | mag | |||||
| 1 | 18:35:06.2 | -34:04:02.8 | 28 | 13.9 | |||
| 3 | 18:35:46.6 | -32:59:31.2 | 12 | 9.8 | p | globular cluster NGC 6652 | |
| 8 | 18:36:39.5 | -34:51:25.0 | 16 | 13.0 | y | ||
| 9 | 18:37:17.6 | -34:42:42.2 | 8 | 11.3 | n | ||
| 11 | 18:38:20.2 | -35:23:37.2 | 5 | 12.2 | d | dKe star | |
| 12 | 18:39:04.9 | -37:05:27.8 | 22 | 13.1 | n | ||
| 13 | 18:39:05.3 | -37:26:21.8 | 16 | 10.9 | y | ||
| 17 | 18:40:37.6 | -37:28:18.1 | 28 | 11.2 | d | dKe star | |
| 19 | 18:40:53.3 | -35:46:44.6 | 22 | 14.5: | y | ||
| 23 | 18:41:48.6 | -35:25:43.6 | 14 | 9.7 | y | ||
| 27 | 18:42:58.0 | -35:32:42.9 | 10 | 12.2 | y | ||
| 30 | 18:44:21.9 | -35:41:43.6 | 29 | 11.3 | y | ||
| 31 | 18:44:31.1 | -37:23:34.3 | 26 | 13.1 | y | ||
| 35 | 18:45:09.3 | -33:24:03.9 | 26 | 12.3 | n | ||
| 36 | 18:45:34.8 | -37:50:19.6 | 7 | 9.2 | y | HD 173148, G5 V, PM=[4.7,-32.0] | |
| 38 | 18:46:43.9 | -36:04:52.2 | 13 | 12.0 | IRAS 18433-3608 | ||
| 39 | 18:46:45.6 | -36:36:18.1 | 8 | 10.3 | y | ||
| 42 | 18:47:14.0 | -37:09:48.3 | 6 | 12.1 | |||
| 45 | 18:47:44.6 | -40:24:22.2 | 34 | 5.2 | n | CrA, G5.5 I, PM=[24.6,-18.6], RV=-18.2, d=120 pc | |
| 48 | 18:48:35.8 | -34:58:20.4 | 38 | 13.3 | |||
| 53 | 18:52:17.3 | -37:00:12.0 | 14 | 13.9 | y | IRAS 18489-3703 | |
| 54 | 18:52:24.8 | -37:30:35.6 | 10 | 12.5 | d | dMe star | |
| 55 | 18:53:06.0 | -36:10:22.8 | 28 | 9.6 | y | HD 174656, G6 IV, PM=[-1.2,-34.0] | |
| 59 | 18:54:29.0 | -37:39:04.5 | 26 | 11.8 | |||
| 63 | 18:56:37.3 | -37:54:26.9 | 26 | 25.7 | p | neutron star RXJ1856.5-3754 | |
| 64 | 18:56:44.0 | -35:45:31.9 | 10 | 13.0 | y | ||
| 65 | 18:56:49.2 | -40:21:07.0 | 34 | 14.9 | |||
| 68 | 18:57:34.1 | -37:32:32.3 | 25 | 15.0: | y | ||
| 73 | 18:58:43.4 | -37:06:26.5 | 7 | 4.9 | p | CrA, F2 V, W UMa-type, d=30 pc | |
| 77 | 19:00:49.5 | -34:52:49.2 | 33 | 8.4 | HD 176247, G1 V, PM=[23.4,-24.0] | ||
| 80 | 19:01:09.5 | -36:47:51.7 | 11 | 12.7 | y | VSS VIII-27 | |
| 81 | 19:01:26.7 | -40:22:34.0 | 24 | 13.6 | n | ||
| 82 | 19:01:28.7 | -34:22:35.5 | 25 | 8.2 | y | HD 176383, F5 V, PM=[9.9,-46.8] | |
| 83 | 19:01:34.9 | -37:00:55.8 | 7 | 11.3 | p | CrAPMS 1, K1 IV, wTTS | |
| 84 | 19:01:40.8 | -36:52:34.2 | 30 | 9.5 | p | TY CrA, Herbig Ae/Be PMS star | |
| 85 | 19:01:40.5 | -36:44:31.9 | 27 | 13.0: | y | VSS VIII-26 | |
| 87 | 19:02:01.9 | -37:07:43.2 | 14 | 10.4 | p | CrAPMS 2, G5 IV, wTTS, PM=[0.0,-33.0] | |
| 89 | 19:02:22.1 | -36:55:40.8 | 2 | 13.8 | p | CrAPMS 3, K2 IV, wTTS | |
| 90 | 19:02:22.7 | -39:22:21.9 | 11 | 14.2 | |||
| 91 | 19:02:25.9 | -36:17:39.0 | 32 | e | galaxy CGMW 4-4634 | ||
| 93 | 19:02:43.6 | -34:19:00.4 | 35 | 13.7 | |||
| 95 | 19:03:00.6 | -40:09:16.8 | 33 | 13.4 | n | ||
| 97 | 19:03:58.4 | -38:04:01.0 | 70 | 13.1 | z | ||
| 102 | 19:04:38.8 | -40:48:15.4 | 29 | 11.4 | |||
| 108 | 19:06:24.8 | -37:03:41.7 | 7 | 5.0 | n | CrA, F8 V, PM=[95,-274], RV=-51.0, d=21 pc | |
| 110 | 19:06:52.5 | -37:48:37.6 | 16 | 6.2 | n | HR 7232, G5 IV, d=17 pc | |
| 111 | 19:07:50.4 | -39:23:32.2 | 9 | 14.2 | z | ||
| Table 3. Closest optical counterparts (cont.) | |||||||
| No. | Optical position | ID | Remarks | ||||
| [”] | mag | ||||||
| 112 | 19:09:39.8 | -39:49:38.4 | 16 | 6.5 | n | HR 7255, K1 III, PM=[-4.9,-21.7], d=107 pc | |
| 114 | 19:10:47.8 | -38:54:34.7 | 19 | 7.6 | n | HD 178558, F5 V, PM=[26.7,-33.5], d=61 pc | |
| 115 | 19:11:34.7 | -34:35:09.1 | 10 | 10.7 | d | dKe star | |
| 116 | 19:11:47.1 | -36:41:42.9 | 7 | 13.5 | d | dMe star | |
| 117 | 19:12:35.8 | -34:31:31.8 | 14 | 11.4 | n | ||
| 119 | 19:13:10.5 | -36:21:46.0 | 20 | 12.9 | |||
| 122 | 19:13:44.8 | -33:04:06.6 | 20 | 14.1 | |||
| 123 | 19:13:51.8 | -33:48:21.4 | 38 | 14.6 | |||
| 127 | 19:15:32.5 | -35:28:49.2 | 23 | 14.4 | |||
| 128 | 19:15:46.7 | -33:22:06.3 | 7 | 12.3 | z | see (1) | |
| 130 | 19:16:13.8 | -35:48:11.7 | 11 | 14.0 | d | dKe star | |
| 135 | 19:17:23.8 | -37:56:50.4 | 8 | 9.9 | y | SAO 211129, K2, PM=[3.5,-31.0] | |
| 138 | 19:18:12.4 | -38:23:04.2 | 5 | 8.6 | n | HD 180445, G8 V, PM=[99.5,-93.0], d=42 pc | |
| 139 | 19:18:27.0 | -39:13:01.4 | 37 | 13.8 | |||
| 141 | 19:19:31.0 | -36:39:30.7 | 12 | 7.2 | n | HD 180802, F7 V, PM=[36.4,-95.4], d=49 pc | |
| 142 | 19:19:54.7 | -39:25:10.1 | 13 | 9.2 | n | HD 180863, G8/K0 III, PM=[10.4,-126.0] | |
| 145 | 19:21:01.0 | -33:20:28.7 | 34 | 14.1 | |||
| 147 | 19:21:29.7 | -34:59:00.6 | 11 | 6.5 | z | HR 7330, G1.5 V, d=21 pc, see (2) | |
| 151 | 19:23:20.0 | -36:58:31.0 | 16 | 11.0 | |||
| 154 | 19:23:53.0 | -40:36:56.5 | 10 | 4.0 | p | Sgr, B8 V, PM=[32.7,-120.8], RV=-0.7, d=52 pc | |
| 155 | 19:24:07.5 | -33:33:30.0 | 36 | 15.6 | |||
| 158 | 19:24:34.9 | -34:42:37.9 | 11 | 15.3 | d | dMe star | |
| 165 | 19:27:26.7 | -38:46:39.4 | 32 | 15.6 | n | ||
| 166 | 19:27:56.6 | -39:54:39.4 | 30 | 13.1 | |||
| 167 | 19:28:05.5 | -40:50:04.1 | 7 | 8.2 | p | HD 182776, K2.5 III, RS CVn-type, d=240 pc | |
| 169 | 19:28:12.4 | -39:14:56.5 | 20 | 15.3 | |||
| 171 | 19:28:31.9 | -35:07:58.8 | 3 | 8.7 | z | HD 182928, G5 V, PM=[-16.3,-14.4], d=234 pc, see (1) | |
| 172 | 19:28:48.7 | -36:46:19.5 | 35 | 12.5 | n | ||
| 174 | 19:29:13.1 | -40:55:15.0 | 34 | 13.7 | n | ||
| 175 | 19:29:35.0 | -40:18:39.2 | 22 | 12.9 | z | IRAS 19261-4024, see (1) | |
| 176 | 19:29:51.1 | -37:02:16.7 | 21 | 9.1 | n | HD 183198, G6 V, PM=[-22.2,-14.7], d=46 pc | |
| 177 | 19:29:57.8 | -33:38:16.6 | 5 | 13.1 | |||
| 178 | 19:30:01.6 | -33:02:43.1 | 22 | 12.6 | |||
| 179 | 19:30:38.3 | -35:26:21.8 | 36 | 13.4 | n | ||
| 181 | 19:31:22.9 | -40:08:19.8 | 37 | 12.2 | n | ||
| 183 | 19:31:38.7 | -33:54:43.2 | 16 | 17.0 | e | galaxy PKS 1928-340 | |
| 187 | 19:32:43.8 | -34:32:14.4 | 10 | 14.1 | n | ||
| 189 | 19:32:54.1 | -35:54:33.7 | 25 | 14.9 | |||
| 190 | 19:33:17.8 | -33:37:43.0 | 14 | 15.4 | n | ||
| 191 | 19:33:19.6 | -38:12:13.6 | 19 | 12.0: | z | ||
| 193 | 19:33:40.4 | -34:53:32.0 | 15 | 12.5 | |||
| 195 | 19:34:32.6 | -36:21:11.6 | 31 | 13.4 | z | ||
| 197 | 19:34:46.6 | -38:05:15.2 | 9 | 8.9 | n | HD 184189, M2 III, 19” binary | |
| 199 | 19:36:01.5 | -33:25:42.9 | 31 | 14.8 | |||
| 200 | 19:36:04.3 | -40:02:58.6 | 37 | 12.6 | z | ||
| 202 | 19:37:16.3 | -39:58:01.4 | 56 | 19.0 | e | quasar PKS 1933-400 | |
Notes: (1) Maybe weak lithium (or noise), complex H, maybe double-lined, could be ZAMS, RS CVn-type, dKe/dMe, or a cool Algol. (2) Our detection of weak lithium with (Li)(Ca) confirms the classification of HR 7330 as member of the 200 Myr old nearby Castor moving group by Barrado y Navascues (1998).
3 Optical follow-up spectroscopy
Out of the 206 X-ray sources, 89 have one or several nearby ( arc sec) potential optical counterparts (brighter than mag) in Simbad and/or GSC, including four previously known PMS stars (namely CrAPMS 1, 2, 3, and TY CrA) and four previously known older stars. In addition, there is one optically faint neutron star ( mag, see footnote 2) and three extra-galactic sources (see Table 3). To identify a large fraction of the remaining 81 unidentified X-ray sources, we performed low-resolution spectroscopy of 148 stars, which are potential optical counterparts to 56 of those 81 X-ray sources.
Low-dispersion spectra were taken with the Boller & Chivens spectrograph of the ESO 1.5m telescope on La Silla in twelve nights, namely 1995 July 16/17 to 21/22 and 1996 July 20/21 to 25/26. The wavelength range is 4500 to 6850Å and the spectral resolution is Å. For technical details and data reduction, we refer to the relevant part of Sect. 2.2 in Walter et al. (1997).
In addition to those potential RASS source counterparts, we also observed a number of previously known or suspected young stars in CrA, because their lithium line strength was not known, see Table 1 for those data; most of these spectra were taken with the Boller & Chivens spectrograph. However, the stars HBC 673, 675, 677, and CrAPMS 3/c were observed with the ESO-3.5m-NTT444taken during ESO program 63.L-0023 at the end of the night 18/19 April 1999, when the main targets of that run were not visible anymore. Here, we observed in the red medium-dispersion mode (EMMI red arm, CCD , grating 6) at a resolution of 5500 in the wavelength range from 6160 to 7740 Å. While we could not detect lithium in HBC 673 and 675, we confirmed HBC 677 to be a cTTS and CrAPMS 3/c to be a wTTS (see Table 1).
For most of the RASS counterparts with detected lithium (in low-resolution spectra), we then took high-resolution spectra to confirm their youth. The high dispersion spectra were obtained with the CTIO 4m telescope and echelle spectrograph on 14 to 17 July 1998. We used the 226-3 cross disperser and the 31.6 l/mm echelle with the red optics. We used the SITe 2K #6 CCD detector, at a gain of 5, corresponding to about 1 e- per ADU and a read noise of about 3 e-. We used the GG385 filter for order sorting. We used a 150 m (1 arcsec) slit and decker #9 (3.3 arcsec) for the stellar observations. The seeing was generally 1 to 1.5 arcsec, and there were some clouds on 3 of the 4 nights. The spectra cover the range from roughly 4400Å through 7500Å at a resolution of 25000. We obtained projector flat images to flatten the spectra. A Th-Ar comparison source was observed before and after each telescope slew. Each stellar observation was made in three parts to facilitate cosmic ray removal. Initial reductions were undertaken at CTIO, using the IRAF DOECSLIT package. We corrected for bias, extracted the orders, divided by the flats, and solved for the dispersion. The data were rebinned to a linear wavelength scale in each order. We removed the global background (the scattered light correction) but did not attempt to subtract the local background. The data were further reduced using IDL. We flattened the spectra in each order to remove any residual curvature left from the original flat division. We trimmed the ends of the orders. We then filtered the three individual spectra of each object to remove cosmic rays, and coadded the spectra. We determine radial velocities by cross-correlating the spectra against the sky spectra. We expect an internal precision of about 1 km/s, except for the targets with poorer S/N.
4 Results of the spectroscopy
Stars which fullfill all the following conditions (according to their high-resolution spectra, if available, otherwise we use the low-resolution spectra) are classified as new PMS stars, i.e. appear as such in Table 4:
-
•
Spectral type later than mid F, and
-
•
lithium 6708Å line with (Li)Å, and
-
•
more Li than ZAMS stars of the same spectral type, and
-
•
(Li)(Ca) (for spectral types F, G, and K)555X-ray emitting M-type stars with lithium are always pre-MS stars, as they burn all Lithium before reaching the MS (see e.g. Covino et al. 1997)..
All these stars are classified as young stars (letter y in column ID in Table 3).
Table 4 lists for all newly discovered TTS their official designation, PMS type (i.e. whether wTTS or cTTS), the spectral type, thje H and lithium equivalent widths, the projected rotational velocity, the radial velocity, the X-ray luminosity, and some remarks, e.g. on binarity.
All stars with a detected lithium line, which is weaker than Å, and all F-, G-, and K-type stars with a detected lithium line, which is weaker than the Ca 6718Å line, are classified as ZAMS stars (letter z in column ID in Table 3). Stars without detectable lithium, but H emission are classified as dKe or dMe stars (letter d in column ID in Table 3).
In Table 3, we list the nature of the newly identified X-ray sources. Among the 56 X-ray sources for which we performed low-resolution spectroscopy of potential optical counterparts, we identified 19 new pre-main sequence stars, nine new zero-age main-sequence stars, and seven new dKe/dMe stars. Two of the new PMS stars have Å, i.e. are classical TTS, and 17 are weak-line TTS, four of which form two visual pairs, which are spatially unresolved with ROSAT, i.e. one pair corresponds to one X-ray source each.
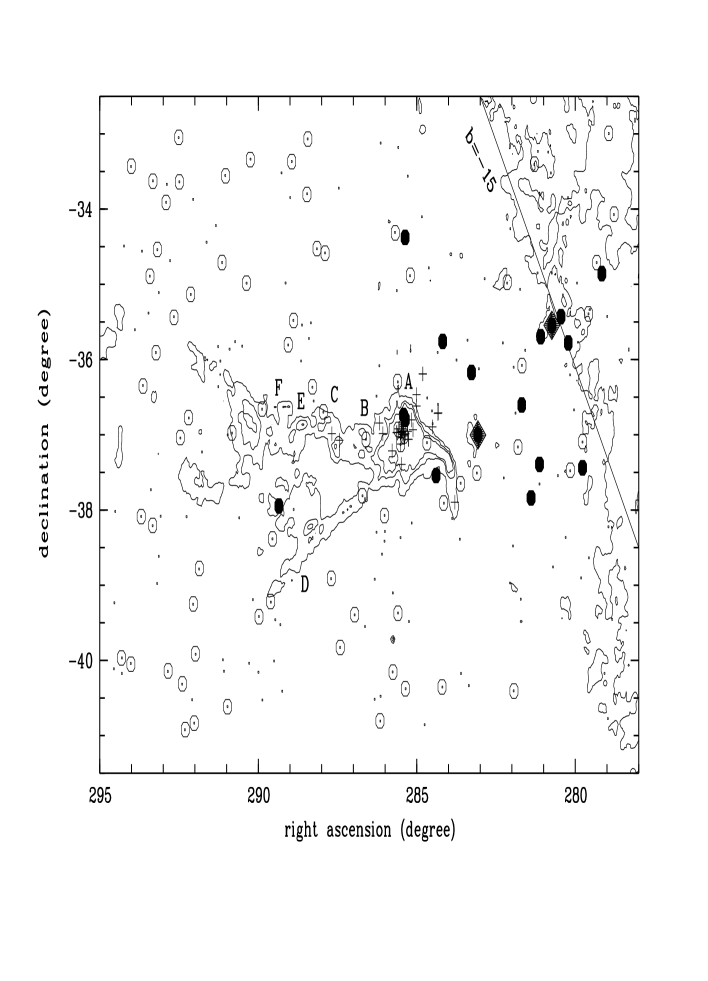
The spatial distribution of the CrA RASS sources and TTS is shown in Fig. 1. While all the previously known TTS in CrA including those found by EO cluster on the main dark cloud, the new ROSAT TTS are more widely distributed. In particular, they are almost all located west of the cloud. The two new cTTS appear to be situated in two small cloud-lets, where they most certainly have formed. The new wTTS may have also formed in such small cloud-lets outside the current borders of the CrA cloud, and those small cloud-lets may well have dispersed since they formed stars, similar to some seemingly off-cloud wTTS near Cha I (Alcalá et al. 1995, Mizuno et al. 1998), see below.
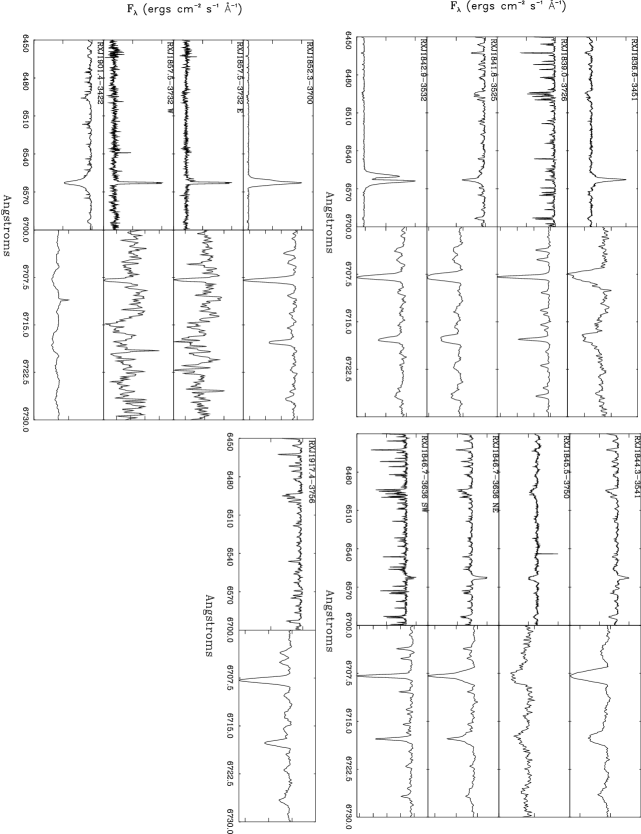
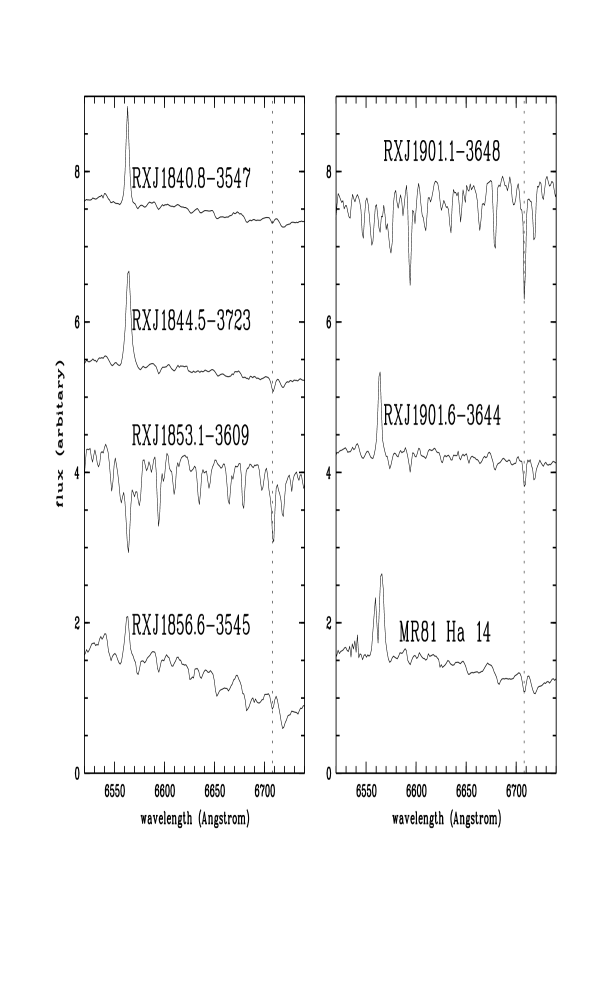
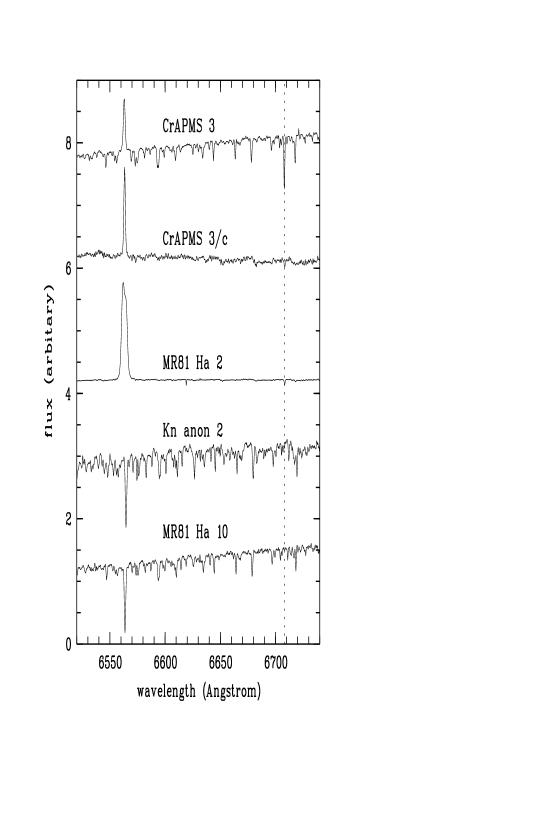
Finding charts for the new PMS stars can be found in Fig. 2, the optical spectra for our new TTS are shown in Fig. 3 (high-resolution spectra from CTIO, if available) and Fig. 4 (low-resolution spectra from ESO-1.52m for the other new TTS). In Fig. 5, we also show the four spectra of previously suspected young stars obtained at the ESO-3.5m-NTT.
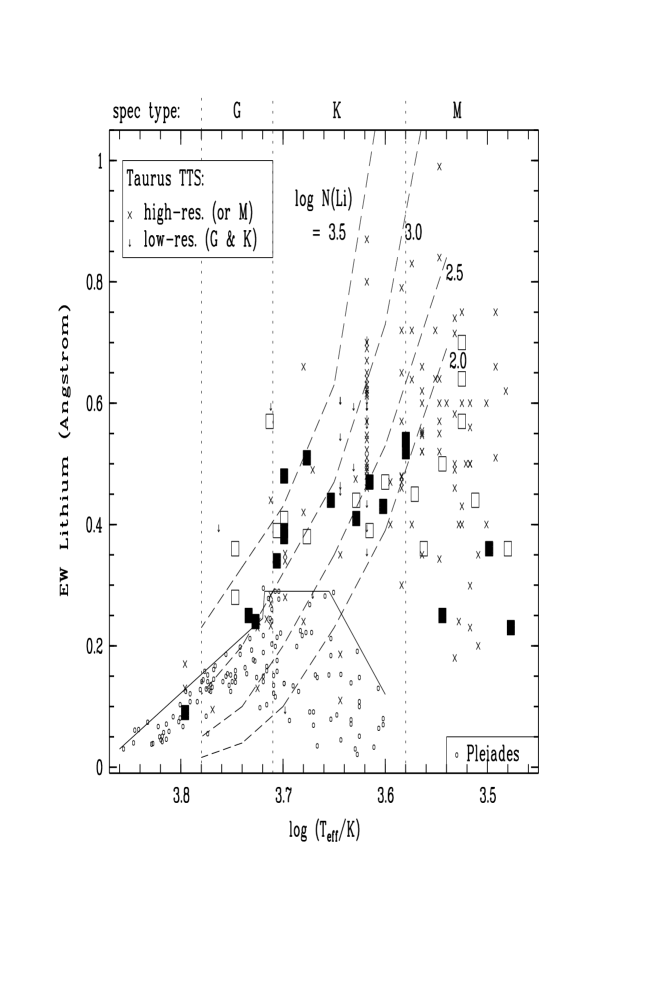
As seen in Fig. 6, all new TTS show more lithium than ZAMS stars of the same spectral type, i.e. are younger than ZAMS; hence, they are pre-MS stars. There are some new M-type TTS in CrA, which have depleted more than half of their primordial lithium (lower right of Fig. 6). As for similar M-type TTS in Taurus, these objects could be classified as post-TTS.
We list object number and ROSAT designation as in Tables 2 and 3, pre-main sequence type, spectral type, H and lithium equivalent widths (negative when in emission) from high-resolution spectra (unless given with colons), rotational velocity, helio-centric radial velocity, X-ray luminosity (in 130 pc distance, calculated from counts, exposure and ECF listed in Table 2, 65 pc for TTS no. 82), and some remarks.
| No. | Object | PMS | Spec | (H) | (Li) | RadVel | Remarks | ||
|---|---|---|---|---|---|---|---|---|---|
| Tab.2 | designation | type | type | [Å] | [Å] | ||||
| 8 | RXJ1836.6-3451 | wTTS | M0 | 0.54 | 34.1 | 30.27 | |||
| 13 | RXJ1839.0-3726 | wTTS | K1 | 0.34 | 17.8 | 30.24 | (1) | ||
| 19 | RXJ1840.8-3547 | wTTS | M4 | 0.36: | 29.82 | ||||
| 23 | RXJ1841.8-3525 | wTTS | G7 | 0.25 | 30.0 | 30.62 | (2) | ||
| 27 | RXJ1842.9-3532 | cTTS | K2 | 0.38 | 23.7 | 30.34 | (3) | ||
| 30 | RXJ1844.3-3541 | wTTS | K5 | 0.41 | 38.8 | 30.60 | |||
| 31 | RXJ1844.5-3723 | wTTS | M0 | 0.52: | 30.59 | ||||
| 36 | RXJ1845.5-3750 | wTTS | G8 | 0.24 | 54.6 | 30.81 | HD 173148 (1) | ||
| 39 | RXJ1846.7-3636 NE | wTTS | K6 | 0.47 | 30.8 | 30.38 | 8” pair (4) | ||
| 39 | RXJ1846.7-3636 SW | wTTS | K7 | 0.43 | 17.5 | 30.38 | 8” pair (4) | ||
| 53 | RXJ1852.3-3700 | cTTS | K3 | 0.51 | 21.8 | 30.41 | IRAS 18489-3703 (5) | ||
| 55 | RXJ1853.1-3609 | wTTS | K2 | 0.39: | 30.60 | HD 174656 | |||
| 64 | RXJ1856.6-3545 | wTTS | M2 | 0.25: | 29.78 | ||||
| 68 | RXJ1857.5-3732 E | wTTS | M5 | 0.23 | 28.7 | 29.93 | close binary (4) | ||
| 68 | RXJ1857.5-3732 W | wTTS | M6 | 0.42 | 11.9 | 29.93 | close binary (4) | ||
| 80 | RXJ1901.1-3648 | wTTS | K4 | 0.44: | 29.88 | VSS VIII-27 | |||
| 82 | RXJ1901.4-3422 | wTTS | F7 | 0.09 | 57.6 | 29.77 | HD 176383 (2) | ||
| 85 | RXJ1901.6-3644 | wTTS | M0 | 0.54: | 30.18 | VSS VIII-26 | |||
| 135 | RXJ1917.4-3756 | wTTS | K2 | 0.48: | 30.61 | SAO 211129 |
Notes: (1) Complex H profile. (2) Given the relatively early spectral type and relatively small lithium strength, this star could be either pre- or zero-age MS stars (see also Sect. 6.3). Its Hipparcos distance is 65 pc, given for 65 pc. (3) Also observed with low resolution in 1995 and twice in 1996, when varied from Å to Å from night to night. Double-peaked emission, also HeI and [OII] emission. (4) Visual pair; position given in Table 3 is for the primary, i.e. the slightly brighter star; not resolved spatially with ROSAT (the combined is given). (5) Observed once in 1995 with low resolution and about the same H as given above for high-resolution spectrum, and five times with low resolution in 1996 with from Å to Å.
5 Optical and infrared photometry
We list object number as in Tables 2 to 4. Values in brackets are errors for the last digit(s). When no error is given, data are taken from Simbad, GSC, or USNO, which are more uncertain (indicated by colons). For TTS no. 64, the JHK data are from the 2nd 2MASS data release. Bolometric luminosity are estimated for a distance of 130 pc (65 pc for TTS no. 82). Ages and masses are estimated by comparison with isochrones and tracks from D’Antona & Mazzitelli (1994). The last object, RXJ1855.1-3754, is the TTS found in Neuhäuser et al. (1997), a ROSAT HRI source, not a RASS source, see Table 1.
| No. | B | V | V–R | R–I | K | J–K | H–K | age | mass | ||
|---|---|---|---|---|---|---|---|---|---|---|---|
| Tab. 2 | mag | mag | mag | mag | mag | mag | mag | mag | |||
| 8 | 14.3: | 13.22 (3) | 0.98 (1) | 1.08 (1) | 9.02 (5) | 0.86 (6) | 0.20 (6) | 0.7 | 3.2 | 0.6 | |
| 13 | 12.0: | 10.81 (1) | 0.50 (2) | 0.50 (1) | 8.51 (2) | 0.62 (3) | 0.14 (3) | 0.2 | 0.04 | 10 | 1.3 |
| 19 | 18.8: | 14.99 (3) | 1.24 (3) | 1.34 (2) | 10.14 (4) | 0.91 (16) | 0.25 (7) | 0.0 | 1.6 | 0.3 | |
| 23 | 9.7: | 8.04 (4) | 0.41 (15) | 0.07 (7) | 0.0 | 0.30 | 10 | 1.4 | |||
| 27 | 12.3: | 12.28 (3) | 0.70 (1) | 0.71 (1) | 8.23 (3) | 1.35 (5) | 0.51 (5) | 1.5 | 10.0 | 1.2 | |
| 30 | 11.3: | 8.38 (3) | 0.71 (5) | 0.18 (5) | 0.1 | 0.07 | 1.0 | 0.9 | |||
| 31 | 14.3: | 13.1: | 9.38 (3) | 0.85 (6) | 0.22 (5) | 0.1 | 6.3 | 0.6 | |||
| 36 | 10.0: | 9.2: | 7.18 (3) | 0.44 (5) | 0.10 (5) | 0.3 | 0.73 | 4.0 | 1.5 | ||
| 39-NE | 11.16 (3) | 0.73 (2) | 0.66 (1) | 7.89 (3) | 0.72 (5) | 0.11 (5) | 0.4 | 0.25 | 0.5 | 0.7 | |
| 39-SW | 11.43 (2) | 0.24 (1) | 0.66 (1) | 7.89 (3) | 0.72 (5) | 0.11 (5) | 0.5 | 0.20 | 0.5 | 0.6 | |
| 53 | 12.7: | 12.35 (3) | 0.73 (1) | 0.72 (1) | 9.01 (3) | 0.78 (5) | 0.21 (5) | 1.0 | 10 | 1.1 | |
| 55 | 11.0: | 9.6: | 7.31 (3) | 0.61 (5) | 0.12 (5) | 0.1 | 0.46 | 2.0 | 1.7 | ||
| 64 | 14.9: | 12.9: | 9.91 (3) | 0.91 (5) | 0.30 (7) | 0.0 | 0.8 | 0.4 | |||
| 68-E | 15.56 (3) | 1.2 (1) | 1.5 (1) | 10.53 (2) | 0.96 (4) | 0.20 (3) | 0.0 | 2.5 | 0.2 | ||
| 68-W | 16.5 (3) | 1.2 (3) | 1.7 (2) | 11.28 (3) | 0.95 (5) | 0.31 (4) | 0.0 | 2.5 | 0.1 | ||
| 80 | 15.85 (4) | 1.29 (3) | 1.52 (2) | 3.0 | 40 | 0.7 | |||||
| 82 | 8.7: | 8.2: | 7.07 (3) | 0.23 (5) | 0.05 (5) | 0.0 | 0.30 | 30 | 1.2 | ||
| 85 | 15.5: | 14.27 (3) | 1.17 (2) | 1.23 (2) | 1.1 | 7.9 | 0.6 | ||||
| 135 | 10.8: | 9.9: | 7.54 (3) | 0.69 (5) | 0.14 (5) | 0.1 | 0.36 | 3.2 | 1.6 | ||
| RXJ1855.1-3754 | 13.05 (5) | 0.62 (3) | 0.57 (3) | 0.3 | 40 | 0.7 | |||||
Broad band photometric observations in the VRI filters were carried out in 1997 from June 22 to 30 using the 0.9m telescope of Cerro Tololo Interamerican Observatory (CTIO). The detector was a CCD Tektronix 2048 (CTIO # 3) with pixel size 24 m and a readout noise of 3 to 5 electrons. The whole CCD was read out. Dome flat-field exposure sequences in each filter were taken typically before the beginning and upon the end of every night for flat field correction. Two or three different standard star fields from Landolt (1992) were also observed every night at different airmasses for the determination of atmospheric extinction, zero points and color transformation to the Johnson-Kron-Cousins standard system.
Raw CCD frames were bias subtracted and flat fielded using the IRAF package CCDRED. Sky flats were used, and the flat field variation across the final images was spot-checked and found to be negligible. The photometric solution for each night was determined using the IRAF tasks APPHOT and PHOTCAL. First, an aperture for each night was chosen by inspecting the reduced images from each night. The average FWHM over the run was about 1.3′′. To insure that all the light from a given star was in the aperture, a typical aperture for source extraction was taken as four times the FWHM or about 6′′. Annuli for background subtraction varied but were usually about 2′′ from inner diameter to outer diameter with an inner diameter of about 8′′. The background was taken as the median value within the annuli. An average of 30 calibration standards were observed each night at various airmasses. Photometric solutions for each night were determined by fitting the data to a color dependent airmass equation. The photometric errors dominate the Poisson errors in most cases.
Once the photometric solution for each night was determined, the target fields were examined. Aperture photometry was performed on all stars using the same aperture as was used for the standard stars on that night. The only exception to this was RXJ1857.5-3732. In this case, the two stars were separated by less than 4′′. Therefore we used the IRAF tool SUBSTAR to subtract one star from the image so we could accurately measure the instrumental magnitude of the other. The observed magnitude and colors were obtained by applying the instrumental magnitudes derived from the aperture to the photometric equation for the given night. Results are listed in Table 5.
The near-IR data were obtained using the CTIO Infra-Red Imager, CIRIM666see Elston 1999 at http://www.ctio.noao.edu/ instruments/ir-instruments/cirim/cirim.html, on the 1.5m telescope at CTIO. CIRIM is a 256 256 HgCdTe array. We observed at the f/13.5 focus, giving a plate scale of 0.65 arcsec per pixel. The data were obtained on the nights of 1998 July 8 to 14. All nights were photometric. The stellar point-spread function is well-sampled photometrically. Dome flats were taken at the start of each night. Flats were obtained with the dome illumination lamps both on and off, to determine the thermal contribution to the flat image. Standard stars, taken from the lists of Elias (1982) and the UKIRT faint standards (Casali & Hawarden 1992), were observed hourly, at a full range of airmasses. Exposure times varied between 0.4 and 3 seconds, based on source magnitude, with 3 images coadded at each position. We observed the standard stars using a 2 2 raster, with 30 arcsec spatial offsets between positions. We observed the targets using exposure times between 0.4 and 20 seconds, based on expected source brightness, with 3 images coadded at each position. We observed using a 2 3 raster, with spatial offsets of 15 arcsec between frames.
We linearized the data using the IRAF routine IRLINCOR. All other processing was undertaken using our IDL-based CIRIM reduction package777http://sbast3.ess.sunysb.edu/fwalter/CIRIM/cirim.html. The images are divided by the appropriate normalized flat field image. The images in the raster pattern are median-filtered to determine the local sky image, which is then subtracted from each flattened image. The images in the raster pattern are then aligned by cross-correlating on the brightest sources in the image, and co-added. The image center and plate scale are determined by cross-correlating the images with stars in the USNO catalog (Monet et al. 1998). The photometric solution is determined by fitting the log of the standard star counts within a 12-pixel (7.8 arcsec) radius region as a linear function of the air mass. The solution is edited interactively to remove discrepant stars and/or points. The RMS scatter in the photometric solutions is to , and we take this to be our photometric precision. Magnitudes are determined by applying the photometric solution to the net counts observed in a 12-pixel (7.8 arcsec) radius region. In the case of close binaries, we determined the total flux using a large extraction radius, and the relative magnitudes using smaller extraction radii. Typical uncertainties are mag, but this degrades for the fainter targets. Results are listed in Table 5.
6 H-R diagram, ages, and masses
Because we have a homogeneous and almost complete set of precise VJHK photometric data, we estimate the absorption in the line-of-sight to the stars from the observed , , and colors and their intrinsic color indexes, which we know from their spectral types. For those few stars, for which JHK is not available, we estimate the absorption from VRI colors. Visual extinctions for all new TTS are listed in Table 5. Then, we can also estimate the bolometric luminosity at an assumed distance of 130 pc, also listed in Table 5.
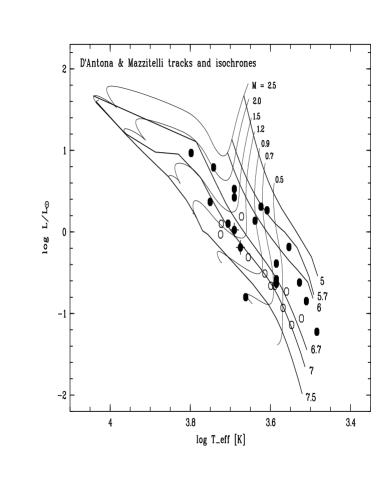
We display the location of the new TTS in the H-R diagram in Fig. 7 together with tracks and isochrones from D’Antona & Mazzitelli (1994). They yield rough estimates for ages and masses of our new TTS, which we also list in Table 5. It can been seen in Fig. 7 that the two visual pairs of TTS, RXJ1846 and RXJ1857, are both roughly co-eval. The ages of the new TTS range from less than one million years to a few tens of million years, not surprising given the wide spatial distribution. From that wide distribution on the sky around the CrA dark cloud, we have to conclude that the distances can show a similar spread, so that the ages and masses are uncertain. For the newly found young star RXJ1901.4-3422, whose parallax was measured by the Hipparcos satellite, we estimated its luminosity using the Hipparcos distance of 65 pc; it then falls on the 30 Myrs isochrone, just above the ZAMS; because its spectral type is late F, it is difficult to classify it as either pre- or zero-age MS given its lithium. One more newly found Li-rich star, RXJ1901.1-3648, is also found near the ZAMS, using 130 pc as distance, which may of course be a wrong distance. The latter one has spectral type K4 and clearly more lithium than Pleiades K4-type stars; it is located right on the cloud and its extinction is large ( mag, Table 5), hence it may be deep inside the dark cloud.
Our new Li-rich ROSAT counterparts show a larger age spread than the Li-rich EO counterparts (Walter et al. 1997). This is probably due to the larger spread in distances among the ROSAT stars compared to the EO stars, because we investigated a larger area on the sky using the RASS as compared Walter et al. (1997) who used EO pointed observations centered on the CrA dark cloud.
The two new cTTS, RXJ1842.9-3532 and RXJ1852.3-3700, both appear to be Myrs old, which is relatively old for cTTS. This result only holds if they are indeed at pc as assumed for calculating their , which may be unrealistic, because they are located on the line-of-sight to two small cloud-lets, both off the main CrA dark cloud. On the other hand, there are also some other cTTS with ages around 10 Myrs, namely TW Hya and HD 98800, for which the Hipparcos parallaxes are known, so that they could be placed correctly into the H-R diagram. Both two new CrA cTTS show only small IR excess emission at JHK, and one of them, RXJ1852.3-3700, is an IRAS source.
The two TTS with the latest spectral types in our sample are RXJ1857.5-3732 E and W with M5 and M6, respectively. They are both certainly young because of the strong lithium absorption. Hence, they are most certainly members of the CrA dark cloud, i.e. at 130 pc. Then, in the H-R diagram, they lie near the borderline between stars and brown dwarfs with masses around to . At first glance, it appears surprising to find such low-mass objects among RASS sources. Previously, several borderline objects and even brown dwarfs were detected as X-ray sources, but only in very deep pointed observations (Neuhäuser & Comerón 1998, Neuhäuser et al. 1999, Neuhäuser & Comerón 2000). However, our two RASS detected mid- to late-M dwarfs form a close pair, i.e. only one unresolved RASS X-ray source. Given their optical/IR luminosities, spectral types, and typical ratios, they would not have been detected individually in the RASS.
7 Kinematics
Because CrA is not part of the Gould Belt, the young stars surrounding the CrA dark cloud most certainly are associated with the CrA association. They could have formed near the present locations, where the gas has dispersed since then. In that case, these young stars should be somewhat older than the on-cloud TTS. Alternatively, if the CrA cloud has not shrunk, the off-cloud young stars could have dispersed out of the cloud, either slowly (then, the outermost stars would again be older than the on-cloud stars) or, at least in some cases, have higher velocities. In the latter case, one would expect at least a few young run-away TTS ejected from the dark cloud. For checking these possibilities, we need to investigate proper motions and radial velocities.
7.1 Proper motions
In order to examine the kinematical state of the stars in the R CrA association, we searched for proper motions for all the stars in Tables 1 and 3 in the Hipparcos (ESA 1997), PPM (Röser & Bastian 1991, Bastian et al. 1993, Röser et al. 1994), ACT (Urban et al. 1997), TRC (Høg et al. 1998), Tycho2 (Høg et al. 2000), and STARNET (Röser 1996) proper motion catalogs. Altogether we could identify 24 stars in these catalogs, including nine stars known already before the ROSAT mission, nine TTS newly identified here, as well as four ZAMS and two dKe/dMe stars. Note that R CrA itself is not listed; it is included in the Hipparcos catalog (HIP 93449), but no meaningful solution for its astrometric parameters could be derived. Proper motions are given in Table 6. For stars present in more than one catalog we usually adopted the most precise proper motion determination, unless it was in conflict with values from other catalogs. All proper motions were transformed to the Hipparcos astrometric system (ICRS) before comparison.
Listed are objects from Tables 1 to 4, which are included in at least one of the proper motion catalogues Hipparcos (HIP), PPM, ACT, TRC (T), STARNET (S) or Tycho2 (T2). All proper motions refer to the Hipparcos astrometric system.
| object | cat. no. | [masyr-1] | [masyr-1] | ||
| Known and suspected CrA member stars before ROSAT: | |||||
| 185720-3643 | T2 7421 1242 | 5.3 | 2.6 | –29.1 | 2.7 |
| 185801-3655 | S 7421 1040 | 13 | 6.1 | –27 | 6.1 |
| HR 7169a | T 7421 2294 | 10.1 | 2.6 | –28.8 | 2.6 |
| HR 7170a | T 7421 2295 | 7.0 | 2.6 | –15.5 | 2.6 |
| S CrA | S 7421 213 | 10 | 4.6 | –26 | 4.6 |
| CoD–3713022 | T2 7421 1890 | 6.6 | 2.5 | –27.6 | 2.6 |
| HD 176386 | HIP 93425 | 1.6 | 1.8 | –26.7 | 0.9 |
| V702 CrA | T2 7421 493 | 4.9 | 1.8 | –26.1 | 1.8 |
| SAO 210888 | HIP 93689 | 4.5 | 1.6 | –28.6 | 0.8 |
| T Tauri stars newly discovered with ROSAT (RXJ…): | |||||
| 1839.0-3726 | T2 7419 76 | 0.6 | 2.6 | –29.1 | 2.6 |
| 1841.8-3525 | T2 7415 284 | 7.0 | 1.9 | –25.1 | 1.9 |
| 1842.9-3532 | S 7415 696 | 3 | 4.8 | –27 | 4.8 |
| 1844.3-3541 | S 7419 22 | –8 | 4.8 | –32 | 4.8 |
| 1845.5-3750 | T2 7915 531 | 4.6 | 2.0 | –25.9 | 2.0 |
| 1852.3-3700 | S 7420 939 | 1 | 5.8 | –28 | 5.8 |
| 1853.1-3609 | T2 7420 774 | 2.9 | 1.8 | –24.6 | 1.7 |
| 1901.4-3422b | HIP 93412 | 9.9 | 1.5 | –46.8 | 1.0 |
| 1917.4-3756 | T2 7918 222 | 8.4 | 1.5 | –25.8 | 1.5 |
| Other stars (RXJ…): | |||||
| 1840.6-3728 | T2 7419 58 | –2.5 | 2.8 | –6.4 | 2.9 |
| 1911.5-3434 | T2 7418 2446 | 13.3 | 1.8 | –15.7 | 1.9 |
| 1915.7-3321 | S 7427 1333 | –3 | 5.1 | –5 | 5.1 |
| 1921.4-3459c | HIP 95149 | 78.9 | 4.1 | –108.9 | 2.5 |
| 1928.5-3508 | HIP 95753 | –16.3 | 2.1 | –14.4 | 1.4 |
| 1936.0-4002 | T2 7936 832 | –4.9 | 2.4 | 7.8 | 2.4 |
(a) The visible double star HR 7169/HR 7170 is represented by two entries in the Hipparcos
Catalogue (HIP 93368 and HIP 93371) with two individual component solutions.
The solution quality is classified as fair; however the proper motion errors
are much smaller in TRC, which we adopt here.
(b) Hipparcos distance is 655 pc, i.e. foreground to the cloud.
(c) RXJ 1921.4-3459 has an acceleration solution in the Hipparcos Catalogue.

Positions and proper motion diagrams for stars in Table 6 are shown in Fig. 8. The mean proper motion of the R CrA member stars seems to be very well defined. All except maybe one (HR 7170) of the member stars known before ROSAT (including the late B-type stars listed at the end of Table 1, whose membership was not clear before) show very similar proper motions, and all except two of the newly identified TTS nicely follow this trend. In contrast to this, the stars classified as ZAMS or dKe/dMe form a kinematically much more inhomogeneous distribution. The mean proper motion for all 15 likely members of the association is () = () mas yr-1. The largest part of this motion is simply the reflex of the solar motion, which is () () mas yr-1 at 19h 00m, -37 00′ and a distance of 130 pc, and () () mas yr-1 for 18h 45mand the same declination and distance values as above. Thus the slight difference between the mean proper motion in right ascension of the eight R CrA member stars known before ROSAT [ () = () mas yr-1 ] and the seven newly identified member TTS [ () = () mas yr-1 ] is partly a projection effect reflecting the fact that the new TTS are located at slightly lower right ascension.
7.2 Space velocities
We calculated space velocities for those stars with measured radial velocities (taken from Table 1 for six stars and from Table 4 for another six stars) and corrected them for the influence of galactic rotation (Fig. 9). The solar motion has also been subtracted, although this does not change the relative space velocities between stars, in contrast to galactic rotation or projection effects.

With the exception of HD 176386, which shows a discordant motion in the U-direction, all calculated space velocities are very similar. The mean (U,V,W) values are () km s-1 for the stars known before ROSAT (excluding HD 176386 for taking the mean of the U-velocities) and () km s-1 for the new TTS, i.e. no systematic differences seem to be present. There could still be a small difference in the W-velocities, but the number of stars is so small that this is maybe not significant.
The velocity dispersion is indeed very low, () = () km s-1 for the whole sample, which excludes the ejection mechanism (so-called run-away TTS) as major source for off-cloud TTS, because they should have discrepant velocities. The velocity dispersion is highest in the W-direction, and taking also into account that the positions of the stars form a broader distribution in the Z-direction ( pc, or pc if the far off lying RXJ1917.4-3756 is excluded) than in the Y-direction ( pc)888This can also be seen in Fig. 1, where the Z-direction is more or less perpendicular to the line, whereas the Y-direction is parallel to this line (the new TTS lying north of the central cloud is RXJ1901.4-3422, a young foreground star, see Sect. 7.3). this could be interpreted in terms of stars oscillating around the galactic plane. It simultaneously would explain why no PMS stars were found in the opposite direction of the R CrA cloud: the stars already reached the largest distance from the galactic plane and are currently near their turning point, consistent with their W-velocities being close to zero. One complete oszillation around the galactic plane would last yrs, but need not be finished by now for this scenario to be true. The off-cloud stars are currently located on average at pc, while the cloud is at pc. The stars which now appear to be off-cloud and the cloud itself, given their current locations and velocities and tracing their paths back in time, would have been at the same location yrs ago. The stars located outside of the current cloud borders are on average Myrs old, i.e. older than those inside the cloud, which supports the cloud oszillation scenario. However, the details and exact time-scales depend on the unknown total cloud mass. A very similar interpretation could also explain the positions and the motions of the stars found south of the Taurus clouds (Neuhäuser et al. 1997, Frink et al. 1997).
Lépine & Duvert (1994) suggested that high velocity cloud impacts could trigger star formation, and that subsequently to the impact clouds and stars could be separated from each other due to different friction during the passage through the galactic plane. If this is true, the new TTS found outside the dark cloud today could very well have been born inside the molecular cloud. The fact that the observed velocity dispersions are so low supports this scenario. A typical proper motion uncertainty of 3 mas yr-1 and an assumed distance uncertainty of 15 pc translate into a combined uncertainty of 3 km s-1 for the V and W components of the space velocity. The observed velocity dispersions are found to be even lower, so that this is consistent with a very small intrinsic dispersion of the velocities.
7.3 Stars with discordant proper motions
There are three stars among the sample of pre-ROSAT R CrA members and newly identified TTS with discordant proper motions from the mean.
HR 7170 belongs to a possibly quadruple system, and therefore the proper motion determination is highly problematic (see footnote to Table 6). Given the fact that the TRC proper motion of HR 7169 is consistent with kinematical membership to the R CrA association and that HR 7170 presumably belongs to the same system, it is likely that the different TRC proper motion of HR 7170 reflects orbital motions within the system. Although the kinematical membership of HR 7170 could not be proven directly, it still should be considered an R CrA association member. The stars HR 7169 and HR 7170 lie in a cavity in the CO distribution (Loren 1979). This suggests similar distances to the stars and cloud. Additionally, optical images show an extensive reflection nebulosity surrounding the pair.
The two other stars are the newly identified TTS RXJ1844.3-3541 and RXJ1901.4-3422. The case for RXJ1844.3-3541 is not clear. According to its spectral type and lithium line strength, it is clearly a young TTS, and also its radial velocity is consistent with membership. Either the proper motion from STARNET maybe in error or the star could have been ejected from the cloud. Comparing its proper motion with the association mean, it would move towards the south-west relative to the cloud, but it is located north-west of the cloud, so that it probably was not ejected from the R CrA cloud.
For RXJ1901.4-3422 the classification as TTS is doubtful. At a late-F spectral type, even Pleiades ZAMS stars have not yet burned significantly lithium, so that classification as either pre-MS or ZAMS stars is difficult. Because its lithium line is stronger than its nearby calcium line, we classify the star as TTS. The Hipparcos parallax of 655 pc clearly places it foreground to the R CrA cloud, which explains its large proper motion, and it is the only star located clearly north of the R CrA cloud. We conclude that RXJ1901.4-3422 is most likely not an association member, but young.
8 Completeness of our survey
In Fig. 10, we compare the complete log N–log S curve with those for stellar, extra-galactic, and unidentified sources. At a PSPC count rate threshold of 0.1 cts , of the RASS sources have optical counterparts, most of them being stars. At lower count rates the fraction of unidentified sources increases from at 0.07 cts to more than at 0.02 cts , a level at which all curves flatten because of the incompletness of the RASS itself. Above a PSPC count rate of 0.03 cts s-1 we have optically identified 75 among 136 RASS X-ray sources (i.e. ), most of them being stars. The small number of extra-galactic object identified at this threshold (only two) is simply due to our follow-up observation strategy. According to the results of Guillout (1996) and Zickgraf et al. (1997), we conclude that the extra-galactic population in the R CrA region is likely to account for about of the unidentified X-ray sources detected above 0.03 cts s-1, the rest (i.e. ) probably being optically faint active K- and M-type stars.

We now focus on the identified stellar population and define two sub-regions within our field, namely the on-cloud region (from = 18h 56m to 19h 24m and from to , i.e. 14 deg2) and the off-cloud region (complementary to the on-cloud region, i.e. 112 deg2).

We have plotted in Fig. 11 the observed on-cloud and off-cloud stellar log N–log S curves as well as the predictions of the stellar X-ray population model from Guillout et al. (1996). Computations were run for = 15∘ and = 180∘ although the galactic longitude is irrelevant at the RASS sensitivity. Results are summarized in Table 7.
| / | / | ||||
|---|---|---|---|---|---|
| 0.10 | 0.179 | 0.167 | 0.113 | 1.58 | 1.47 |
| 0.05 | 0.626 | 0.414 | 0.273 | 2.29 | 1.51 |
| 0.03 | 1.073 | 0.682 | 0.482 | 2.22 | 1.41 |
First we note that at any PSPC count rate the on-cloud stellar density is significantly higher (by a factor 2) compared to the model predictions, as expected for a region with ongoing star formation. On the other hand, we expect that the off-cloud log N–log S curve lies within of the model prediction, which is clearly not the case.
In order to check the relevance of the model prediction, we compare with the so-called RasTyc sample (Guillout et al. 1999), a sample of all objects included in both RASS and Tycho, i.e. the largest sample of stellar X-ray sources with homogeneous and accurate data constructed so far. In order to account for the magnitude and X-ray flux limited biases of of RasTyc, we ran a specific model optically limited at 10.5 mag (plus of stars down to 11.5 mag). We then compared the expected number of stars per deg2 with the observed one computed in two regions extending wide all around the sky and centered at = 15∘. At a PSPC count rate threshold of 0.03 cts, there are 1819 RasTyc stars detected within these two regions amounting to 6946 deg2, i.e. 0.26 stars per deg2. At this level, the model predicts a stellar surface density of 0.23 stars per deg2, in very good agreement with the observations. We are thus confident that the theoretical log N–log S curves plotted in Fig. 11 give a good estimation of the ambient galactic plane stellar population at the R CrA cloud galactic latitude.
We then conclude that in the region surrounding the CrA molecular cloud our observations reveal excess of stellar X-ray sources with respect of a ’pure’ galactic plane population (see Table 7). According to the expected contribution of extra-galactic sources to the unidentified population, is a lower limit on the excess. Such excesses were also detected around other star forming regions (see Neuhäuser 1997 and references therein). However, contrary to some other star forming regions like Lup-Sco-Cen (Guillout et al. 1998a,b), the Gould Belt can hardly be an explanation because of the position of the CrA molecular cloud projected well below the Gould Belt plane.
Also around the Chamaeleon clouds (Alcála et al. 1995) and south of the Taurus clouds (Neuhäuser et al. 1997), many new pre-MS stars were found, although there is no Gould Belt in that directions. As far as the Chamaeleon off-cloud TTS are concerned, Mizuno et al. (1998) found new, previously unknown, small cloud-lets near one third of the off-cloud TTS, which may be the birth places of those seemingly off-cloud TTS. If one can explain off-cloud TTS around the CrA and Cha clouds by cloud-lets rather than by the Gould Belt, at least some of the Lup-Sco-Cen, and Orion off-cloud TTS may also have originated in such small cloud-lets, as originally proposed for the Chamaeleon off-cloud TTS by Feigelson (1996).
The question now is whether we found all young, i.e. coronally active stars (inside and) around the CrA dark cloud. This can be investigated by optical follow-up observations of additional unidentified X-ray sources found in deep ROSAT PSPC and HRI pointed observations (Walter et al., in preparation).
Whether all young stars were found among all RASS sources can be investigated in the following way: Sterzik et al. (1995) have shown that it is possible to pre-select TTS candidates from the RASS using four criteria, namely the two hardness ratios, the X-ray count rate, and the optical magnitude of the nearest (if any) counterpart (within, say, 40”). Then, TTS candidates are those RASS sources which resemble best previously known RASS-detected bona-fide TTS according to the same properties. The parameter which describes how well a particular RASS source resembles the typical TTS properties is called discrimination probability P, described in detail in Sterzik et al. (1995).
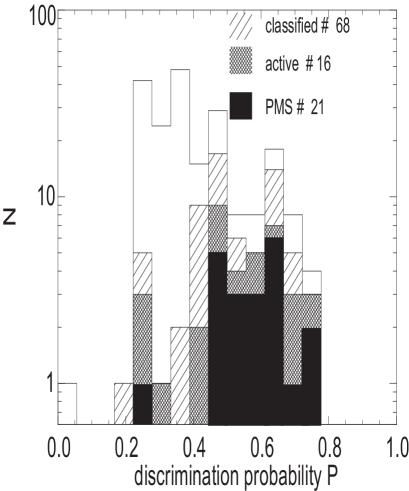
In Fig. 12, we plot the number of CrA RASS sources per discrimination probability P, namely for PMS stars, otherwise active stars, other objects, and unidentified RASS sources. If we would have pre-selected TTS candidates using the Sterzik et al. (1995) method, i.e. if we would have done optical follow-up observations only for RASS sources with a discrimination probability of, say, , we would have obtained a high success rate by loosing only one TTS.
Now, for a discrimination probability of, say, , the reliability (rel) of the TTS candidate selection is 0.45, based on the classified sub-sample. The reliability number gives the fraction of real TTS (real according to our spectroscopy) among those X-ray sources with discrimination probability above some threshold, e.g. . The fraction of lost unidentified TTS is 0.17, which is the number of real TTS to be expected (according to their discrimination probability values) among those X-ray sources not observed by optical spectroscopy. Because there is a total of sources with and 160 below this threshold, the expected number of TTS hidden in the RASS sample is
Hence, there should be a total of X-ray sources with TTS as true counterparts (with an X-ray flux above the RASS flux limit). The lower limit can be found when considering only those RASS sources which are unclassified, but do have an optical counterpart; there are such sources with and 46 with . Hence, there should be
RASS sources with TTS as true counterparts. Of those 29 to 48 sources, 21 are identified as such, namely as previously known or newly found TTS. The remaining eight to 27 still unknown TTS should be found among as yet unidentified RASS sources. According to Fig. 10, most of those missing TTS identifications are due to the magnitude limit in the catalogs used here (e.g. the GSC).
9 Summary
In this data paper, we presented ground-based optical and infrared follow-up observations of previously unidentified ROSAT All-Sky Survey X-ray sources in and around the R CrA star forming cloud. We identified two new cTTS and 17 new wTTS having stronger lithium absorption than ZAMS stars of the same spectral type. Radial velocities and proper motions of most of these new TTS are consistent with the previously known CrA TTS, but the new objects are distributed more widely in space. Compared to a galactic model, this sample of ROSAT TTS constitutes an excess of young stars, more than expected at this galactic latitude. We estimated that there should be in total 29 to 48 RASS detectable TTS in CrA, of which 8 to 27 hitherto unknown TTS are still hidden among as yet unobserved ROSAT Survey sources. Similar to the two new cTTS found to be located projected onto two small cloud-lets, the seemingly off-cloud wTTS found here may have formed in small cloud-lets, which have dispersed since they formed those stars. For this scenario as well as for the ejection model (run-away TTS), a larger than observed velocity dispersion would be expected. The space motions of the on-cloud and off-cloud TTS are consistent with a scenario in which cloud and stars oscillate around the galactic plane, with a very small intrinsic velocity dispersion. This could possibly be the result of a high-velocity cloud impact triggering star formation, as advocated by Lépine & Duvert (1994). However, alternative scenarios cannot be ruled out given the accuracy of the kinematical data available at present.
Acknowledgements.
We would like to thank the staff at ESO La Silla and CTIO for their help as well as George Leussis for his significant contribution in the reduction of the photometric data. We are gratefull to our referee, Dr. Bruce Wilking, for many helpful comments, which improved the content of this paper. This research has made use of the Simbad database, operated at CDS, Strasbourg, France. This publication makes use of data products from the Two Micron All Sky Survey, which is a joint project of the University of Massachusetts and the Infrared Processing and Analysis Center/California Institute of Technology, funded by the National Aeronautics and Space Administration and the National Science Foundation. The ROSAT project is supported by the German Government (BMBF/DLR) and the Max-Planck-Society. RN wishes to acknowledge financial support from the Bundesministerium für Bildung und Forschung through the Deutsche Zentrum für Luft- und Raumfahrt e.V. (DLR) under grant number 50 OR 0003.References
- (1)
- (2) Adams F., Lada C., Shu F., 1987, ApJ 312, 788
- (3)
- (4) Alcalá J.M., Krautter J., Schmitt J.H.M.M., et al., 1995, A&AS 114, 109
- (5)
- (6) Alcalá J.M., Covino E., Torres G., Sterzik M.F., Pfeiffer M.J., Neuhäuser R., 2000, A&A 353, 186
- (7)
- (8) André P. and T. Montmerle T., ApJ 420, 837
- (9)
- (10) Barrado y Navascues D., 1998, A&A 339, 831
- (11)
- (12) Bastian U., Röser S., Yagudin L.I., et al., 1993, PPM Star Catalogue, Vol. III & IV, Spektrum Akademischer Verlag, Heidelberg
- (13)
- (14) Bessell M.S., 1979, PASP 543, 589
- (15)
- (16) Bessell M.S., 1991, AJ 101, 662
- (17)
- (18) Briceño C., Hartmann L., Stauffer J.R., Gagné M., Stern S., 1997, AJ 113, 740
- (19)
- (20) Cambrésy L., 1999, A&A 345, 965
- (21)
- (22) Casali M.M. and Hawarden T.G., 1992, JCMT-UKIRT Newsletter, No. 4, 33
- (23)
- (24) Casey B.W., Mathieu R.D., Vaz L.P.R., Anderson J., Suntzeff N.B., 1998, AJ 115, 1617
- (25)
- (26) Chen H., Grenfell T.G., Myers P.C., Hughes J.D., 1997, ApJ 478, 295
- (27)
- (28) Covino E., Alcalá J.M., Allain S., Bouvier J., Terranegra L., Krautter J., 1997, A&A 328, 187
- (29)
- (30) D’Antona F. and Mazzitelli I., 1994, ApJS 90, 467
- (31)
- (32) Dame T.M., Ungerechts H., Cohen R.S., 1987, ApJ 322, 706
- (33)
- (34) ESA, 1997, The Hipparcos and Tycho Catalogues, ESA SP-1200
- (35)
- (36) Elias J.H., Frogel J.A., Matthews K., Neugebauer G., 1982, AJ 87, 1029
- (37)
- (38) Feigelson E.D., 1996, ApJ 468, 306
- (39)
- (40) Feitzinger J.V. and Stüwe J.A., 1984, A&AS 58, 365
- (41)
- (42) Frink S., Röser S., Neuhäuser R., Sterzik M.F., 1997, A&A 325, 613
- (43)
- (44) Gaposchkin A. and Greenstein J.L., 1936, Harvard Obs. Bull. No. 904, 8
- (45)
- (46) García López R.J., Rebolo R., Martín E.L., 1994, A&A 282, 518
- (47)
- (48) Glass I.S. and Penston M.V., 1975, MNRAS 172, 227 (GP75)
- (49)
- (50) Guillout P., 1996, PhD, Observatoire Astronomique de Strasbourg, Université Louis Pasteur, France
- (51)
- (52) Guillout P., Sterzik M.F., Schmitt J.H.M.M., Motch C., Egret D., Voges W., Neuhäuser R., 1998a, A&A 334, 540
- (53)
- (54) Guillout P., Sterzik M.F., Schmitt J.H.M.M., Motch C., Neuhäuser R., 1998b, A&A 337, 113
- (55)
- (56) Guillout P., Schmitt J.H.M.M., Egret D., Voges W., Motch C., Sterzik M.F., 1999, A&A 351, 1003
- (57)
- (58) Harju J., Haikala L.K., Mattila K., Mauersberger R., Booth R.S., Nordh H.L., 1993, A&A 278, 569
- (59)
- (60) Herbig G.H., 1978, ‘The post T Tauri stars’. In: Mirzoyan L. (Hrsg.) Problems of Physics and Evolution of the Universe. Academy of Science of Armenia, Erevan, p. 171
- (61)
- (62) Herbig G.H. and Bell K.R., 1988, Third Catalog of Emission-Line Stars of the Orion Population. Lick Obs. Bull. No. 1111 (HBC)
- (63)
- (64) Høg E., Kuzmin A., Bastian U., et al., 1998, A&A 335, L65
- (65)
- (66) Høg E., Fabricius C., Makarov V.V., et al., 2000, A&A 355, L27
- (67)
- (68) Hoffleit D., 1982, The Bright Star Catalog. 4th ed., Yale University Observatory, New Haven
- (69)
- (70) Knacke R.F., Strom K.M., Strom S.E., Young E., Kunkel W., 1973, ApJ 179, 847
- (71)
- (72) Koyama K., Hamaguchi K., Ueno S., Kobayashi N., Feigelson E.D., 1996, PASJ 48, L87
- (73)
- (74) Landolt A.U., 1992, AJ 104, 340
- (75)
- (76) Lépine J.R.D. and Duvert G., 1994, A&A 286, 60
- (77)
- (78) Loren R.B., 1979, ApJ 227, 832
- (79)
- (80) Marraco H.G. and Rydgren A.E., 1981, AJ 86, 62 (MR81)
- (81)
- (82) Miller G.E. and Scalo J.M., 1979, ApJS 41, 513
- (83)
- (84) Mizuno A., Hayakawa T., Yamaguchi N., et al., 1998, ApJ 507, L83
- (85)
- (86) Monet D., Bird A., Canzian B., et al., 1998, USNO-A2.0, A Catalog of Astrometric Standards, U.S. Naval Observatory Flagstaff
- (87)
- (88) Montmerle T., Koch-Miramond L., Falgaronne E., Grindlay J., 1983, ApJ 269, 182
- (89)
- (90) Motch C., Guillout P., Haberl F., et al., 1998, A&AS 132, 341
- (91)
- (92) Neuhäuser R., 1997, Science 276, 1363
- (93)
- (94) Neuhäuser R. and Preibisch Th., 1997, A&A 322, L37
- (95)
- (96) Neuhäuser R. and Brandner W., 1998, A&A 330, L29
- (97)
- (98) Neuhäuser R. and Comerón F., 1998, Science 282, 83
- (99)
- (100) Neuhäuser R. and Comerón F., 2000, Coronal activity of brown dwarfs. In: Rebolo R. (ed.), 11th Cambridge Workshop on Cool Stars, Stellar Systems, and the Sun, in press
- (101)
- (102) Neuhäuser R., Sterzik M.F., Schmitt J.H.M.M., Wichmann R., Krautter J., 1995, A&A 297, 391
- (103)
- (104) Neuhäuser R., Thomas H.-C., Danner R., Peschke S., Walter F.M., 1997, A&A 318, L43
- (105)
- (106) Neuhäuser R., Torres G., Sterzik M.F., Randich S., 1997, A&A 325, 647
- (107)
- (108) Neuhäuser R., Briceño C., Comerón F., et al., 1999, A&A 343, 883
- (109)
- (110) Olano C.A., 1982, A&A 112, 195
- (111)
- (112) Patten B., 1998, The low-mass membership of the R CrA T association. In: Donahue R.A. & Bookbinder J.A. (eds.) 10th Cambridge Workshop on Cool Stars, Stellar Systems, and the Sun, CD-1755
- (113)
- (114) Pavlenko Ya P. & Magazzù A., 1996, A&A 311, 961
- (115)
- (116) Pöppel W., 1997, Fundamentals of Cosmic Physics 18, 1
- (117)
- (118) Röser S., 1996, IAU Symp. 172, 481
- (119)
- (120) Röser S. and Bastian U., 1991, PPM Star Catalogue, Vol. I & II, Spektrum Akademischer Verlag, Heidelberg
- (121)
- (122) Röser S., Bastian U., Kuzmin A., 1994, A&AS 105, 301
- (123)
- (124) Rossano G.S., 1978, AJ 83, 234
- (125)
- (126) Schmitt J.H.M.M., Fleming T.A., Giampapa M.S., 1995, ApJ 450, 392
- (127)
- (128) Soderblom D.R., Jones B.F., Balachandran S., et al., 1993, AJ 106, 1059
- (129)
- (130) Sterzik M.F. and Durisen R., 1995, A&A 304, L9
- (131)
- (132) Sterzik M.F., Alcalá J.M., Neuhäuser R., Schmitt J.H.M.M., 1995, A&A 297, 418
- (133)
- (134) Stocke J.T., Liebert J., Gioia I.M., et al., 1983, ApJ 273, 458
- (135)
- (136) Taylor K.N.R. and Storey J.W.V., 1984, MNRAS 209, 5P
- (137)
- (138) Torres G., 1985, A&AS 59, 449
- (139)
- (140) Urban S.E., Corbin Th.E., Wycoff G.L., 1997, The ACT Reference Catalog, U.S. Naval Observatory, Washington D.C.
- (141)
- (142) Walter F.M., 1986, ApJ 306, 573
- (143)
- (144) Walter F.M. & Matthews L.D., 1997, Nature 389, 358
- (145)
- (146) Walter F.M., Wolk S.J., Neuhäuser R., 1996, Nat. 379, 233
- (147)
- (148) Walter F.M., Brown A., Mathieu R.D., Myers P.C., Vrba F.J., 1988, AJ 96, 297
- (149)
- (150) Walter F.M., Vrba F.J., Wolk S.J., Mathieu R.D., Neuhäuser R., 1997, AJ 114, 1544
- (151)
- (152) Wichmann R., Covino E., Alcalá J.M., Krautter J., Allain S., Hauschildt P.H., 1999, MNRAS 307, 909
- (153)
- (154) Wilking B.A., Lada C.J., Young E.T., 1984, ApJ 340, 823
- (155)
- (156) Wilking B.A., Taylor K.N.R., Storey J.W.V., 1986, AJ 92, 103
- (157)
- (158) Wilking B.A., Greene T.P., Lada C.J., Meyer M.R., Young E.T., 1992, ApJ 397, 520
- (159)
- (160) Wilking B.A., McCaughrean M.J., Burton M.G., Giblin T., Rayner J.T., Zinnecker H., 1997, AJ 114, 2029
- (161)
- (162) Zickgraf F.-J., Thiering I., Krautter J., et al., 1997, A&AS 123, 103
- (163)
- (164) Zimmermann H.U., Becker W., Belloni T., et al., 1994, EXSAS Users’s Guide, MPE Report 257, ROSAT Scientific Data Center, Garching
- (165)