First results of UVES at VLT: revisiting RR Tel ††thanks: Based on public data released from the UVES commissioning at the VLT Kueyen telescope, European Southern Observatory, Paranal, Chile.
Abstract
We present here the first results of UVES observations of RR Tel. The exceptional performances of the instrument have allowed the detection of new spectral features and have led to an improvement in the identifications of several emission lines. A direct comparison with the IUE observations in the range 3045-3300 Å has revealed the appearance of many weak and shallow lines, most of them lacking a convincing identification. The Balmer lines are visible up to H38 and are accompanied by the He II lines of the Pickering series. Also, all of the He II emissions of the Pfund series, from 5858 Å to 6408 Å have been detected. We made definite identifications of additional TiO bands at 4955 Å (), 5167 Å (), 5445 Å (), 5598 Å (), 5847 Å (),and 6148 Å (). The H line has very wide wings, extending to at least 5000 km s-1, which are similar to those reported for the planetary nebula IC 4997 and attributed to Raman scattering by Ly photons. A selective pumping mechanism via the HeII 237 Å emission is proposed to explain the intensity of the high-lying lines of O IV mult. 1 and 2.
Key Words.:
08.14.2 novae, cataclysmic variables, 02.12.2 line: identification - 08.09.2 stars: individual: RR Tel1 Introduction
The symbiotic nova RR Tel is an extraordinary laboratory for spectroscopic studies of low-density astrophysical plasmas on account of the richness of its emission line spectrum that covers a wide range in ionization and excitation stages. Since the fundamental study by Thackeray (1977), new optical observations with higher spectral resolution and S/N ratio have have gradually improved the quality of the data and have allowed the identification of weaker and blended spectral features (see Mc Kenna et al 1997, and Crawford et al. 1999). Also, the presence of a strict correlation between the FWHM and the ionization level of the emission lines, as pointed out by Thackeray (1977) and confirmed by Penston et al. (1983), has provided a simple but powerful tool for the identification of spectral lines that has not yet been fully exploited. With this in mind, we have taken advantage of very recent high resolution VLT–UVES observations of RR Tel to revisit the spectral features of the nova and to perform an ab initio identification of its emission features. We present here some highlights of these recent observations, deferring to a next paper a detailed description of the spectral identifications and measurements.
2 Observations and data reduction
Details on the UVES spectrograph and its performances may be found in D’Odorico et al (2000) as well as in the UVES User Manual (D’Odorico & Kaper, 2000). The data we used consists of a spectrum obtained on October 16th 1999 with the dichroic # 1 and the standard setting centered at 3460 Å in the blue arm and 5800 Å in the red arm, the exposure time was of 1200 s for both arms. The detector in the blue arm is an EEV CCD, while in the red it is a mosaic of one EEV (identical to that used in the blue arm) and one MIT CCD. All CCDs are composed of square pixels of 15 side. The slit width was 06 in the blue and 08 in the red. The data was reduced using the ECHELLE context of MIDAS and each CCD was treated independently; reduction included background subtraction, cosmic ray filtering, flat fielding, extraction, wavelength calibration and order merging. Since no arc spectra for wavelength calibration with this setting are available for the date of observation, we used calibration spectra acquired on different days. From our previous experience with UVES (Bonifacio et al 2000), we expect the wavelength scale to be reproducible to within a shift of a few tenths of a pixel; since we are not interested in accurate radial velocities such a shift is of no consequence for our analysis. The resolution, as measured from the Th lines of the calibration lamp is for the whole blue arm spectrum. For the red arm spectrum we could not find an arc taken with a slit of 08 and used one taken with a slit of 066 instead, whose measured resolution is , we therefore expect the resolution of the red spectra to be slightly lower, i.e. about , as predicted by the UVES manual (D’Odorico & Kaper 2000). To give an idea of the dynamic range offered by the instrument we mention that at the peak of the He II 3203.104 Å line the spectrum detects 7831 , while only 88 in the adjacent continuum. An estimate of the S/N ratio in this range, assuming Poisson noise, gives S/N 88 in the He II line and S/N 9 in the continuum. We also made use of a short exposure spectrum taken on October 10th, with the same setting and a slit of 08 in the blue arm and 03 in the red arm, the exposure times were 120 s and 60 s respectively. This spectrum was reduced in the same way as the long exposure and was used only to check the profiles of very strong lines.
The measured wavelength of the sharp, unblended Fe II lines is shifted by km s-1 with respect to the laboratory (air) wavelength. After correction for the earth motion () the heliocentric radial velocity derived from the Fe II lines is , consistent with the heliocentric radial velocity reported in previous works ( km s-1, Thackeray (1977)). Hereafter, we consider the system of the FeII lines as the rest frame of RR Tel and the observed wavelengths refer to a frame that is at rest with respect to the Fe II lines.
3 Results
| ident. | FWHM | FWHM | ||
|---|---|---|---|---|
| (Å) | (km s-1) | |||
| 3067.18 | OVI | 3066.75 | 0.88 | 86.10 |
| 3138.70 | [NiVII] | 3138.3 | 0.65 | 62.10 |
| 3159.14 | unid. | 0.77 | 73.10 | |
| 3221.14 | [NiVII] | 3221.5 | 0.53 | 49.40 |
| 3403.51 | OIV (2) | 3403.52 | 0.44 | 38.80 |
| 3409.65 | OIV (3) | 3409.66 | 0.44 | 38.80 |
| 3411.70 | OIV (2) | 3411.69 | 0.44 | 38.70 |
| 3413.61 | OIV (2) | 3413.64 | 0.64 | 56.20 |
| 3425.93 | NeV 1F | 3425.5 | 0.98 | 85.80 |
| 3428.66 | OIII | 3428.63 | 0.36 | 31.50 |
| 3433.69 | unid. | 3433.00 | 0.88 | 76.90 |
| 3487.12 | MgVI | 3486.7 | 0.87 | 74.80 |
| 3488.90 | MgVI | 3488.72 | 0.82 | 70.10 |
| 3502.21 | MgVI | 3501.97 | 1.05 | 90.00 |
| 3586.58 | FeVII | 3586.32 | 0.72 | 60.20 |
| + FeVI | 3587.66 | |||
| 3634.24 | HeI | 3634.23 | 0.33 | 27.20 |
| 3725.30 | CaVI 1F | 3725.4 | 0.76 | 61.20 |
| + OIV (6) | 3725.81 | |||
| 3759.22 | FeVII | 3758.92 | 0.84 | 67.10 |
| 4930.55 | OV (25) | 4930.27 | 0.89 | 54.10 |
| + OIII | 4930.87 | |||
| 5290.54 | OVI (16) | 5290.60 | 1.33 | 75.40 |
| + OIV (11) | 5290.1 | |||
| 5424.52 | FeVI 1F | 5424.22 | 1.05 | 58.10 |
| 5460.68 | [CaVI] | 5460.69 | 0.87 | 47.80 |
| 5495.05 | ArIV] ? | 5494.39 | 1.59 | 86.80 |
| + [CoVIII] | 5494.8 | |||
| + FeII 17F | 5495.82 | |||
| 5586.24 | CaVI | 5586.26 | 0.90 | 48.30 |
| + OIV | 5585.6 | |||
| 5618.60 | CaVII | 5618.75 | 1.33 | 71.00 |
| 5631.42 | CaVI | 5631.74 | 1.09 | 58.10 |
| + FeVI | 5631.07 | 0.00 | 0.00 | |
| 5677.22 | FeVI 1F | 5676.95 | 1.12 | 59.20 |
| + NII (3) | 5676.00 | |||
| 6086.96 | FeVII | 6087.00 | 1.49 | 73.40 |
| + CaV 1F | 6086.37 | |||
| 6228.43 | KVI | 6228.6 | 1.18 | 56.80 |
| 6500.31 | OV | 6500.24 | 0.98 | 45.20 |
3.1 The region of overlap with IUE , 3045-3345 Å
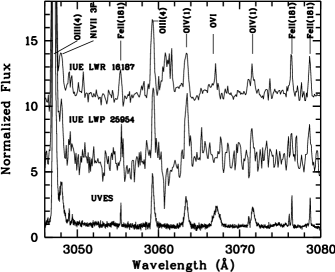
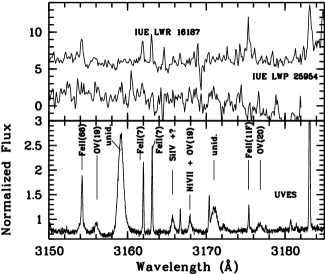
The UVES capability of reaching the region down to 3045 Å has permitted a direct comparison with the high resolution IUE observations. Since the IUE sensitivity declines strongly above 3000 Å , we have chosen for comparison the two IUE spectra with the longest exposure times, [ LWR16187 ( s, June 18,1983 ) and LWP25954 ( s, July 20,1993)]. Fig. 1 is a comparison between UVES and IUE data ( obtained from the INES archive system (see Cassatella et al.(2000) and Wamsteker et al.(2000)) in the range 3045–3080 Å which includes some identifications. We point out the presence in the UVES spectrum of the wide line (FWHM 86.1 km s-1) at 3066.77 Å, (identified as OVI 66.75 ) that was marginally present in LWR16187 and absent in LWP25954, and the lack in the UVES spectrum of the wide feature near 3061 Å in LWR16187, which is probably due to noise. Fig. 2 is a similar plot for the range 3150–3180 Å but the UVES data are on a separate intensity scale to fully emphasize their remarkable S/N ratio. Several new and wide features are evident at 3154.19 Å (unidentified, blended with the sharp line of FeII (66) 3154.20 Å), 3155.99 Å (OV(19) 3156.11) , 3159.12 Å (a strong line with FWHM =73.1 km s-1 that has defied a convincing identification) 3165.71 Å ( SiIV 3165.7 + MnIV // 3165.57 + NiVII 3165.4), 3167.91 Å (OV (19) 3168.10 + NiVII 3168.0), 3170.97 Å (unid.), 3176.85 Å (OV (20) 3176.87). The two sharp lines which are present also in IUE are lines of FeII mult. 7. Figure 2 is also a representative illustration of the variety of emission profiles that are present in the spectrum of RR Tel: we point out the appearance (or maybe the new detection thanks to UVES) of many weak and shallow lines whose central intensity is of the order of 50% – 100% of the continuum. These wide and shallow features are quite common in the UV part of the spectrum up to Å. Some of these features have been identified as lines of high ionization species such as OIV-VI and NiIV-VII, but many of them lack proper identification. We recall that Penston et al (1983) listed 20 lines in all in the range 3047–3345 Å , including five lines of OIII produced in the Bowen mechanism. In the UVES spectrum we have detected in the same range about 90 emission lines including a dozen of OIII Bowen lines. All lines and identifications of Penston et al (1983) are confirmed with two exceptions : the 3063.30 NII (2F) feature is missing and TiII 3078.66 Å is instead FeII (181) 3078.69 (see also Fig. 1); no TiII line has been positively detected in our spectra. Among other new features in the IUE range we mention also the lines at 3131.21 Å ( NiVI 3131.4), 3138.66 Å ( NiVII 3138.3), on the wings of the strong OIII(12) 3132.86 Å line , and 3221.12 Å ( NiVII 3221.5 ). In the context of the application of new laboratory analysis of the spectrum of highly ionized nickel to the identification of unclassified lines in the spectra of Car and RR Tel, the NiVII 3221.5 Å line was mentioned by Raassen and Hansen (ApJ 243,217, 1981) as a forbidden line falling in a region difficult to observe.
3.2 The 3350–3870 Å region

An obvious comparison here is with the recent study by Crawford et al.(1999) on AAT–UCLES data of slightly lower resolution than the VLT-UVES data. We are aware that the identification of emission lines is a somewhat arbitrary procedure but, on the basis of the FWHM criterion and of common astrophysical sense, we disagree with Crawford et al. on the identifications of low ionization species such as TiI, VII, MnI, MnII etc. We have found alternative identifications generally associated with higher ionization species. We postpone a detailed discussion on line identifications to the follow-up paper and we just give here, in Table 1, a short list of strong lines either not reported or incorrectly identified by Crawford et al., together with our proposed identifications. Thanks to the very high spectral resolution of the UVES spectrograph we have been able to detect emission lines of the Balmer series down to H38 at 3656.13 Å (see Fig 3). Also, starting from approximately H18, where the separation between successive lines becomes large enough, it is clearly seen that ALL Balmer emissions are accompanied by a shortward displaced, much weaker emission that we associate with HeII lines of the Pickering (4-n) series. This is confirmed by the presence of the other HeII lines of the same series that fall in between the Balmer lines. Crawford et al discarded a possible contribution of [SIII] 3721.70 Å to the H14 Balmer line at 3721.94 Å, as in Mc Kenna et al (1997), on the basis of the FWHM of the feature, which agreed well with that of other H lines. As a matter of fact, the feature we observe at 3721.89 Å (see also Fig. 3) has the same FWHM (55 km s-1) as the other H lines, but clearly shows an intensity excess with respect to the adjacent H lines that requires an additional contribution at a wavelength necessarily very close to that of the H14 line. The presence of the two OII 1F lines at 3726.03 Å and 3728.81 Å is questionable: we recall that Contini and Formiggini (1999) from the presence of [OII]3727 Å inferred an electron density in the emitting gas not much higher than , a disturbingly low value that is in contrast with the densities derived by other diagnostic methods. The observed features (see Fig. 3) fall at 3725.27 Å and at 3729.17 Å with FWHM of 63 km s-1 and 42.6 km s-1 , not compatible with OII since the OIII lines have FWHM close to 30 km s-1. We identify the former line as [CaVI] 1F 3725.4 Å + OIV (6)3725.81 Å (already in Thackeray (1977)), while the latter line is OIV 3729.03 Å; its FWHM (42.6 km s-1) is in good agreement with the FWHM of other OIV lines ( 41 km s-1 ). Finally, the 3710 Å SIII line reported in Table 5 of Contini and Formiggini, is, more likely, HeII 3710.44 Å (4-30), the shortward companion to the H15 emission line.
3.3 The 4780 - 6820 A Region
Some strong emission lines either not listed or incorrectly identified by Crawford et al.(1999) are reported in Table 1. The same considerations given in the previous Section apply here to rule out identifications based on low ionization species such as Ca I, TiI, MnI, Mn II, VII, etc. We have identified ALL of the HeII emission of the Pfund (5-n) series, from 5858.88 Å (5-30) to 6408.15 Å (5-15). Some of the higher members of this series have been identified as lines of low ionization species in previous works.
If one looks only to the details of the individual emission lines there is the risk of missing the forest for the trees; instead, from a general view of the entire spectrum at a proper scale, two interesting features come out:
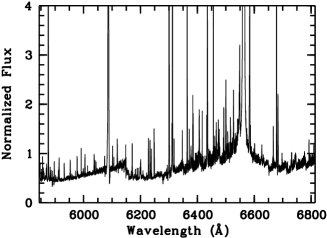
1. The H line has very wide wings that extend from about 6300 Å to about 6700 Å. (see Fig 4). While a crowding of emission lines can partially contribute to the violet wing, the red wing is relatively free of contamination and indicates a velocity on the order of at least 5000 km s-1 . Similar broad wings have been reported for the planetary nebula IC 4997 by Lee and Hyung (2000) who attributed them to Rayleigh-Raman scattering by which Ly photons with a velocity width of a few km s-1 are converted to optical photons and fill the H broad wing region. We recall that Schmid (1989) and Schmid and Schild (1990) interpreted two broad features at 6825 and 7082 Å in RR Tel and other symbiotic stars as the Raman scattered UV OVI 1032 Å and 1038 Å resonance lines. Van Groningen (1993) detected Raman scatttered HeII(2-8) and (2-10) at 4333 Å and 4851 Å; this latter line is also present in our spectrum as a wide and shallow feature.
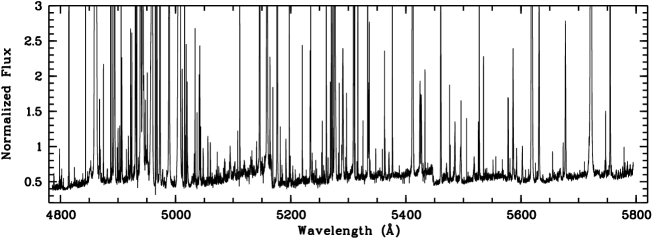
2. Webster (1974) reported some evidence of the presence of TiO absorption bands in the red spectrum of RR Tel. This might testify the contribution to the spectrum by the Mira variable. Mc Kenna et al (1997) found no sign of these TiO absorption bands, but Crawford et al (1999) made definite identifications of the TiO absorption bands near 6651 Å(),7052 Å(9, 7666 Å() and 8206 Å(). Figures 4 and 5 clearly show the presence of additional TiO bands at 4955 Å(), 5167 Å(), 5445 Å(), 5598 Å(), 5847 Å(),and 6148 Å(). For the band classification we used the list of bandheads provided in the Appendix of Valenti et al (1998). There is also evidence for weaker absorption bands (including that at 6651 Å) in the region longward of H.
3.4 A selective pumping of the optical OIV lines ?
The optical OIV lines come from levels with energies above 48.3 eV and therefore, in contrast with the UV lines near 1400 Å, collisional excitation is unlikely. The lines of OIV mult. 1, 2, 3, and 6 are present as a clearly evident features in the UVES spectrum of RR Tel, while the lines of mult. 4,5,7, 8, which have comparable excitation and intensities are nearly absent. Thus, a mechanism of selective excitation seems at work. The lines of mult. 2 near 3400 Å (which decays into the lines of mult. 1 near 3070 Å ) have the upper term ( at 52.02 eV.) in common with the two lines at 238.57 and 238.36 Å of mult. UV5. This wavelength is rather close to that of a HeII Lyman transition at 237.33 Å, (arising from a level at 52.24 eV) and we suggest that the HeII 237 Å line pumps the upper term of OIV mult. UV5 which in turn decays into mult. opt. 2 and opt. 1 and other lines. Apparently a similar mechanism should work for the upper level of mult. 6 at 61.40 eV (which in turn decays into mult. opt 3) but we have found no candidates for the pumping line.
Acknowledgements.
We are grateful to S. D’Odorico, H. Dekker and the whole UVES team for conceiving and building such a terrific instrument as UVES. We are indebted with M. Tarenghi for suggesting RR Tel as a target for the commissioning observations. We made large use of the excellent Atomic Line List v.2.04 maintained by Peter van Hoof at the WEB site http://www.pa.uky.edu/peter/atomic .References
- (1) Bonifacio P., Hill V., Molaro P., Pasquini P., Di Marcantonio P., Santin P., 2000, A&A 359,663
- (2) Cassatella A., Altamore A., Gonzalez-Riestra R., Schartel N., Wamsteker W.,2000, A&AS,141,331
- (3) Contini M. and Formiggini L.,1999 Ap.J 517,925
- (4) Crawford F.L., McKenna F,C., Keeenan F.P., Aller L.H., Feibelman W.A., Ryan S.G.,1999, A&AS,139,135
- (5) D’Odorico S., Kaper L. ”UV-Visual Echelle Spectrograph User Manual” 2000, Doc. No. VLT-MAN-ESO-13200-1825, http://www.eso.org/instruments/uves/userman/
- (6) D’Odorico S., Cristiani S., Dekker H., Hill V., Kaufer A., Kim T., Primas F.,2000, SPIE Proceedings 4005, in press
- (7) Lee H., Hyung S.,2000, ApJ530,L49
- (8) McKenna F.C., Keenan F.P., Hambly N.C., Allende Prieto C., Rolleston W.R.J., 1997,ApJS,109,225
- (9) Penston M.V., Benvenuti P., Cassatella A., Heck A., Selvelli P.L., Macchetto F., Ponz D., Jordan C., Cramer N., Rufener F., Manfroid J.,1983, MNRAS 202,833
- (10) Raassen A.J.J. and Hansen, J.E.,1981, ApJ243,217
- (11) Schmid H.M.,1989, A&A,211,L31
- (12) Schmid H.M., Schild,H.,1990, A&A,236,L13
- (13) Thackeray A.D.,1977, Mem.RAS,83,1
- (14) Van Groningen E.,1993, MNRAS,264,975
- (15) Valenti J.A., Piskunov N., Johns-Krull C.M., 1998, ApJ 498, 851
- (16) Wamsteker W., Skillen I., Ponz J.D., de la Fuente A., Barylak M.,and Yurrita I.,2000, Ap&SS,in press
- (17) Webster B.L.,1974, IAU Symp.59,123