First Detection of Submillimeter [C I] Emission in the Small Magellanic Cloud
Abstract
We report the first detection of [C I] (3PP0) emission at 609 m in a region of the Small Magellanic Cloud (N27). Environments poor in heavy elements and dust such as the SMC are thought to be dominated by photodissociation regions. This is the lowest metallicity source where submillimeter neutral carbon emission has been detected. Studying the I[CI]/ICO ratio in several sources spanning more than an order of magnitude in metallicity, , we find that the I[CI]/ICO ratio increases for decreasing . The existence of such a trend points to a photodissociation origin for most of neutral carbon in molecular clouds, in agreement with standard PDR models. We also report ISO FIR spectroscopic observations of N27, and use them to derive its physical properties. Comparison between the density and radiation field revealed by FIR diagnostics (—1000 cm-3, —) and those derived from millimeter and submillimeter data ( cm-3, ) suggests that the FIR lines originate in more diffuse gas, and are perhaps dominated by the interclump medium. Regardless of the cause, analysis of the FIR and mm-submm data produces a discrepancy of two orders of magnitude for the density of this source.
1 Introduction
Studies of the interstellar medium (ISM) in the Small Magellanic Cloud (SMC) allow us to investigate star forming clouds that are poor in heavy elements. The SMC is indeed an excellent choice to study this phenomenon, because it is nearby ( kpc; Laney & Stobie 1994), has an unobscured line of sight and very small internal obscuration, and possesses the lowest metallicity among the nearby members of the Local Group (; Dufour 1984). Because of their low metallicity, morphological irregularity, and active star formation, the Magellanic Clouds resemble primeval galaxies. Therefore, studies such as this will eventually allow us to draw conclusions about those much more elusive targets: the high-z primitive galaxies.
The depletion of heavy elements, and the consequent low dust-to-gas ratio (; Bouchet et al. 1985), affects the ISM by enhancing photodissociation. Because of its high abundance (i.e., strong self-shielding) and cross-shielding with atomic hydrogen lines, molecular hydrogen is mostly unaffected by . The usual tracer molecules such as CO, however, are efficiently destroyed in dust-poor systems. A much larger fraction of the ISM in these systems is thus expected to be occupied by photodissociation regions (PDRs; e.g., Tielens & Hollenbach 1985; Sternberg & Dalgarno 1995). Consequently, we expect the intensities of the spectral lines associated with the PDR (e.g., [C II], [C I]) to be enhanced when compared to molecular lines (e.g., 12CO ()), resulting in increasing I[CII]/ICO and I[CI]/ICO ratios (Bolatto, Jackson, & Ingalls 1999).
The immediate purpose of this work is twofold: 1) to test for the existence of an increasing I[CI]/ICO ratio with decreasing metallicity (§3.1), and 2) to investigate the power of far-infrared (FIR) spectroscopic diagnostics and compare their results to those obtained using millimeter and submillimeter lines (§3.2). An I[CI]/ICO dependence on could be useful for determining metallicities in high-z sources using only radio observations. The trend in I[CI]/ICO with is also a test for the origin of neutral carbon inside molecular clouds. An increasing I[CI]/ICO ratio for decreasing points to a PDR origin, while a flat ratio suggests that C0 is produced inside the CO cores by means other than UV photons.
Our SMC source, the N27 nebula, was first cataloged by Henize (1956). A later survey by Davies, Elliott and Meaburn (1976) calls it DEM40. Its associated IR peak is also known as LIRS49 (Schwering & Israel 1989). This region was mapped by the Swedish-ESO Submillimeter Telescope (SEST) in the () and () transitions of CO (Rubio et al. 1993), and studied in detail in several molecular transitions by Heikkilä et al. (1999). Albeit a weak emitter when compared to Galactic sources, the molecular cloud associated with N27 features some of the strongest CO () emission in the SMC (Israel et al. 1993).
2 Observations
2.1 Far Infrared Data
We observed N27 using the Long Wavelength Spectrometer (LWS) onboard the Infrared Space Observatory satellite (ISO), at . These LWS data are a 4160 second-long full-grating scan obtained on 20 December 1997 as part of the LOMETPDR project. The instrumental characteristics are described by Clegg et al. (1996), and the calibration of the ISO LWS instrument is described by Swinyard et al. (1996). The data pipeline was version 8.7 and the observations were processed using ISAP version 2.0. We averaged the spectra across scans and scan direction, but not across detectors, with the default wavelength spacing of 0.135 m. The averaging was done after 2.5 clipping of outlying points. For the purposes of obtaining an IFIR estimate only, we joined the detectors together by offsetting them with the dark correction method in ISAP, using detector LW1 as the reference. Table 1 summarizes the spectroscopic results.
We can assess the calibration of the LWS data by comparing it with previous [C II] measurements of N27 featuring a similar beam size (Israel & Maloney 1993). The intensity measured by FIFI at the LWS pointing is I[CII] erg s-1 cm-2 sr-1. The LWS measured intensity after applying the recommended correction factors for beam size and extended source is I[CII] erg s-1 cm-2 sr-1, in remarkable agreement with the FIFI observations. The measurements listed in Table 1 include both corrections.
2.2 Submillimeter Data
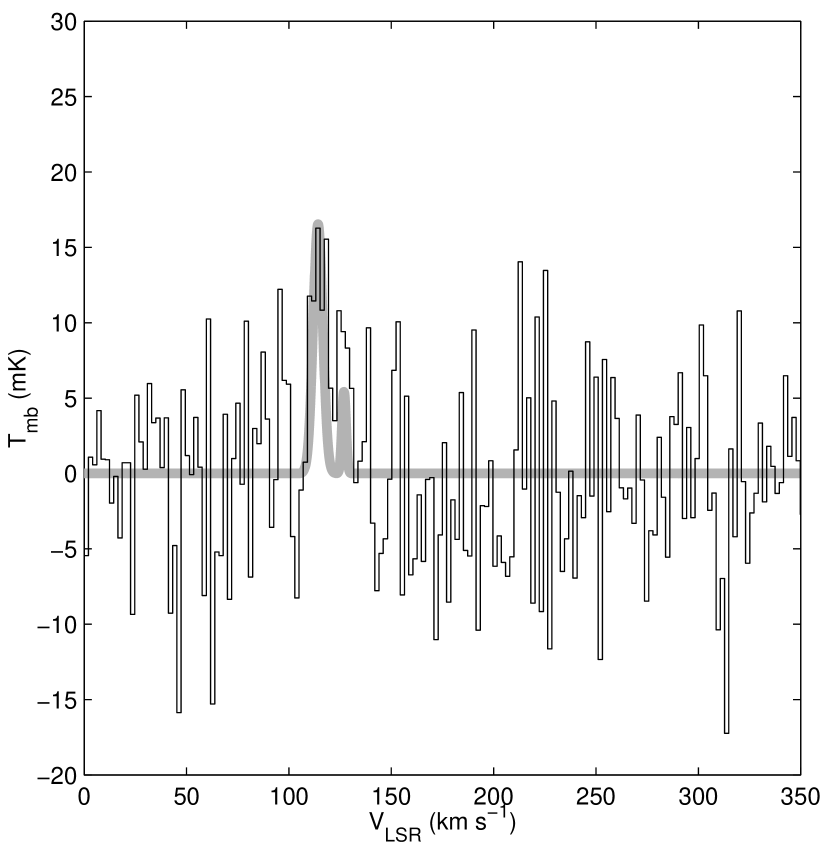
We observed the [C I] (3PP0) transition of neutral atomic carbon at GHz (609 m) using AST/RO, the Antarctic Submillimeter Telescope and Remote Observatory located at the Amundsen-Scott South Pole base (Stark et al. 1997). The observations were obtained on 3 to 7 July of 1998, using the AST/RO SIS quasi-optical receiver, with a system temperature —2400 K. The backend was the 2048 channel low resolution AOS. The spectra were observed in position switching mode, chopping 15′ in Azimuth (same as R.A. at the pole). At 492 GHz the telescope beam had HPBW. The forward efficiency determined from skydips was 70%, and it is assumed to be identical to . The pointing was better than . A region centered on this source was mapped on a 30″ grid, considerably oversampling the beam. The data were calibrated using the standard procedure for AST/RO, which includes sky, hot and cold load measurements every 30 minutes, and processed using the COMB package. The total accumulated integration time, after rejecting bad spectra, was 63 hours. The spectrum obtained after averaging all the observations together is shown in Fig. 1. A gaussian fit to the data gives km s-1, km s-1, and mK (main beam brightness). The location of the [C I] line agrees very well with the strongest CO component, for which km s-1 (Rubio et al. 1993).
The relatively weak [C I] emission from N27, combined with its small size and consequent beam dilution, produced a low signal-to-noise map. Thus the analysis in §3.1 will be focused on the averaged spectrum for the region.
3 Results and Discussion
3.1 Metallicity and the I[CI]/ICO Ratio
The prime motivation for this study is to determine the I[CI]/ICO intensity ratio in the SMC, an environment that because of its low metallicity and low dust-to-gas ratio should be dominated by PDRs (cf., §1). To do this we compare our [C I] data with the 12CO () map by Rubio et al. (1993). This map covers only a relatively small fraction of the area mapped in [C I], but it probably contains most of the CO emission: to obtain a I[CI]/ICO ratio we assume that there is no CO emission outside this region. The CO emission associated with N27 has two components, at 114.5 and 126.9 km s-1. For this analysis we have integrated the CO and [C I] data over the velocity range corresponding to the strongest component, at km s-1. In order to compute a ratio we have convolved the CO () integrated intensity data to the angular resolution of the [C I] map. Subsequently we sampled the convolved CO map at the positions observed in [C I], excluding those positions where [C I] spectra were discarded. These samples were averaged with the same weighting scheme used for [C I]. This procedure allows us to obtain a reliable average ratio for the N27 region, relatively insensitive to uncertainties in the [C I] beam size and pointing. The resulting intensities, integrated over the velocity interval 107—119 km s-1, are and K km s-1, yielding a ratio . The corresponding cooling ratio (the ratio of intensities in erg s-1 cm-2 sr-1) is . The uncertainties are and include the statistical errors as well as a 10% calibration uncertainty in the intensities, added in quadrature.
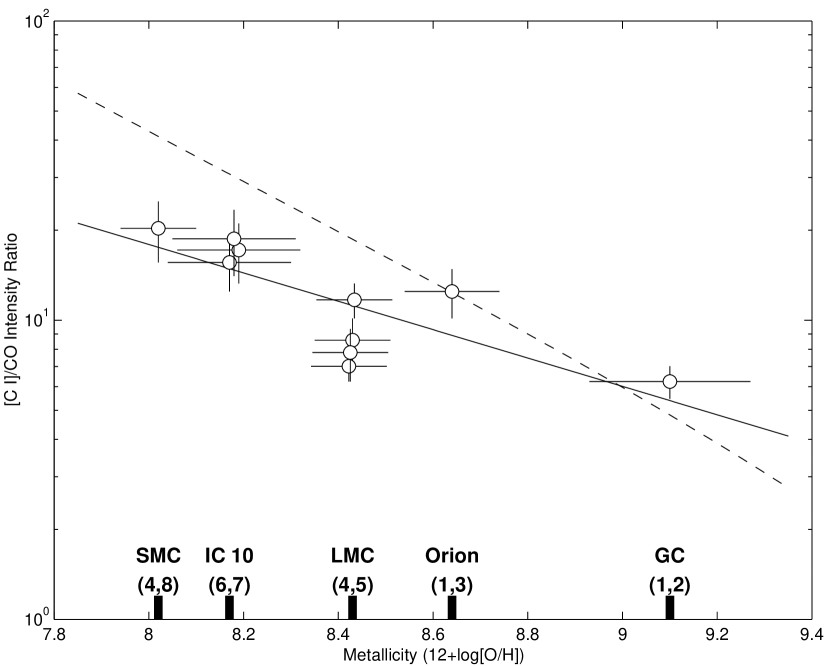
Figure 2 compares the I[CI]/ICO ratio in N27 to a sample of molecular clouds associated with star-forming regions in systems of different metallicities. This plot suggests that there is an increasing trend in the I[CI]/ICO ratio with decreasing metallicity , such that . The scatter around this line is relatively large, as shown by the data for the Large Magellanic Cloud. Theoretical expectations notwithstanding, this scatter has made it difficult to identify a trend in past studies over a narrower range of metallicities (e.g., Bolatto et al. 2000a).
Shown also in Fig. 2 is a model for carbon in unresolved PDRs (Bolatto et al. 1999). This model consists of intensity ratios computed over a distribution of clumps with uniform excitation, where each spherical clump is divided in three concentric regions of C+, C0, and CO. The sizes of these regions depend on the metallicity (or the dust-to-gas ratio) of the ISM. While necessarily crude this model incorporates the effects of clumping, and the increase in the physical size of the PDR for decreasing metallicity. The growth of the PDR is mostly caused by the diminishing attenuation of the UV radiation, as the dust-to-gas ratio of the ISM decreases for smaller metallicities. In this scenario, the primary reason why the I[CI]/ICO ratio increases for decreasing metallicity is the reduction and eventual disappearance of the CO cores in the clumps.
Are the models for the I[CI]/ICO ratio as a function of quantitatively consistent with the measurements? Bolatto et al. explore two possibilities: C0 produced in the growing PDR (model A), and C0 restricted to a region whose size does not change with metallicity (model B). This latter model predicts an essentially flat I[CI]/ICO ratio (). A similar result (constant ) would be obtained if C0 was produced inside the CO cores via unidentified chemical reactions. The slope predicted by model A in this metallicity range is slightly steeper than that suggested by the data, . Whether this difference is actually significant is difficult to assert given the paucity of observations and the intrinsic scatter in the data. Nevertheless, several possibilities could explain this discrepancy: 1) an increase in CO excitation for decreasing metallicity (i.e., hotter molecular gas for diminishing ), 2) clump-to-clump shielding preventing the efficient photodissociation of CO, 3) a dust-to-gas ratio not proportional to the oxygen abundance (but this would require the dust abundance to be a slower function of , e.g. D/G, when observations suggest D/G; Lisenfeld & Ferrara 1998), and 4) some fraction (%) of the C0 produced inside the CO cores instead of the PDR. We conclude that, within the bounds imposed by the limitations of the models and the paucity of the measurements, the observed trend for the I[CI]/ICO ratio with metallicity shown in Fig. 2 agrees with theoretical expectations for mostly photodissociation-produced C0.
3.2 Physical Conditions
The FIR spectroscopic data can be used to determine the conditions prevalent in N27. Using Table 1 and the PDR models by Kaufman et al. (1999) we will find the UV field, , and the gas density, . The important FIR ISM diagnostics computed by Kaufman et al. are: 1) the [O I] (3PP1)/(3PP2) line ratio (, according to our measurements), 2) the [O I] (3PP2) to [C II] (2PP1/2) line ratio (), 3) the ratio of [O I] (3PP2)+[C II] (2PP1/2) to the FIR continuum (using the LWS spectrum we estimate erg s-1 cm-2 sr-1, yielding ), and 4) the [C II] (2PP1/2) intensity itself. These joint four diagnostics agree very well, placing N27 in the low density, — cm-3, moderate UV field, —, region of the diagrams ( is the interstellar UV field in the vicinity of the Sun, erg cm-2 s-1; Habing 1968). The corresponding PDR temperature in these conditions is K. The FIR continuum dust temperature, derived from the LWS spectrum, is K.
The density and radiation field derived using millimeter and submillimeter lines, however, strongly disagree with the FIR results. This lack of agreement is not surprising, perhaps, since these lines probably originate in different regions of the ISM. A millimeter wavelength multiline excitation analysis using several molecular species was performed by Heikkilä et al. (1999), yielding cm-3, K, and visual extinction for N27. The I[CI]/ICO ratio determined in §3.1 strongly constrains the density according to the calculations by Kaufman et al. (1999), also resulting in — cm-3 (albeit over a much larger area). Finally, using the 12CO () observations by Rubio et al. (1993) convolved to the FIFI beam we compute an accurate I[CII]/ICO ratio at the LWS pointing, yielding . This ratio alone does not constrain either parameter very well, but implies and when used in combination with the measured I[CI]/ICO ratio results in —. This is not a fair comparison, however, since both the I[CII]/ICO and I[CI]/ICO ratios will be affected by the low metallicity and extinction of this source. Fortunately, Kaufman et al. (1999) provide some calculations for small and AV. Using their model tracks for and we find cm-3 and for N27, based on and . These measurements are also consistent with at a lower radiation field, if we allow the model tracks to be shifted in the abscissa as described by the model authors.
At any rate, the diagnostics including [C I] or molecular line observations are inconsistent with the density cm-3 implied by the FIR transitions. Because in general the FIR lines are generated closer to the surface of the cloud, this discrepancy may indicate a real density gradient in the gas. Another possibility is that the mm-submm and FIR lines originate in different regions of the cloud, with the latter dominated by material in a more diffuse interclump medium, or perhaps associated with the H II region rather than the molecular cloud. A third possibility is that the FIR line ratios are significantly affected by or AV, and using model results computed for Galactic metallicity and large AV is inappropriate. If this is the cause of the density discrepancy, however, it is remarkable that all four FIR diagnostics agree on essentially the same value for the density and radiation field. Independent of which explanation is correct, we conclude that: 1) the FIR and mm-submm measurements roughly agree on the radiation field intensity, although it is extremely important to use models with the appropriate and AV, and 2) the mm-submm data systematically indicate a density about two orders of magnitude higher than that derived from FIR fine structure data.
4 Summary and Conclusions
We report new FIR and submillimeter observations of the star forming region N27 in the Small Magellanic Cloud. Using our measured intensities for the FIR continuum and [O I] and [C II] fine structure transitions, and comparing with existing model calculations (Kaufman et al. 1999), we derive the density and radiation field in N27 to be —1000 cm-3 and —. In contrast, the density derived using millimeter and submillimeter data is two orders of magnitude higher, cm-3, while the radiation field is similar or lower, . The cause for this discrepancy is not clear, but we suggest that the FIR and the mm-submm lines arise in different parcels of gas, with the former perhaps dominated by the interclump medium or the H II region.
We have detected [C I] (3PP0) emission from the Small Magellanic Cloud for the first time. This is the lowest metallicity source in which submillimeter neutral carbon emission has been detected. Low metallicity, dust-poor environments are thought to be dominated by PDRs. Despite the factor of in metallicity spanned by N27 and Orion, however, the I[CI]/ICO ratio in N27 is only modestly larger than the I[CI]/ICO ratio in Orion. Nevertheless, when we study the ratio in several sources spanning more than an order of magnitude in metallicity, we find a noisy but convincing increasing trend in the I[CI]/ICO ratio for decreasing metallicity (Fig. 2). This trend is somewhat flatter than, but in rough agreement with, the modelling results by Bolatto et al. (1999). The existence of an increasing trend points to a photodissociation origin for most of neutral carbon inside molecular clouds, in agreement with standard PDR models.
References
- (1) Afflerbach, A., Churchwell, E., & Werner, M. W. 1997, ApJ, 478, 190
- (2)
- (3) Bolatto, A. D., Jackson, J. M., & Ingalls, J. G. 1999, ApJ, 513, 275
- (4)
- (5) Bolatto, A. D., Jackson, J. M., Wilson, C. D., & Moriarty-Schieven, G. 2000a, ApJ, 532, 909
- (6)
- (7) Bolatto, A. D., Jackson, J. M., Israel, F. P., Zhang, X., & Kim, S. 2000b, ApJ, in print (astro-ph/0007149)
- (8)
- (9) Bouchet, P., Lequeux, J., Maurice, E., Prévot, L., & Prévot-Burnichon, M. L. 1985, A&A, 149, 330
- (10)
- (11) Clegg, P. E. et al. 1996, A&A, 315, L38
- (12)
- (13) Davies, R. D., Elliot, K. H., & Meaburn, J. 1976, MmRAS, 81, 89
- (14)
- (15) Dufour, R. J. 1984, in Structure and Evolution of the Magellanic Clouds, ed. S. van der Bergh & K. S. de Boer (Dordrecht:Kluwer), 353
- (16)
- (17) Habing, H. J. 1968, Bull. Astron. Inst. Netherlands, 19, 421
- (18)
- (19) Heikkilä, A., Johansson, L. E. B., & Olofsson, H. 1999, A&A, 344, 817
- (20)
- (21) Henize, K. G. 1956, ApJS, 2, 315
- (22)
- (23) Israel, F. P. et al. 1993, A&A, 276, 25
- (24)
- (25) Israel, F. P., & Maloney, P. R. 1993, in New Aspects of Magellanic Cloud Research, eds. B. Baschek, G. Klare and J. Lequeux (Berlin:Springer-Verlag), 44
- (26)
- (27) Kaufman, M. J., Wolfire, M. G., Hollenbach, D. J., & Luhman, M. L. 1999, ApJ, 527, 795
- (28)
- (29) Laney, C. D., & Stobie, R. S. 1994, MNRAS, 266, 441
- (30)
- (31) Lequeux, J., Peimbert, M., Rayo, J. F., Serrano, A., & Torres-Peimbert, S. 1979, A&A, 80, 155
- (32)
- (33) Lisenfeld, U., & Ferrara, A. 1998, ApJ, 496, 145
- (34)
- (35) Ojha, R. et al. 2000, ApJ, submitted
- (36)
- (37) Rubio, M. et al. 1993, A&A, 271, 1
- (38)
- (39) Stark, A. A., Chamberlin, R. A., Cheng, J., Ingalls, J. G., & Wright, G. 1997, Rev. Sci. Inst., 68 (5), 2200
- (40)
- (41) Sternberg, A., & Dalgarno, A. 1995, ApJS, 99, 565
- (42)
- (43) Swinyard, B. M. et al. 1996, A&A, 315, L43
- (44)
- (45) Tielens, A. G. G. M., & Hollenbach, D. 1985, ApJ, 291, 722
- (46)
| Specie | Transition | Wavelength | Beam Size | ESCFaaRecommended extended source correction factor (ISO LWS Handbook online v1.0). | Line Flux | Continuum | Line/Cont.bbLine to continuum ratio at line center (unresolved lines, m for m. Otherwise m). | ||
|---|---|---|---|---|---|---|---|---|---|
| (m) | (sr) | (erg s-1 cm-2 sr-1) | (MJy sr-1) | ||||||
| [O III] | (3PP1) | 51.815 | 0.85 | 1.34 | 191 | 0.20 | 0.03 | ||
| [O I] | (3PP2) | 63.184 | 0.83 | 3.93 | 237 | 0.72 | 0.02 | ||
| [O III] | (3PP0) | 88.356 | 0.67 | 9.64 | 293 | 0.13 | 0.01 | ||
| [O I] | (3PP1) | 145.525 | 0.58 | 2.01 | 415 | 0.06 | 0.01 | ||
| [C II] | (2PP1/2) | 157.741 | 0.58 | 9.46 | 394 | 3.14 | 0.04 | ||