Detection of X-ray Emission from Gravitationally Lensed Submillimeter Sources in the Field of Abell 370
Abstract
We report the detection by Chandra of SMM J023990134 and SMM J023990136, two distant ( and , respectively) submillimeter sources gravitationally magnified by the galaxy cluster Abell 370. These are high-significance () X-ray detections of the high-redshift submillimeter source population. The X-ray positions are coincident with the optical positions to within one arcsecond. The X-ray spectra, while of low signal-to-noise ratio, are quite hard. Absorbed power law models with fixed photon indices of imply local absorbing columns cm-2 and unabsorbed luminosities erg s-1 in both sources. These results imply that nuclear activity is responsible for the bulk of the luminosity in SMM J023990134, and for at least 20% of the luminosity of SMM J023990136, consistent with previous optical observations. We also place an upper limit on the X-ray flux of a third submillimeter source, SMM J024000134. Considered together with previously published Chandra upper limits on X-ray flux from submillimeter sources, our results imply that % of submillimeter sources exhibit X-ray emission from AGN (90% confidence), consistent with expectations of their contribution to the diffuse X-ray background.
1 Introduction
Deep surveys with the Submillimetre Common User Bolometer Array (SCUBA: Holland et al. 1998) in the fields of rich clusters (Smail et al., 1998) and in blank fields (e.g., Hughes et al. 1998; Barger, Cowie & Sanders 1999; Eales et al. 1999) have revealed a large population of luminous, star-forming galaxies at high-redshift. This population produces a substantial fraction of the diffuse infrared background (Fixsen et al., 1998), and, while the contribution of AGN to its total luminosity is uncertain, accounts for at least as much star formation as has been inferred from UV/optical counts (Dwek et al., 1998; Blain et al., 1999). Besides their significance for the star-formation history of the universe, a subset of the submillimeter (sub-mm) source population may also host the obscured AGN thought to be responsible for the diffuse X-ray background (Almaini, Lawrence & Boyle 1999, hereafter ALB99; Hasinger 2000; Fabian et al. 2000). X-ray background models (ALB99; Gunn & Shanks 1999) and optical spectroscopy of sub-mm sources (Barger et al. 1999, hereafter B99) both suggest that % – % of SCUBA sources should contain an AGN.
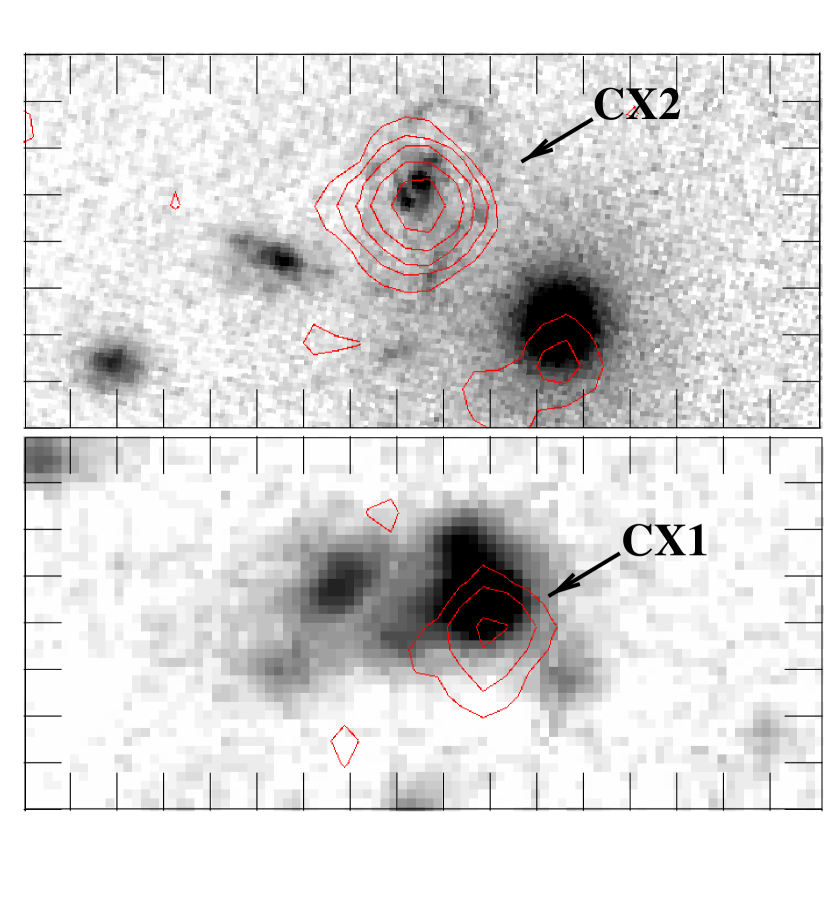
Deep X-ray observations with the Chandra X-ray Observatory can test this connection directly. We report here high-significance X-ray detections of bright sub-mm sources at high redshift, and the first X-ray spectral constraints on this population. The three sub-mm sources we discuss, SMM J023990136, SMM J023990134, and SMM J024000134, are gravitationally magnified by Abell 370 and are detected at greater than significance by SCUBA (Smail et al. 1997; B99). We detect the first two of these, hereafter designated CX1 and CX2, respectively. Both X-ray-detected sources were previously identified with high-redshift ( and , respectively) star-forming galaxies containing AGN (Ivison et al., 1998, hereafter I98; Soucail et al., 1999, hereafter S99). We place an upper limit on the X-ray flux from the third, which has no optical counterpart to a limiting magnitude of (Smail et al. 1998; B99).
2 Observations
Chandra observed Abell 370 with the ACIS S3 detector (Garmire et al., 2000) in 1999 October for 93 ks. The net useful exposure time excluding periods of high background and bad aspect is 66.6 ks. Events in ASCA grades 1, 5, and 7 were excluded, and unless otherwise noted, our analysis is restricted to the 0.3–7 keV spectral range.
Source Detection and Astrometry: We ran the Chandra X-ray Center’s wavdetect wavelet source detection program on an field containing the cluster. We used wavelet kernel scales of 1–8 arcsec, and set the threshold detection significance parameter to 10-7. Two of the 34 sources detected are positionally coincident with sub-mm sources described above to within 2.6 arcsec.
Table 1 lists the X-ray positions and compares them with the best available optical positions (source L1 of I98 for CX1; S99 for CX2) for the identified sub-mm sources. Formal random errors in the X-ray positions are of order 0.2′′ in each axis. Systematic errors of may affect the Chandra aspect solution currently available for this observation. We compared the positions of other compact sources detected in the Chandra image to various optical catalogs and found 4 stellar objects in the APM catalog with positions within 3′′ of sources detected in the ACIS S3 field. The mean coordinate differences between the Chandra and APM frames derived from these objects are listed in Table 1. The standard deviation of each of these mean differences is 0.5′′, and the external accuracy of the APM astrometry is claimed to be (APM, 1998).
We adopt the mean ChandraAPM offset as the Chandra boresight error, and find that the Chandra and optical positions for both sources agree within 1′′. X-ray source positions (from other ACIS detectors) for four objects in the USNO catalog, so corrected, have a mean radial error . We note that the 3 mm radio position of CX1 (Frayer et al., 1998) agrees with both the optical and X-ray positions to within 1′′. We note also that 14 X-ray sources at least as bright as CX1 are detected in the Abell 370 field; the probability of any of these fortuitously lying within 1.5 arcec of one of the sub-mm sources is less than . X-ray surface brightness contours from the gaussian-smoothed (), boresight-corrected Chandra image are overlayed on optical images in Figure 1.
Photometry and Spectroscopy: Net source counts in apertures for detections, and 99% confidence upper limits in 2′′ radius apertures, with corresponding background levels, are listed in Table 1. Although the local cluster emission exceeds the particle background by a factor of at the source locations, the two (hard-band) detections are highly significant ( equivalent). Upper limits were computed using the prescription of Kraft, Burrows & Nousek (1991). The celestial coordinates of SMM J024000134 are taken to be , (J2000), derived from the finding chart of B99. X-ray fluxes are derived from the hard-band counts assuming a power law spectrum with a photon index of . The 850m flux densities are from B99.
In spite of the small count totals, we can constrain the spectra of the detected sources. Both sources are quite hard, as neither is detected above the cluster emission in the 0.3–1.5 keV band by wavdetect. We fit a series of simple XSPEC (Arnaud, 1996) models to pulse-height spectra extracted from square apertures. We modelled the background as the sum of i) a power law component and fluorescent lines, accounting for the particle background; ii) a cool thermal component, representing Galactic emission; and iii) a hot thermal component representing the cluster. The relative amplitudes and shapes of the various background components were determined from suitable regions of the cluster image, and normalizations were determined locally for each source. The resulting fixed background model was added to the source model and the maximum likelihood statistic was minimized to identify the best-fit source parameters.
Optical and infrared data suggest that these objects contain AGN (see Section 3), so we fit power law models with absorbtion by the Galaxy (fixed at N cm-2; Stark et al. 1992) and by neutral material at the source. If the source absorbing column () is fixed at zero, the best-fit power law index () is consistent with zero, within wide limits, for both sources. In the case of CX2 this model systematically over-predicts the data at both low and high energies, suggesting that additional absorption is required. The fit is better if both and are varied, but is very poorly constrained. In the case of CX1, an -test shows that the addition of local absorption does not produce a statistically significant improvement in the fit. For both sources, the indeterminancy in is accompanied by a corresponding uncertainty in the absorbing column and in the intrinsic luminosity of the source.
Faced with this ambiguity, we fix the photon number index in our fits. The X-ray spectra of low-redshift AGN generally exhibit (unabsorbed) continuum slopes in a restricted range (; e.g., Nandra et al. 1997; Turner et al. 1997). Here we consider models with . Any reflected component present is likely to be much harder, and, if the obscuring column is sufficiently high, will dominate the observed emission, at least at lower energies.
Results of fits are presented in Table 2, where values for fixed and are separated by slashes, and the 90% confidence envelope for these two cases is given in parentheses. To allow interpretation of the X-ray flux either as directly transmitted (through an absorbing column) or as reflected emission, we quote both “unabsorbed” and “observed” 2–10 keV luminosity in the source rest frame. All tabulated luminosities have been corrected for the estimated gravitational magnification as discussed in Section 3 below.
3 Discussion
From the positional coincidences discussed above we may reasonably identify the Chandra and sub-mm sources. Here we discuss the role of the AGN in the bolometric luminosity of these sources, and consider the implications of our results for the expected connection between the X-ray and sub-mm backgrounds.
3.1 The AGN Contribution to Bolometric Luminosity
The role of AGN in the energetics of ultraluminous infrared galaxies remains an open question, particularly in the case of the objects thought to comprise the high-redshift sub-mm source population. In the following discussion, we adopt a gravitational magnification of 2.5 for both sources. The uncertainty in this value is no more than a factor of 2 in the case of CX1 and about 10% in the case of CX2 (Kneib et al, 1993; I98; S99).
SMM J023990136 (CX1): I98 presented comprehensive optical and infrared data which determined the redshift and showed emission from a narrow-line, dust-obscured AGN. They report detection by ISO at 15 m but were unable to determine the relative importance of star formation and the AGN in producing the enormous bolometric luminosity of this object (L L⊙, referred to our cosmology.) Frayer et al. (1998) detected CO line emission in CX1, implying a large mass of molecular gas (1010 M⊙) and a relatively small ratio of far-infrared (FIR) to CO luminosity, indicating that star formation is important in this source. They conclude from the relatively low FIR-to-4.85 GHz flux ratio that 50% 25% of the infrared luminosity may be powered by the AGN.
We find that the ratio of X-ray to bolometric luminosity for this source exceeds 1.5% for . Although this limit is rather low for radio-quiet quasars (Elvis et al., 1994), we note that at least two luminous type 2 AGN, IRAS 23060+0505 (Brandt et al., 1997) and IRAS 20460+1925 (Ogasaka et al., 1997), have comparable or lower values of LX/Lbol. Adopting the median bolometric correction LX(1-10 keV)/L from Elvis et al. (1994), we find L erg s-1, about 40% of the FIR luminosity. Between 20% and 80% of the luminosity of CX1 is attributable to the obscured AGN if .
The large column density ( cm-2 if ) inferred for CX1 suggests that the obscuring material may be Compton-thick, in which case we must interpret the X-ray emission as predominantly reflected (rather than obscured) radiation from the central source. From the “observed” luminosity in Table 2, it follows that if the X-ray emission is due to reflection from cold gas with an albedo of 0.022 (Iwasawa et al., 1997), then the nucleus in CX1 is of quasar luminosity.
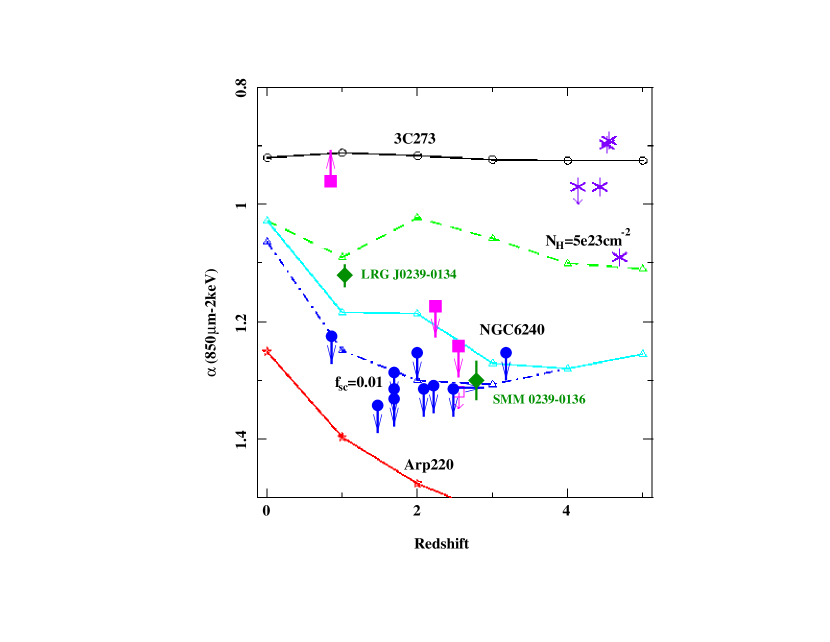
We can independently estimate the importance of the AGN in CX1 by comparing its sub-mm-to-X-ray flux ratio with that of the ultraluminous infrared galaxy NGC 6240, in which a highly-obscured, powerful AGN dominates the bolometric luminosity (Vignati et al., 1999). Following Fabian et al. (2000), we characterize this ratio as an equivalent energy index , defined so that spectral flux density . Taking at 850 m and 2 keV from Table 1, we find . This value is less than that expected of NGC6240 (observed at ) by about a factor of 2 (corresponding to ); see Figure 2. This might mean either that the fraction of scattered radiation is lower, or that the AGN is relatively less luminous, in CX1 than in NGC 6240.
SMM J023990134 (CX2): S99 identified the ring galaxy LRG J02390134 with SMM J023990134, measured its redshift, reconstructed its intrinsic shape, and noted that the ring feature is indicative of interaction-induced star formation. The optical spectrum and the ISO mid-IR colors led S99 to identify the source as a Seyfert type 1. From a Keck LRIS spectrum, B99 classify it as a Seyfert 1.5.
The X-ray luminosity and spectrum of this source confirm the presence of a powerful, obscured AGN. Applying a bolometric correction to the unabsorbed X-ray luminosity yields erg s-1 which dominates the luminosity in the sub-mm (B99) and the mid-IR (Soucail et al., 1999). For CX2, = 1.12, which is quite comparable to the value expected if NGC6240 were observed at , allowing for the relatively smaller observed absorbing column in CX2 (Fabian et al., 2000); see Figure 2.
3.2 The X-ray/Submillimeter Connection
Two other searches with Chandra for X-ray emission from sub-mm sources have yielded only upper limits or detections marginal in the sub-mm or the X-ray bands. Fabian et al. (2000) report upper limits for six SCUBA sources in two cluster fields, with typical flux upper limits (uncorrected for gravitational magnification) in the deeper field of 4–5 erg s-1 cm-2 (2–7 keV). Hornschemeier et al. (2000) report upper limits for 10 SCUBA sources from a very deep (166 ks) Chandra image containing the Hubble Deep Field (HDF), with typical upper limits 0.8 erg s-1 cm-2 (2–8 keV). Given the cluster X-ray emission, we estimate our 99% confidence detection threshold for sources near the center of A370 to be about 1.5 erg s-1 cm-2 in the 1.5–7 keV band for sources with the spectrum (, and no intrinsic absorption) assumed by both groups.
We must estimate the fraction of sub-mm sources that have detectable AGN using a sample that has been observed to an explicit sub-mm-to-X-ray flux ratio (i.e., to a particular value of , as defined above). We adopt our lower limit for SMM J024000134, viz. , (as determined from the hard band flux). While none of the limits on from Fabian et al., and only one of the limits from Hornschemeier et al. is this high, we note that both groups compute flux assuming and no absorption at the source. We observe spectra much harder than this assumed model. Accordingly, we recompute the previously published flux limits using a flat (, unabsorbed) spectrum, and find that the (hardband) X-ray flux density limits drop by about a factor of two. After making this adjustment, we find that 7 of the HDF limits are sufficiently stringent to have detected a source with . In this sample, then, 2 of 10 sub-mm sources (% where errors give the central 90 percent confidence interval for a binomial distribution) have detectable X-ray emission. Fisher’s exact probability test (Petrucelli, Nandram & Chen, 1999) shows that the probability of finding the observed detection rates, given the identical detection efficiency in Abell 370 and the HDF, is modest (6.7%) but not implausible.
After this paper was submitted, Severgnini et. al. (2000) reported that 1 of 9 sources detected with SCUBA in the Hawaii SA13 field by Barger, Cowie & Sanders (1999) was also detected in the Chandra survey of SA13 by Mushotzky et al. (2000). The detected source has , based on the hard-band flux, and the lower limits on for the other sources span . Thus the SA13 data are not sensitive to as low an X-ray-to-sub-mm flux ratio as are ours. If we nevertheless pool these sources, together with all other Chandra observations of sub-mm sources discussed above, without regard to sensitivity and including marginal detections, we find that 7 of 32 sub-mm sources have Chandra counterparts.
The X-ray-detected fractions in both samples are quite consistent with the predictions of ALB99, who model the IR emission of the AGN which produce the diffuse X-ray background and find that 10% – 20% of sources detected at 850m should be AGN. Similarly, the “conservative” models of Gunn and Shanks (1999) predict an AGN fraction of 5% – 15%, which is also consistent with our results.
In summary, we have detected powerful, hard X-ray sources in two luminous, high-redshift sub-mm sources. Both of these objects were previously known, from optical spectra, to contain AGN, and in both the AGN are probably responsible for a substantial fraction of the bolometric luminosity, though star formation is clearly important in SMM J023990136. The proportion of sub-mm sources detected by Chandra to date is consistent with models which synthesize the cosmic X-ray background from obscured AGN at high redshift.
We thank R. Mushotzky for many helpful discussions, and L. Cowie and A. Barger for the Keck image of CX1. This work was supported by NASA under contracts NAS-8-37716, NAS-8-38252 and 1797-MIT-NA-A-38252. WNB acknowledges the support of NSF Career grant AST-9983783.
References
- Almaini, Lawrence & Boyle (1999) Almaini, O., Lawrence, A. X. & Boyle, B. J., 1999, MNRAS, 305, L59 (ALB99)
- Arnaud (1996) Arnaud, K., 1996, Jacoby, G. & Barnes, J., eds., Astronomical Data Analysis Software and Systems V; ASP Conference Series, 101,17
-
APM (1998)
APM Website, http://www.ast.cam.ac.uk/
~apmcat - Barger, Cowie & Sanders (1999) Barger, A. J., Cowie, L.L. & Sanders D. B., 1999, ApJ, 518, L5
- Barger et al. (1999) Barger, A. J., Cowie, L.L, Smail, I., Ivison, R.J., Blain, A. W., & Kneib, J.-P., 1999, AJ, 117, 2656 (B99)
- Blain et al. (1999) Blain, A. W., Smail, I., Ivison, R. J., and Kneib, J.-P., 1999, MNRAS, 302, 632
- Brandt et al. (1997) Brandt, W.N., Fabian, A.C., Takahashi, K., Fujimoto, R., Yamashita, A., Inoue, H. & Ogasaka, Y., 1997, MNRAS, 290, 617
- Cowie & Barger (2000) Cowie, L. & Barger, A., 2000, private communication
- Dwek et al. (1998) Dwek, E., et al., 1998, ApJ, 508, 106
- Eales et al. (1999) Eales, S., Lilly, S., Gear, W., Dunne, L., Bond, J., Hammer, F., LeFevre, O. & Crampton, D., 1999,ApJ, 515, 518
- Elvis et al. (1994) Elvis, M., Wilkes, B. J., McDowell, J. C., Green, R. F., Bechtold, J., Willner, S.P., Oey, M.S., Polomski, E., & Cutri, R., 1994, ApJS, 95, 1
- Fabian et al. (2000) Fabian, A. C., et al. 2000, MNRAS, (submitted)
- Fixsen et al. (1998) Fixsen, D.J. et al., 1998, ApJ, 508, 123
- Frayer et al. (1998) Frayer, D.T., Ivison, R.J., Scoville, N.Z., Yun, M., Evans, A.S., Smail, I., Blain, A.W. & Kneib, J.-P., 1998, ApJ, 505, L10
- Garmire et al. (2000) Garmire, G.P. et al., 2000, in preparation.
- Gunn & Shanks (1999) Gunn, K. & Shanks, T., astroph/990989
- Hasinger (2000) Hasinger, G., astroph/0001360
- Hughes et al. (1998) Hughes, D.H. et al., 1998, Nature, 394, 241
- Holland et al. (1998) Holland, W. S. et al., 1999, MNRAS, 303, 659
- Hornschemeier et al. (2000) Hornschemeier et al., 2000, ApJ, in press (astroph/0004260)
- Ivison et al. (1998) Ivison, R. J. et al., 1998, MNRAS, 298, 583 (I98)
- Iwasawa et al. (1997) Iwasawa, K., Fabian, A.C. Matt, G., 1997, MNRAS, 289, 443
- Kneib et al. (1993) Kneib, J.-P., Mellier, Y., Fort, B. & Mathez, G., 1993, A&A, 273, 367
- Kraft, Burrows & Nousek (1991) Kraft, R. P., Burrows, D. N. & Nousek, J. A., 1991, ApJ, 374, 344
- Mushotzky et al. (2000) Mushotzky, R., Cowie, L., Barger, A. & Arnaud, K., 2000, Nature, 404, 459
- Nandra et al. (1997) Nandra, K., George, I. M., Mushotzky, R. F., Turner, T. J., & Yaqoob, T., 1997, ApJ, 477, 602
- Ogasaka et al. (1997) Ogasaka, Y., Inoue, H., Brandt, W. N., Fabian, A. C., Kii, T., Nakagawa, T., Fujimoto, R. & Otani, C., 1997, PASJ, 49, 179
- Petrucelli, Nandram & Chen (1999) Petrucelli, J. D., Nandram, B. & Chen, M., 1999, Applied Statistics for Engineers and Scientists (Saddle River, NJ: Prentice Hall) p 682.
- Severgnini et al. (2000) Severgnini, P., et al., 2000, A&A, in press; astroph/0006233
- Smail et al. (1997) Smail, I., Ivison, R.J., Blain, A.W., 1997, ApJ, 490, L5
- Smail et al. (1998) Smail, I., Ivison, R.J., Blain, A.W., & Kneib, J.P., 1998, ApJ, 507, L21
- Soucail et al. (1999) Soucail, G., Kneib, J.P., Bezecourt, J., Metcalfe, L., Altieri, B., & le Borgne, J.F., 1999, A&A, 343, L70 (S99)
- Stark et al. (1992) Stark, A. A., Gammie C.P., Wilson R.W., Bally J., Linke R., Heiles C. & Hurwitz M., 1992, ApJS, 79, 77
- Turner et al. (1997) Turner, T.J., George, I.M., Nandra, K. & Mushotzky, R.F., 1997, ApJS, 113, 23
- Vignali et al. (1999) Vignali, C., Comastri, A., Cappi, M., Palumbo, G.G.C., Matsuoka, M. & Kubo, H., 1999, ApJ, 516, 582
- Vignati et al. (1999) Vignati, P., et al., 1999, A&A, 349, L57
| SMM IDaafootnotemark: | CXO Name | RAbbfootnotemark: | Decbbfootnotemark: | Countsccfootnotemark: | F2keVddfootnotemark: | S850eefootnotemark: | |
|---|---|---|---|---|---|---|---|
| (J2000) | (J2000) | (′′) | (′′) | 1.5–7keV | 0.3–1.5keV | ||
| 023990136 (CX1) | 023951.9013558 | 0.57 | 25.1/5.9 | /4.5 | 0.7 (0.4,0.9) | 25.3 | |
| 023990134 (CX2) | 023956.6013426 | 2.55 | 115/8.1 | /5.8 | 3.2 (2.7,3.7) | 11.0 | |
| 024000134 | 9.5/2.3 | 7.2/3.9 | 7.6 | ||||
| Chandra vs. APM Boresight Difference | 1.6 | ||||||
| Source | NH,saafootnotemark: | LX,observedbbfootnotemark: | LX,unabsorbedbbfootnotemark: |
|---|---|---|---|
| CX1 | 9/13 (5,23) | 0.31/0.33 (0.12,0.62) | 3.0/6.4 (1.7,8.8) |
| CX2 | 2.1/2.7 (1.6,3.5) | 0.43/0.45 (0.40,0.56) | 1.0/1.4 (0.80,1.8) |