Measurement of air shower cores to study the cosmic ray composition in the knee energy region
Abstract
Since 1996, a hybrid experiment consisting of an emulsion chamber and a burst detector array and the Tibet-II air shower array has been operated at Yangbajing (4300 m above sea level) in Tibet. This experiment can detect air-shower cores, called burst events, accompanied by air showers in excess of about 100 TeV. Using the burst event data observed by this experiment, we discuss the primary cosmic ray composition around the knee in comparison with the Monte Carlo simulations. In this paper, we show that all the features of burst events are wholly compatible with the heavy enriched composition in the knee energy region.
pacs:
PACS numbers : 95.85Ry, 98.70Sa, 96.40Pq, 96.40DeI INTRODUCTION
It is commonly understood that the knee of the primary cosmic ray spectrum has its origin in the acceleration and propagation of high energy cosmic rays in the Galaxy. The model of the shock acceleration by supernova blast waves leads to the formation of a power-law spectrum of particle energies with a differential index of about -2 at sources [1]. The plausible propagation models of their confinement by galactic magnetic fields and of their eventual escape from our Galaxy can explain well a steeper power-law spectrum than that at the source region [2], suggesting a rigidity-dependent bending for different cosmic ray composition. Within the framework of this picture the average mass of primary cosmic rays before the knee should increase with increasing primary energy. In other words, the knee composition should be heavily dominant as the proton spectrum may bend at an energy of about 100 TeV corresponding to a maximum energy gained by shock acceleration at supernova remnants.
While there is no consensus on the origin of cosmic rays with energies beyond the knee, observations of cosmic rays in such a high energy region may naturally stand in need of another acceleration mechanisms [3, 4] or new cosmic ray sources [5, 6]. Among those, one of the most promising models may be that the cosmic rays come from extra-galactic sources such as active galactic nuclei [6], although the evidence is far from convincing. However, such an extra-galactic source model should predict proton enriched primary composition around and beyond the knee.
Thus, measurements of the primary cosmic rays around the knee are very important and its composition is a fundamental input for understanding the particle acceleration mechanism that pushes cosmic rays to very high energies. However, because of extremely low and steeply decreasing flux at high energies, direct measurements of primary cosmic rays on board balloons are still limited in the energy region to below a few hundred TeV [7, 8]. To date, the knee composition of primary cosmic rays has been studied by observing air showers with a large aperture ground-based apparatus. For air shower observations, a surface detector array is commonly set up to measure the lateral distributions and the arrival times of shower particles (mostly electrons and photons), which enable us to locate the core position, determine the arrival direction, and deduce the shower size and shower age [9]. These are important basic parameters to describe an air shower, although they are not very sensitive to the primary composition. In order to study the composition around the knee, measurements of muon content in each air shower [10] or muons in deep underground [11, 12], measurements of lateral distribution of air shower Cherenkov lights [13], or maximum depth of shower development using air Cherenkov telescopes [14], and multiparameter measurements of air showers [15] have been carried out and devoted to making the conclusion about the knee composition. In spite of great efforts so far, however, there is a divergence of conclusions on the composition from experiment to experiment and the knee composition is still the question at issue. Another approach may be required to get more direct information about the composition.
Within the ground-based air shower experiments those set up at higher altitudes are preferable for the physics studies at the knee region. The reasons include ; first, maximum development of showers with the knee energies is closer to the observation level, so that the shower is less fluctuated and the energy determination is more precise and less dependent upon the unknown composition [9] ; second, the energy flow in the core region of air showers is less attenuated and easier to observe with conventional calorimeters. High energy air-shower cores are sensitive to the composition of the primary cosmic rays around the knee. Air-shower cores contain a large part of the primary energy in the early stage of shower development, but with increasing atmospheric depth they are rapidly diffused with dissipation of their energies. Hence, the measurement of air-shower cores should be implemented at high altitude with a detector having a reasonably large area. In general a thick shower detector is required when one wants to record all (or most) hadronic components in the core, but this needs enormous heavy materials to absorb them in the detector. At high altitude, however, this can be achieved by observing the electromagnetic components in the core with a thin detector, since these are mostly the cascade products induced by high energy -decay rays which are produced in the air shower cores. Therefore, the electromagnetic components in the core well reflect the major behavior of the whole hadronic components, keeping the sensitivity to the primary composition.
In this paper we report our study of the primary composition in the knee region using data of the Tibet burst detector and the air-shower array II. The experiment, including the apparatus and its performance, data set and background analysis, is introduced in Sec. II. The air-shower simulation and detector response calculation are described in Sec. III. The results and discussions are described in Sec. IV. A brief summary is given in Sec, V.
II EXPERIMENT
A Apparatus
We started a hybrid experiment of the emulsion chamber, the burst detector and the air shower array (Tibet-II) at Yangbajing (4300 m above sea level), Tibet in 1996 [16]. The Tibet-II array consists of 221 scintillation counters of 0.5 m2 each which are placed on a 15 m square grid and has been operated since 1995. Any fourfold coincidence in the detectors is used as the trigger condition for air-shower events. Under this condition the trigger rate is about 200 Hz with a dead time of about 12% for data taking. The energy threshold is estimated to be about 7 TeV for proton induced showers. The precision of the shower direction determination is about , which has been confirmed by observing the Moon’s shadow [17]. The main aim of Tibet-II is to search for -ray point sources at energies around 10 TeV. But it can also be used for the measurement of the spectrum of the total cosmic ray particles [9], and for the study of topics in the knee region by providing information of the shower size, direction, core position, and arrival time of each air-shower event to the core detectors [16].
The emulsion chambers and the burst detectors are used to detect high-energy air-shower cores accompanied by air showers induced by primary cosmic rays with energies above 1014 eV. They are set up separately in two rooms as shown in Fig. 1 and placed near the center of the Tibet-II array. A basic structure of each emulsion chamber used here is a multilayered sandwich of lead plates and photosensitive x-ray films. Photosensitive layers are put every 2 cascade unit (c.u.) (1 c.u. = 0.5 cm) of lead in the chamber as shown in Figure 2. There are 400 units of emulsion chamber, each with an area of 40 cm 50 cm with the total thickness of 15 c.u., giving the total sensitive area of 80 m2, and 100 units of burst detectors each with an effective area of 160 cm 50 cm. Four units of the emulsion chamber are put above one unit of the burst detector. A 1 cm iron plate is put between emulsion chambers and burst detectors.
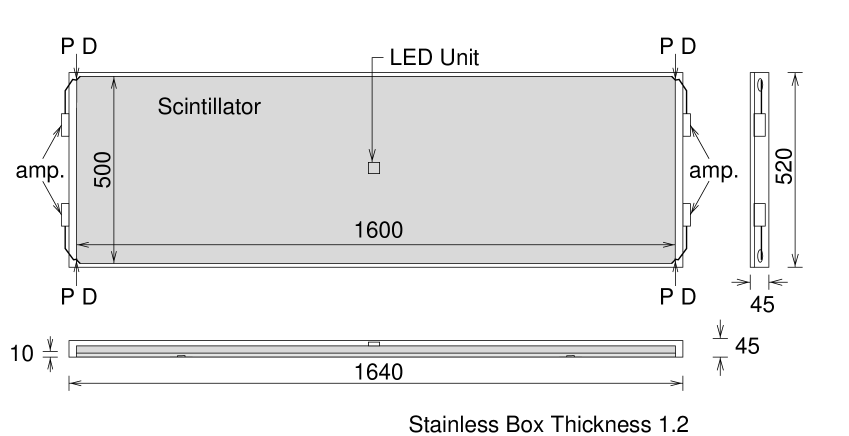
Each burst detector consists of a plastic scintillator with the size of 160 cm 50 cm and thickness of 2 cm, and four photodiodes (PDs) are attached at four corners of each scintillator to read light signals generated by shower particles produced in the lead and iron absorber above the detector. From the analogue-to-digital converter (ADC) values of four PDs the total number (i.e., burst size ) and the position of the number-weighted center of all shower particles that hit a burst detector can be estimated. The response of the burst detector is calibrated using electron beams from an accelerator. The performance of the burst detector and the calibration using the electron beams are briefly summarized in the Appendix. It is confirmed that the measurable shower size by each burst detector ranges from to , roughly corresponding to showers with energies ranging from several times 100 GeV to about 300 TeV. A burst event is triggered when any two-fold coincidence of signals from four PDs of a burst detector appears. The coincidence of a burst event and an air-shower event is made by their arrival times, and the coincidence of a burst event and a family event observed in the emulsion chamber is made by their positions and directions. (A burst event and its accompanying air shower have the same direction.)
In this analysis we use only the data obtained from all burst detectors and the Tibet-II array, while the emulsion chamber data will be reported elsewhere in the very near future. Using the burst detector array shown in Fig. 1, the electromagnetic components in the air-shower cores can be measured in the area within a radius of several meters.
B Data set
The data set of the burst detector used for this work was taken from 16 October 1996 to 1 June 1999. First we scanned the target maps of all events with the naked eye. All those events showing a systematic noise configuration were ruled out during the first scanning. Then we removed the events that were not coincident with the air-shower events recorded by the Tibet-II array. Finally we imposed the following conditions on the events : (1) when the number of fired detectors is only one, its size should be larger than ; and (2) when more than one detector is fired, the largest size (hereafter for each event we call the detector that observed the highest burst size the TOP detector) should be larger than and also the size of any other one should be larger than (minimum size).
From this procedure, we selected 9278 events in total. Two examples of the burst detector events are shown in Fig. 3, where the scale of the marks is logarithmically proportional to the burst size. A remarkable core structure in the event pattern may be recognized.
C Background analysis
We carefully examined whether some background exists in the data of each event since the whole burst detector is separated into two sections and there is a distance of 9 m between them. In the following, we call the section containing the TOP detector as the “TOP section”, and the other as the “OTHER section”. We first examined whether those bursts located far from the TOP detector still contain signals or not. For this, we divided all events into five groups according to the TOP detector in which each event was in the first, second, third, fourth and fifth column of the TOP section, and then the size distribution of any one burst detector in the OTHER section was obtained, respectively, for each group. It is expected that if the bursts recorded in the OTHER section contain signals, their burst size distribution should be different with different event groups because they have different core distances. However these five distributions, which are taken from the first year’s data set, are almost the same as seen in Fig. 4, showing to be independent of the core distance. This suggests that when the distance to the TOP detector (i.e., to the air-shower core), is larger than 10 m almost all recorded bursts are formed by noises ranging from to under our experimental conditions. The same burst size distributions in the OTHER section are seen from the data sets of the second and third year’s observation, showing that a stable noise existed during the whole period of the operation. Therefore, the distribution showing in Fig. 4 is recognized as the background coming from our experimental conditions. These noises may be mostly induced by an incomplete ground connection of the detectors to the earth. Actually, when the thunder is rumbling, an increase of the noises is observed. Hence, it is reasonable to assume that some background may still exist in the data of the TOP section although the minimum shower size for the burst detector is set to be in the present analysis. The treatment of the background is discussed later when the data are compared with the simulation.
III MONTE CARLO SIMULATION
A Air-shower simulation
Air showers induced by different primary particles were generated by using the Monte Carlo codes CORSIKA-QGSJET [18] and COSMOS [19] which have been used for many cosmic ray experiments and shown to be able to explain many quantities at the energy region below and around the knee fairly well. The all-particle spectrum measured by the Tibet AS Collaboration [9] is used as the input of simulations. The minimum energy of primary particles to be sampled is taken to be 500 TeV and the zenith angle at the top of the atmosphere is uniformly sampled between and . Since the chemical composition of primary particles is unknown around the knee region, four different composition models are examined to compare with the experiment. While two of them, being pure protons and pure irons, are extreme assumptions, these provide some boundary of predictions used as the first check of the interaction models adopted in the Monte Carlo simulation. When some data happen to be outside the boundary, this may raise some points in the interaction models that must be ruled out. Two others are the heavy dominant (HD) and proton dominant (PD) models [20], which are shown in Fig. 5. In both models the chemical composition is divided into seven groups : proton, helium, light (), medium (), heavy (), very heavy () and iron. The HD model may be related to a supernova acceleration and rigidity dependent propagation model in that the proton component is assumed to bend at energy of about 100 TeV. The fraction of the iron component increases with increasing primary energy, resulting in the primary becoming heavy dominant at the knee. The PD model assumes a proton dominant chemical composition over the whole knee energy region, while all components bend at energies of 2000 TeV. In both HD and PD models the summation of all individual spectra of different nuclear species is fitted to the observed total particle spectrum as shown in Fig. 5.
In this simulation all shower particles are followed by a full Monte Carlo method until their energies become 1 GeV. Although the smallest burst size to be observed per detector is taken to be (see Sec. II B), corresponding to a few to 10 TeV for a single -ray or a single electron incident on the surface of the burst detector, we need to follow shower particles untill 1 GeV since a large number of low energy particles near the shower core hitting the detector make a contribution to the observed burst size that is not negligible.***Setting the lowest energy at 1 GeV does not mean the observational threshold of our burst detector is as low as 1 GeV. The major contribution to the burst events as we analyzed in this work comes from particles with energy higher than 100 GeV. However, we determined that a contribution from shower particles lower than 1 GeV is insignificant, i.e., smaller than .
B Simulation for burst detector
Shower developments in the burst detector were calculated based on the data obtained using a Monte Carlo code, EPICS [21]. When an air-shower event reaches the observation level it is dropped within the area of 14 m21 m (294 m2) for that one section of the whole burst detector is assumed to be located in its central part. For each air-shower particle with energy higher than 1 GeV (electrons, positrons and rays. Further interactions of pions and muons in the detector are neglected.) its cascade development in the detector is calculated analytically and then the number of cascade particles just below the lead and iron plates is obtained. The analytical formulae used here were made by modifying the well known cascade functions [22] and the parameters involved in the formulae were adjusted by using the data from a set of Monte Carlo events generated by EPICS. Fluctuations of the number of cascade particles are adequately taken into account. Air-shower cores enter at various positions of the burst detector and then charged particles passing through the scintillator emit photons. Photons are assumed to attenuate in the scintillator as , where is the distance between the shower hit position and one of the four PDs (see Appendix). In this detector simulation, these are taken into account to get an ADC signal from each photodiode. A size and its hit position of burst event in each detector are then estimated with the same procedure as the experiment. Because of the saturation of ADC outputs, the detectable size per burst detector is limited to be smaller than about .
C Background treatment
As shown in the previous section, there exist some noises in the data, so their effects must be carefully taken into account. We also found that for the experimental data it is difficult to subtract the background in the TOP section in a correct way. Then an opposite approach is adopted here. That is, in order to compensate the effects from the background we added the experimental background to the simulation samples as follows: for any one of the simulated events, a background event is randomly taken from the experimental background data set that contains about events, and then this background event is added to the simulated event at their corresponding positions of the noise detectors.
IV RESULTS AND DISCUSSIONS
A Event selection
For a further analysis, we selected the events from both the experimental data set and the Monte Carlo data set by imposing the following criteria (for convenience hereafter we call it “criteria-A”) : (1) Zenith angle ; (2) burst size of the TOP detector, ; (3) burst size of any non-TOP detector, ; and (4) number of fired detectors, .
By this selection 1046 events are obtained from the experimental data set. The time interval between two neighboring events is examined and an exponential-type distribution is confirmed, indicating a good randomness of this data sample. The effective running time of this sample is estimated to be 7.54 s. Also, as we adopt only the burst events which are coincident with the air-shower events recorded by the Tibet-II array, a dead time of 12 % for data taking of the array must be taken into account. Hence, when we discuss the flux of the burst events, we should use 1172 ( = 1046 1.12) as the number of burst events satisfying criteria-A.
For the simulations, as mentioned above, we generated air-shower events using different primary assumptions for which the primary particles were sampled from the same all-particle spectrum starting from 500 TeV. 14810, 9143, 8463 and 10591 events satisfying criteria-A were obtained by the composition assumptions of pure protons, PD, HD, and pure irons, respectively, which are about 8 - 14 times larger than the experimental data set. Figure 6 shows the energy distributions of the primary particles responsible for generating the samples of selected burst events for these four assumptions. It is seen that the mode energy of primary protons capable of generating the selected burst events is about 2500 TeV, while about 5000 TeV for irons. Therefore, the burst event samples satisfying criteria-A can easily manifest the behavior of primary particles in the knee region.
B Flux of the burst events
We first discuss the primary composition from the point of the intensity of the burst events satisfying criteria-A.
Using the all-particle spectrum obtained by the Tibet air-shower experiment, the number of primary particles with energies above 1016 eV and with zenith angles less than 45∘, which fall within the effective burst-detector area of 2 294 m2 (corresponding to the effective area of two separated rooms) during the running time of s, is calculated to be 1105. From the simulations, on the other hand, the efficiencies of the primary particles with energy in excess of 1016 eV to generate the burst events satisfying criteria-A are calculated to be 0.33, 0.32, 0.31, and 0.30 for the primary models of pure protons, PD, HD, and pure irons, respectively. Thus, among the 1105 incidences with energies higher than eV, 365, 354, 343, and 332 events satisfying criteria-A should be observed for four primary composition models, respectively.
The simulation study also tells us that when the composition models of pure protons, PD, HD, and pure irons are assumed, the fractions of the selected burst events induced by the primaries with energies above eV to the total selected burst events are calculated to be 0.11, 0.16, 0.25, and 0.39, respectively. Accordingly the total selected events expected to be observed are 3438, 2245, 1391 and 845 events, respectively. These values should be compared with 1,172 events which are truly observed with the experiment. The ratios of the Monte Carlo expectation to the observation are 2.9, 1.9, 1.2 and 0.7 for the four primary models, respectively. One can see that the HD model is consistent with the experiment, that is, the primary composition around the knee is required to be heavily enriched.
In the following, all the simulation results are normalized to the experimental one to discuss the behavior of the burst events. Therefore, all the distributions are given in the ordinate with “number of events” that may just correspond to the amount of our experimental exposure which is directly related to the absolute intensity. The error bars of the data in the following figures are statistical ones.
Shown in Figs. 7 and 8 are the total burst size distribution, where the summation is done over all fired detectors satisfying criteria-A for each event, and its accompanying air-shower size distribution, respectively. A steep slope of the burst size spectrum at their large size region is attributed to the saturation effect of ADC outputs from the PDs which are not included in the simulation. Disregarding a well-ground discrepancy at their large size region, it is well seen that the intensity of the total burst size spectrum, i.e. the measured total electromagnetic component of the air-shower cores in the knee region, is compatible with the prediction of HD, while it is a factor of 2 lower than that of PD. A similar situation is also seen in the air-shower size spectrum.
Figure 9 shows the the ratio of to . It is seen that this ratio is sensitive to the primary composition at the region of the ratio and the data are consistent with the HD model. According to the Monte Carlo simulation, there is a tendency for the events with larger and smaller to be mostly induced by protons and helium nuclei. Incidentally, it may be said that although the data are seemingly consistent with the HD model, the saturation effect of the burst size determination (this is not taken into the simulation) and the to-be-improved air-shower size fit seen in Fig. 7 and Fig. 8 may cause some deviation from the HD model. We confirmed, however, that even if such corrections are made the result does not change much.
C Lateral spreads of the burst events
Figure 10 shows the distribution of of each burst, where is the the distance (in meters) between the TOP detector’s position and the other detector’s position, and the summation is over the whole fired detectors in each event. A double peak seen in the distribution is due to an oblong arrangement of the burst detector units with a regular spacing as shown in Fig. 1. It is seen that the proton-induced events make more sharp distribution than heavier nuclei. The experimental data are also consistent with the HD model.
To examine the sensitivity of the lateral spread of air-shower cores to the composition, we made the distributions of the value for the experimental and simulated data as shown in Fig. 11, where , the averaged burst size for one event, is divided by , the averaged lateral distance between the fired detector and the TOP detector for the same event, and the distribution is made over all selected burst events. The distributions of the lateral gradient of burst size defined as for each burst of all events are also presented in Figure 12. Both distributions seem to be more sensitive than others to the composition. In both cases the HD composition model can explain the experiment well.
The number of fired burst detectors also depends on the lateral spread of their air-shower core. In criteria-A at least four detectors are required to be fired and the average number ranges from 5.3 to 6.6. The distribution is shown in Fig. 13 and is also consistent with that of the HD model as discussed above.
D Systematic uncertainties
We briefly discuss the systematic errors of our results. The largest one is from the uncertainty of the total primary flux. We used the all particle spectrum measured by the Tibet air-shower experiment, and the systematic errors of this result are estimated to be 20%-30% for absolute intensity. The other may come from the Monte Carlo code we used. In this study, we used the CORSIKA-QGSJET code. While CORSIKA-QGSJET uses a quark-gluon string phenomenology to describe the hadron-nucleus and nucleus-nucleus interactions, COSMOS is another code using a different physics picture ( a Lund string model in the lower energy region, but a quasi-scaling assumption in the higher energy region) for the hadronic and nuclear interactions. It is confirmed that an air-shower simulation using COSMOS+HD and a detector response calculation using EPICS give almost completely the same results as CORSIKA+HD. We compare the distributions of the total burst size and the total lateral distance, those obtained by using both codes, in Figs. 14 and 15, respectively. It is seen that two simulation codes give almost the same results for both distributions. Hence, the results discussed above do not depend on the Monte Carlo code we used.
V SUMMARY
We carried out a hybrid experiment, consisting of the burst detector and emulsion chamber array and the Tibet-II air shower array, at Yangbajing (4300 m above sea level) in Tibet during the period from 1996 through 1999. From this experiment, we observed more than 1000 burst events (high-energy air-shower cores) accompanying air showers with energies at the knee region. Using this data set, we studied the cosmic ray composition at the knee energy region in comparison with extensive Monte Carlo data. All the behavior of the observed burst events are shown to be compatible with the heavily enriched primary composition at the knee. This result suggests that the mean mass number of the primary particles around 1016 eV is close to silicon or medium nuclei when the composition shown in Fig. 5(top) is assumed. If we combine this with the proton spectrum observed with the same experiment [23], the cosmic composition at the knee region may be in favor of shock acceleration at supernova remnants, suggesting a break of the proton spectrum at energies around 100 TeV.
We are planning to set up a large-scale burst array, consisting of 20 20 scintillation counters of 0.20 m2 each (50 cm 40 cm) which are placed at a 12 m grid, near the center of the Tibet air shower array. A 5 cm lead plate may be put on the top of each scintillator to detect the burst events accompanying air showers. By operating this new burst array for 1 yr, we may observe about 2500 proton-induced events and about 700 iron-induced evens whose primary energies are in the knee region. A Monte Carlo study shows that such burst array can provide information about each component of the primary cosmic rays at the knee with sufficient statistics. This experiment will start within a few years.
Acknowledgements.
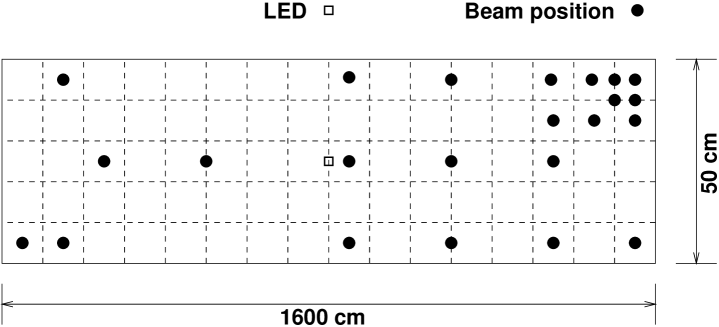
This work is supported in part by Grants-in-Aid for Scientific Research and also for International Science Research from the Ministry of Education, Science, Sports and Culture in Japan and the Committee of the Natural Science Foundation and the Academy of Sciences in China. The support of Japan Society for the Promotion of Science (L.K.D., X.W.X., and C.S.Z.) is also acknowledged. APPENDIXPERFORMANCE OF THE BURST DETECTOR USED IN THIS EXPERIMENT Each burst detector contains a plastic scintillator with the size of 160 cm 50 cm 2 cm. A PIN PD (HPK S2744-03) with an effective area of 2 cm 1 cm was equipped at each four corner of each scintillator, as shown in Fig. 16. To detect signals from a PD for burst particles ranging from 103 to 107, a preamplifier with an amplification factor of 260 operating in the frequency range from 17 kHz to 44 MHz (current-current type) was developed. An ADC value from each PD, depending on the size and the hit position of a burst (shower) fallen in the burst detector, can be expressed as , where is the distance between a PD and the burst position in the scintillator, is the burst size and is a constant. Using the ADC values from four corners, we can estimate the size and hit position for each burst event using a least-square method. In this formula, denotes the attenuation of photons in the scintillator. In general can be expressed as exp(-) except at small distance and takes a value around 350 cm for the present scintillator. Since the size of the burst detector is smaller than the attenuation length, errors of the burst hit position become very large. So first we slightly polished one face of each scintillator with rough sandpaper (No.60) to make photons scatter randomly on this face. Then we found that can be well approximated as and 1.1 - 1.2. This relation was confirmed by using a nitrogen gas laser and also cosmic ray muons. This dependence on the distance is sufficient to estimate the burst position in the detector. We also installed a calibration unit which consists of four blue light-emitting diodes (LEDs) each having a peak wave length of 450 nm. The LED unit is put on the center of each scintillator and is illuminated to transmit light through the scintillator to each PD at the corner uniformly, and then all the ADC’s are calibrated at every 10 min for actual run. This calibration system provides information about a relative change of ADC values, which may cause a large error for the estimation of burst hit positions and burst sizes. We examined the performance of the burst detector using electron beams of 1.0 GeV/c from the KEK-Tanashi Electron Synchrotron. The beam consisted of spills containing about 108 particles with a time spread of about 10 . In order to generate mimic burst events from these bunched beams, we randomly extracted part of the particles from the beam spills by adjusting a gate width of ADC to 1.2 . The number of electrons passing through a given gate width was estimated by the signals from a probe scintillator of 10 cm 10 cm placed upstream. Consequently, the electron beams, ranging from several to per pulse, were vertically exposed to 23 positions on the surface of the burst detector as shown in Fig. 17. Figure 18 shows the dependence of the ADC values on the distance , obtained with the electron beams, where is the distance between the beam hit position and PD. The result can be well fitted by a power law of , where the number of incident electrons measured by the probe scintillator was normalized to 105 particles. Using the ADC values from four PDs, the beam positions exposed on the face of the detector and its intensities (number of electrons) were estimated to compare with the true ones. The distribution of the difference between estimated and actual hit positions is shown in Fig. 19. We present scatter plots of the estimated and irradiated number of electrons in Fig. 20, and the distribution of the ratio between them is shown in Fig. 21. From these figures, it is concluded that the hit position of a burst in each detector can be estimated with an inaccuracy less than 10 cm and errors for the size estimation are smaller than 10 % for the bursts with size particles.
REFERENCES
- [1] P.O. Lagage and C.J. Cesarsky, Astron. and Astrophys., 118, 223 (1983)
- [2] T. Shibata, Proc. 24th Int. Cosmic-Ray Conf. (Rome), 19C, 713 (1995)
- [3] J.R. Jokipii and G. Morifill, Astrophys. J., 312, 170 (1987)
- [4] W.I. Axford, Astrophys. J., Suppl., 90, 937 (1994)
- [5] C. Fichtel and J. Linsley, Astrophys. J., 300, 474 (1986)
- [6] R.J. Protheroe and A.P. Szabo, Phys. Rev. Lett., 69, 2885 (1992)
- [7] K. Asakimori, et al., Astrophys. J., 502, 278 (1998)
- [8] A.V. Apanasenko et al., Proc. 26th Int. Cosmic Ray Conf. (Salt Lake City), 3, 163 (1999)
- [9] M. Amenomori et al., Astrophys. J., 461, 408 (1996)
- [10] M.A.K. Glasmacher et al., Astropart. Phys., 10, 291 (1999) ; 12, 1 (1999)
- [11] M. Agrietta et al., Astropart. Phys,, 9, 185 (1998)
- [12] S.M. Kasahara et al., Proc. 25th Int. Cosmic Ray Conf. (Durban), 4, 77 (1997)
- [13] L.F.Fortson, Proc. 26th Int. Cosmic Ray Conf. (Salt Lake City), 3, 125 (1999)
- [14] S.P. Swordy and D.B. Kieda, Astropart. Phys., 13, 137 (2000)
- [15] K.-H. Kampert et al., Proc. 26th Int. Cosmic Ray Conf. (Salt Lake City), 3, 159 (1999)
- [16] T. Yuda, Proc. Int. Symp. on Extremely High Energy Cosmic rays: Astrophysics and Future Observations, ed. M. Nagano (Inst. Cosmic Ray Res., Univ. Tokyo, 1996), 175
- [17] M. Amenomori et al., Phys. Rev. D47, 2675 (1993)
- [18] D. Heck et al., Report FZKA 6019, Forschungszentrum Karlsruhe (1998)
- [19] K. Kasahara, Proc. 24th Int. Cosmic Ray Conf. (Roma), 1, 399 (1995) ; http://eweb.b6.kanagawa-u.ac.jp/∼kasahara/ResearchHome/cosmosHome/index.html
- [20] C.S. Zhang, T. Yuda and K. Kasahara, Nucl. Instr. and Methods, 376, 263 (1996)
-
[21]
K. Kasahara,
http://eweb.b6.kanagawa-u.ac.jp/∼kasahara/ResearchHome/EPICSHome/index.html - [22] C.S. Zhang et al., Nucl. Instr. and Methods, A283, 78 (1989)
- [23] M. Amenomori et al., to be published