B3 0003387: AGN Marked Large-Scale Structure
at Redshift 1.47? 11affiliation: This paper uses data obtained at the WIYN Observatory,
a joint facility of the University of Wisconsin-Madison, Indiana University,
Yale University, and the National Optical Astronomy Observatories. 22affiliation: Based in part on observations obtained at the W. M. Keck
Observatory.
Abstract
We present evidence for a significant overdensity of red galaxies, as much as a factor of 14 over comparable field samples, in the field of the radio galaxy B3 0003387. The colors and luminosities of the brightest red galaxies are consistent with their being at . The radio galaxy and one of the red galaxies are separated by 5″ and show some evidence of a possible interaction. However, the red galaxies do not show any strong clustering around the radio galaxy nor around any of the brighter red galaxies. The data suggest that we are looking at a wall or sheet of galaxies, possibly associated with the radio galaxy at . Spectroscopic redshifts of these red galaxies will be necessary to confirm this large-scale structure.
1 Introduction
As the most massive collapsed objects in the universe, clusters provide a sensitive probe of the formation and evolution of structure in the universe. The presence of clusters or large-scale structure at and beyond can constrain scenarios for bottom-up structure formation and fundamental cosmological parameters like by requiring cluster-level collapse earlier than was previously thought possible. Study of the individual galaxies in high- clusters can also provide information on the cluster environment, merging and star formation history in the cluster galaxies, and samples of cluster ellipticals and spirals which could be compared with field galaxies at the same redshift.
A number of confirmed or suspected clusters are known at redshifts above one, with some candidates extending up to (see Postman (2000) for a recent review). These include clusters around or foreground to high- active galactic nuclei (Le Fevre et al., 1996; Malkan, Teplitz, & McLean, 1996; Dickinson, 1997; Hall & Green, 1998; Clements, 2000; Tanaka et al., 2000; Liu et al., 2000), a near-infrared selected cluster (Stanford et al., 1997), a cluster associated with correlated quasar absorption line systems (Francis et al., 1996), X-ray selected clusters (Rosati et al., 1999; Hasinger et al., 1998), Lyman break galaxies (Steidel et al., 1998), and a distant cluster which gravitationally lenses a background QSO (Benitez et al., 1999).
Identifying structures directly in visual wavelength data becomes increasingly difficult at . The fainter galaxies and strong cosmological K-corrections serve to reduce the contrast of the high- galaxies against the dense background of faint blue field galaxies at visual wavelengths. The contrast at near-infrared wavelengths, however, remains high even at because the K-corrections are lower and well-behaved.
In most high-redshift clusters, there is a clear concentration of the galaxies around what would be considered a classical cluster “core,” though Hall & Green (1998) find some evidence for overdensities of red objects lacking a central concentration in fields of radio-loud quasars. The structures found by Steidel et al. (1998) and Francis et al. (1996) are extended over large regions of sky. These fields may actually be sampling sheets or filaments of galaxies associated with large-scale structure, or perhaps a protocluster seen in a dynamically young state, before any significant virialization has occurred.
In this paper we present optical and near-infrared observations of a high redshift radio galaxy field, covering a total area of 44.3 sq. arcmin, where an overdensity of red galaxies suggests the presence of some large-scale structure, perhaps a wall or sheet of galaxies rather than a collapsed cluster.
2 Observations and Reductions
B3 0003387 is a 1.36 Jy radio source at 408 MHz in the Third Bologna Survey (Ficarra, Grueff, & Tomassetti, 1985). The source is unresolved with 15″ resolution at 1.4 GHz (Vigotti et al., 1989). An optical spectrum obtained by Djorgovski et al. (priv. comm.) indicates a redshift of 1.47, with strong emission lines typical for powerful radio galaxies. Preliminary images at optical and near-infrared wavelengths of the B3 0003387 field identified a number of very red galaxies near the radio source, possibly indicating the presence of a high redshift cluster, and prompting the deeper observations presented in this paper. All reductions were performed using standard IRAF111IRAF is distributed by the National Optical Astronomy Observatories, which are operated by the Association of Universities for Research in Astronomy, Inc., under cooperative agreement with the National Science Foundation. (Tody, 1993) commands.
2.1 -Band Imaging
The data were obtained on UT 1997 June 20 using the Omega-Prime camera (Bizenberger et al., 1998) at the Calar Alto 3.5 m telescope in Spain. Omega-Prime is a direct imaging camera with no cold pupil stop, imaging onto a HAWAII 10242 HgCdTe array. The image scale is 0396/pixel, giving an unvignetted field of view 675 square. We obtained 58 images in a random offset pattern designed to maximize the pointing separation between temporally adjacent images. Each image was the sum of ten 3-second integrations, giving a total exposure time of 29 minutes.
We reduced the data using IRAF and a double-pass reduction algorithm. After a first pass of sky-subtraction and flatfielding, residual gradients in the background were removed in the second pass using object masks to explicitly ignore pixels covered by known objects and bad pixels. The reduced images were resampled to 20482 pixels prior to integer pixel offsets and stacking, giving a final pixel scale very close to that of the WIYN data (0198 vs. 0195).
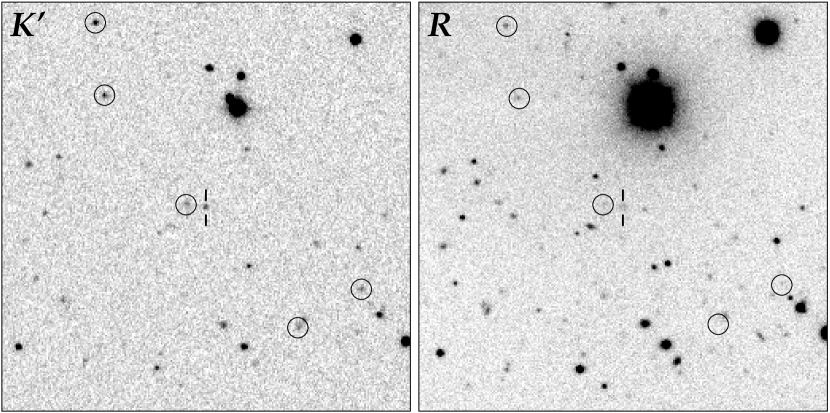
The data were calibrated onto the Vega scale using several stars from the UKIRT faint standards list (Casali & Hawarden, 1992). The night was not strictly photometric, but internal consistency of the standard star measurements indicate that the systematic uncertainty in the calibration is below 10%. The final image has a full-width at half-maximum (FWHM) of 11, and a 5-sigma point source detection limit within an aperture diameter equal to twice the seeing (22) of . A two arcminute square subsection of the image, centered on the radio galaxy, is shown in the left panel of Figure 1.
2.2 -Band Imaging
Deep -band data of the B3 0003387 field were obtained through service observing with the CCD imager at the 3.5m WIYN telescope on UT 1997 August 01 and UT 1997 August 05 in non-photometric but good seeing conditions. The imager uses a 20482 pixel CCD with an effective plate scale of 0195 per 21 µm pixel, giving a 666 square field of view which is well matched to the near-infrared image. The data were taken through a Harris filter, which has a central wavelength of 646 nm and a FWHM of 153 nm. A series of short exposures of the B3 0003387 field and the Landolt (1992) standard fields SA92, SA110-L1 and Mark A were later obtained with the same instrument under nearly photometric conditions on UT 1997 October 12 for calibration.
Standard CCD processing was used to remove the bias and flatfield each image. Because the eight deep images were obtained on two different nights and under varying conditions, the signal-to-noise ratio (SNR) varies slightly from image to image. We normalized the object photometry across all images, then derived weights proportional to the variance in the rescaled sky background. These eight rescaled images were then combined with variance weighting, using cosmic ray and bad pixel masks.
The calibration of the deep image was transferred from the shallower data taken on a nearly photometric night. The standards indicate a stable night with 017 magnitudes of extinction over that expected under truly photometric conditions. The final -band image has a FWHM of 08, and a 3-sigma point source detection limit within an aperture diameter equal to twice the seeing (16) of 25.58. A two arcminute square subsection of the image, centered on the radio galaxy, is shown in the right panel of Figure 1.
2.3 Keck -Band Imaging
A deeper broadband image of the area around the radio galaxy was obtained on UT 1997 August 20 using NIRC (Matthews & Soifer, 1994) on the Keck I telescope. NIRC reimages the infrared f/25 Keck focal plane onto a Indium Antimonide detector at 015 per pixel, for a 384 square field of view. We obtained a total of 29 1-minute integrations, most in a regular 3 3 pattern with 5″ spacing. Individual images consist of a sum of six 10-second exposures.
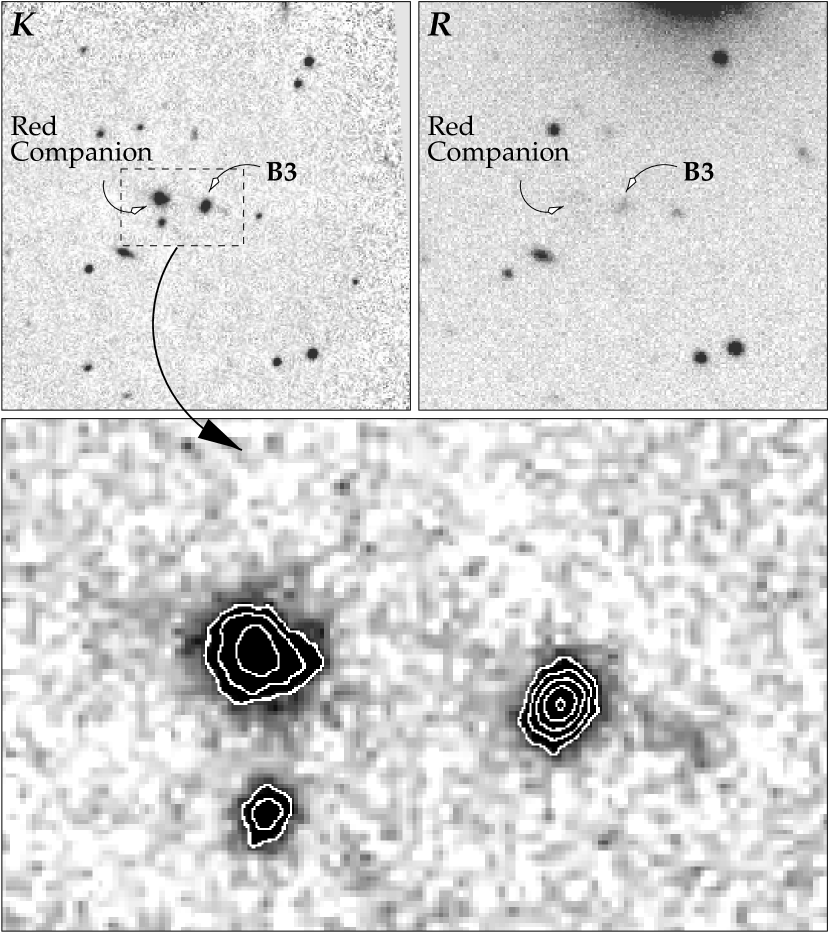
Images were first sky-subtracted with a median stack of six to eight dithered images in the same field, then flatfielded with a skyflat derived from the same data. The reduced images were combined with integer pixel offsets. The data were calibrated onto the Vega scale using the Persson et al. (1998) infrared standard stars. The night was relatively stable but not strictly photometric. We estimate the systematic uncertainty in the zero point is again below 10%. The -band image has a FWHM of 042, and a 5-sigma point-source detection limit in the deep central part of the image of . The -band image and corresponding area of the -band image are shown in Figure 2.
2.4 Astrometry
Hubble Space Telescope Guide Star Catalog (GSC222GSC: Produced at the Space Telescope Science Institute under U.S. Government grant.) stars around B3 0003387 were used to derive fainter secondary position standards on a Digitized Sky Survey333DSS: Made by the California Institute of Technology with grants from the National Geographic Society, and produced at the Space Telescope Science Institute. image of the field. The absolute uncertainties in the astrometric solutions are 03 in both the and images. Objects in the Keck -band image were matched to the and images by hand and were not fit with an astrometric solution.
The near-infrared object corresponding to B3 0003387 was found to be at 00h 06m 2071 39∘ 00′ 281 (J2000). This agrees () to well within the positional uncertainties from the VLA in C-configuration at 1.4 GHz (FWHM 15″), used for the B3VLA Survey (Vigotti et al., 1989). This is also the object for which Djorgovski et al. (priv. comm.) obtained the redshift. We therefore consider this identification of the radio galaxy secure.
2.5 Object Catalog
We created a catalog of all objects detected in the image, and used the APPHOT package in IRAF to extract the magnitudes within a 4″ diameter aperture. In a small number of cases, the photometry for close pairs or multiples was extracted by hand after subtracting out the contaminating objects. The APPHOT positions in the image were transformed into coordinates on the image using our astrometric solution, and the corresponding -band magnitudes extracted. Any -selected objects that were not detected in were assigned the three-sigma limit of . Because the image is much deeper than the image, there are large numbers of faint, relatively blue objects detected in the image which do not have a corresponding detection in the and therefore do not appear in the object catalog.
The final catalog (Table 1) contains the and centroids, magnitudes, uncertainties on the magnitudes (statistical only), and J2000 coordinates for all -selected objects covering an area of 44.3 square arcminutes, or 1.23 square degrees. There are 421 objects in the catalog, although 4 were deleted because of unrecoverable contamination in the image. The catalog and survey images are available through the electronic version of the Astronomical Journal.
3 Discussion
In the absence of spectroscopic redshifts for these red galaxies, we must rely on the imaging and photometry in hand to determine if there is a cluster or some sort of large-scale structure present in this field. Specifically, we address the overdensity of red objects in the field relative to a field sample, the spatial distribution of these red objects, and what their redshift might be.
We use the data from two widely-separated fields obtained as part of the Calar Alto Deep Imaging Survey (CADIS: see Meisenheimer et al. (1997) for a description of the survey) as a control sample for comparison to the B3 data. The CADIS fields were chosen to be “blank” fields at high galactic latitude, free of bright stars or galaxies, as well as known galaxy clusters and therefore should be representative of the field population of red objects. Each field is 3 times the area of our data, and the combined area covers 6.4 times the area of the B3 0003387 field. The CADIS and B3 infrared data were obtained with the same instrument. Both datasets use non-standard -band filters, but the differences are negligible and the two data sets are directly comparable. Thompson et al. (1999) presented initial results on the surface density of field extremely red galaxies from the CADIS data.
For the following discussion, we assume that all of the red objects in the radio galaxy field are galaxies. Most (75%) are resolved in the infrared image, but contamination of the sample by low mass stars, from late M dwarfs through L and T type brown dwarfs, is still possible. Our survey field has a relatively high galactic latitude () and only covers a volume of 1.25 pc3 to a distance of 100 pc. We expect much less than one low mass star within this volume, given recent determinations of their space density (Reid et al., 1999; Herbst et al, 1999).
3.1 An Excess of Red Galaxies
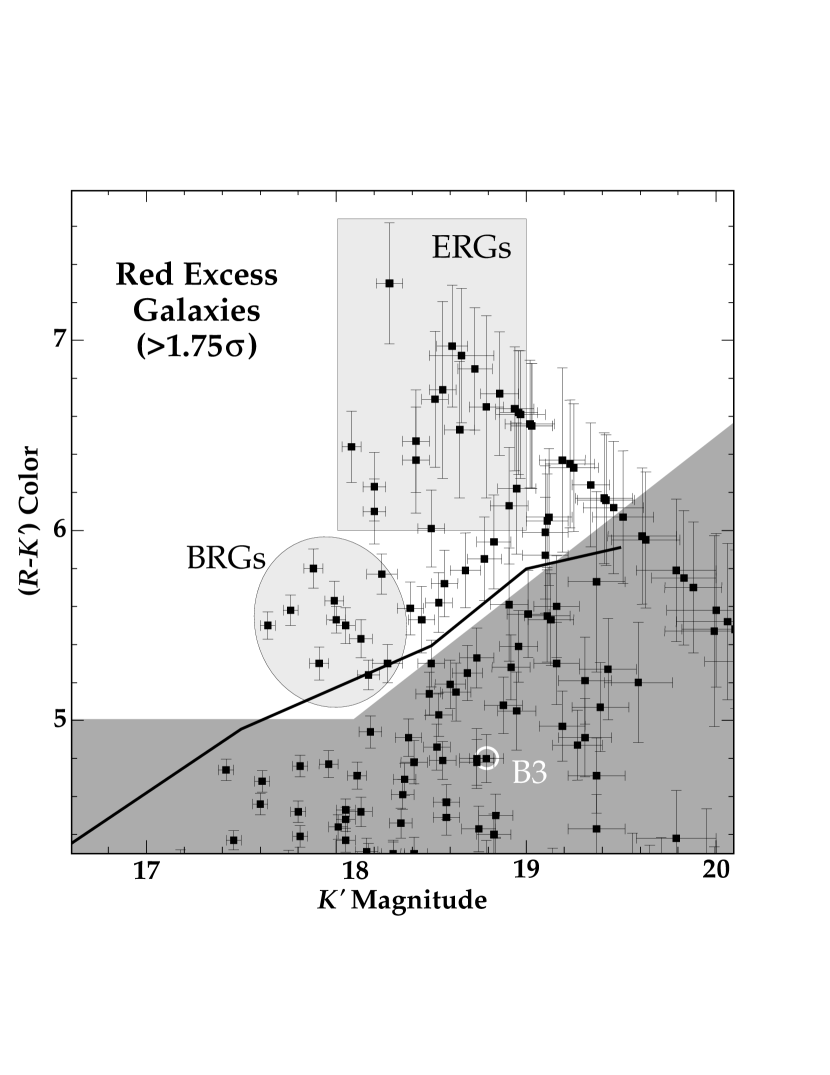
A color-magnitude diagram for the B3 0003387 field is shown in Figure 3. We also plot the median and distribution of colors from Thompson et al. (1999), derived from the CADIS data. Several features in Figure 3 are immediately obvious. First, there are a number of objects with blue colors () which span the full range of magnitudes. These are typically galactic subdwarf stars. Second, no objects brighter than appear redder than the line. However, this is consistent with purely statistical fluctuations, as only 4 objects would be expected to lie at in our sample of 108 with . Finally, there are a large number of objects with and redder than the line.
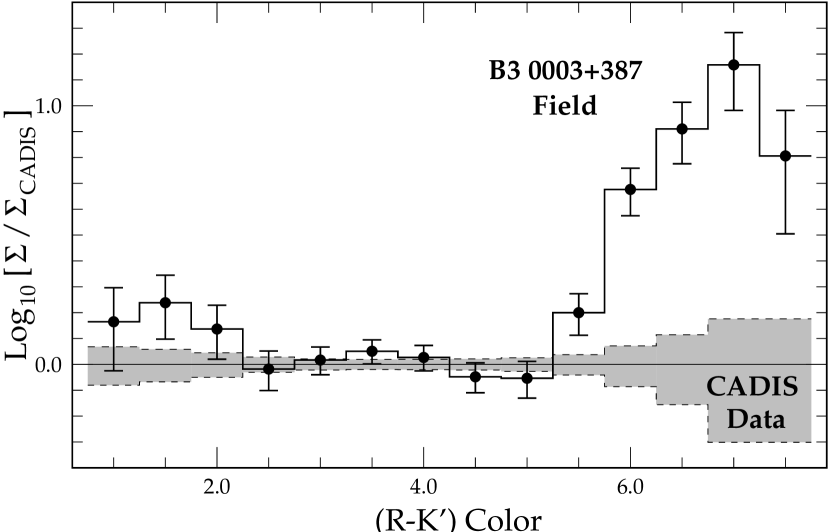
Is this excess of red galaxies in the B3 0003387 field significant? We compared the surface density of galaxies in the B3 field with the combined control fields from CADIS to determine the overdensity. We first selected galaxies from both sets of data in the magnitude range. This covers the relevant range for the red galaxies while avoiding problems with incompleteness at fainter magnitudes. We then sampled the data in 1 magnitude bins of color, spaced every half magnitude. Adjacent bins therefore are not statistically independent. We show in Figure 4 the logarithm of the surface density of galaxies in the two sets of data as a function of the () color, normalized by the CADIS data. The 1 uncertainties from Poisson counting statistics are also indicated.
While the surface densities in the two fields agree to within the uncertainties for () 5m, there is a significant excess of galaxies at redder colors. The most significant bin, with a 3.7 excess, is at () 6m (covering the range 55 () 65). The highest overdensity of red galaxies occurs at () 7m. Combining the overdensities in statistically independent bins shows a excess for () 55. This suggests that this B3 field is not representative of the general field population, and that there is a large overdensity of red galaxies in this field.
This overdensity of red galaxies may indicate the presence of a high redshift cluster, but there is no clear red sequence (Bower, Lucey, & Ellis, 1992a, b) of cluster ellipticals visible in the color-magnitude diagram (Figure 3). We next consider the spatial distribution of these red galaxies in the B3 field.
3.2 Red Galaxy Spatial Distribution
Our survey field covers 646 686. For an Einstein-de Sitter Universe (, ; with km s-1 Mpc-1) at the redshift of the radio galaxy, this translates to field of 1.66 Mpc 1.76 Mpc, considerably larger than a typical galaxy cluster core. If an evolved, relaxed cluster were in our field, we would expect to see a significant concentration of galaxies around the cluster core.
For purposes of the discussion in this section, it is useful to divide up the group of red galaxies into three subsets: the brightest red galaxies, the extremely red objects, and the red excess galaxies. We show these subsets graphically in Figure 5, which reproduces the faint red end of the color-magnitude diagram (Figure 3) in greater detail.
The brightest red galaxies (BRGs) subset consists of the 11 galaxies with 17.5 18.3 and 52 () 58 in the B3 0003387 field. Eight of these are resolved in the infrared image. Such a group of objects with similar magnitudes and colors suggests that they may have a similar evolutionary history, possibly associated in a cluster. In addition, their redder than normal colors imply that these BRGs are likely to be at high redshift.
The extremely red galaxies (ERGs) subset includes 20 galaxies with () 60 and , adopting the definition from Thompson et al. (1999). Fifteen of these ERGs are resolved. The B3 0003387 field covers 44.3 square arcminutes of sky, giving a local surface density for the ERGs of arcmin-2, a factor of 12 higher than that found in the CADIS data (Thompson et al., 1999).
The red excess galaxies (REGs) subset is defined as the galaxies with an () color greater than , where the mean color and uncertainty are taken from Thompson et al. (1999). This sample includes both the BRG and ERG subsets. For ease of use, we approximate the limit with the relation: () 0.735 K′ 8.23 for , and () 5 for .
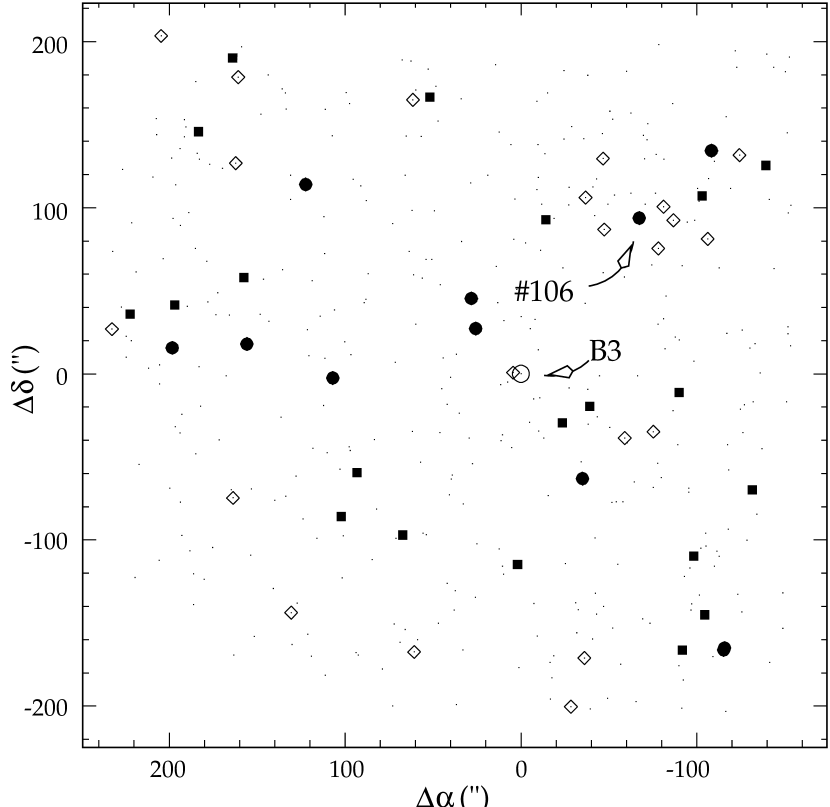
The spatial distribution of these subsets is shown in Figure 6, where we plot the positions of all objects in the B3 0003387 field, highlighting the three subsets defined above. What is immediately obvious in this plot is that there is no strong concentration of red galaxies around B3 0003387. This is in marked contrast to other high redshift clusters studied in the near infrared (Stanford et al., 1997; Rosati et al., 1999). We note that the infrared data around those clusters is considerably deeper (15 – 20) than here and thus would be able to select cluster galaxies significantly further down the luminosity function. Our data do not provide evidence that B3 0003387 lies in the core of a high-redshift cluster.
There is a possible concentration of red excess galaxies around one of the BRGs, catalog number 106, located to the northwest of the radio galaxy. This galaxy, with and () 524, is not exceptional in our sample: it is the bluest and one of the fainter galaxies in the BRG subset. There are eight objects from the REG subset, one of which is an ERG, within a circular aperture of 45′′ radius. This is a factor of 3 less than in the Stanford et al. (1997) and Rosati et al. (1999) clusters, assuming all of the red excess galaxies are associated.
In order to place more quantitative limits on the concentration of galaxies around any galaxies in our field, we investigated the radial surface density distribution of red galaxies with respect to various reference objects (BRGs and ERGs). In no case was there a statistically significant overdensity. Figure 7 shows the relative radial surface density of the red excess galaxies around B3 0003387 and galaxy #106. In both cases, the data are normalized to unity at a radius of two arcminutes. The distribution of red excess galaxies around B3 0003387 is completely consistent with the bluer field galaxies selected in the same magnitude range. While galaxy #106 does show an overdensity of a factor of six to eight, it is not statistically significant (less than 2). Note that both galaxies have other galaxies nearby which skew the results at small radii, but they remain consistent with a uniform surface density to within the uncertainties.
3.3 What is the Redshift?
While there is a significant excess of red galaxies in this field, their distribution on the sky does not support the interpretation that there is a cluster in the B3 0003387 field. The data are consistent with our looking through a wall or sheet of galaxies. The obvious question is whether this structure is associated with the radio galaxy, or merely a line-of-sight superposition?
A single color () is not sufficient for more sophisticated photometric redshift fitting, which normally requires photometry though three or more filters. However, even passively-evolving elliptical galaxy colors do not become particularly red until the normally strong 4000Å break is redshifted through the filter, which occurs at for the Harris filter used in this study. Colors as red as () 52, corresponding to the bluest of our red excess galaxies, are difficult to explain unless the galaxies are at . The characteristics of the filters used in this project, and the resulting very red colors of the galaxies allow us to place a lower limit of on their redshift.
We note that it is also possible to produce such red colors in a strong starburst at lower redshift, , assuming heavy extinction from dust. However, the high surface density of red galaxies in this field would be very unusual, given the relatively low fraction of starbursts found in ERGs (Cimatti et al., 1999).
Assuming the red excess galaxies are associated at a common redshift in some sort of wall or sheet structure, the luminosities of the brightest of our red excess galaxies can also place constraints on the redshift. We compare the brightest of our BRG subset, at , to the “brightest cluster member” galaxies seen in other high-redshift clusters. These brightest cluster members follow a tight correlation in the -band Hubble diagram (Collins & Mann, 1998; Aragón-Salamanca, Baugh, & Kauffmann, 1998) up to at least a redshift of one. Comparing our data to other high-redshift clusters (Table B3 0003387: AGN Marked Large-Scale Structure at Redshift 1.47? 11affiliation: This paper uses data obtained at the WIYN Observatory, a joint facility of the University of Wisconsin-Madison, Indiana University, Yale University, and the National Optical Astronomy Observatories. 22affiliation: Based in part on observations obtained at the W. M. Keck Observatory.) shows that we are at least consistent with the interpretation, and there is sufficient scatter in the magnitudes that our red excess galaxies could indeed be at .
The origin of the activity in the central engines of radio galaxies can often be traced to recent or ongoing mergers. We note that there is a bright and very red galaxy, with and () 580 about 5 arcseconds ( kpc) east of B3 0003387. In the -band image from Keck (Figure 2), this galaxy shows an asymmetric morphology, visible in the contours, with a spur or elongation in the direction of the radio galaxy. There are additional faint features to the west of the radio galaxy and east of the red galaxy, roughly aligned with the axis between the two galaxies, which may be the visible remnants of tidal tails created by gravitational interaction. However, these features are very faint and may be attributable to image noise or superposition of another object along the line of sight to the radio galaxy. If this interaction is real, then this also supports the interpretation that the red galaxies in the B3 0003387 field lie at , the redshift of the radio galaxy.
4 Summary
We have identified a significant overdensity of red galaxies in an extended field (44.3 square arcmin) around the radio galaxy B3 0003387. This overdensity is as much as a factor of 14 higher than seen in equivalent blank-field surveys. The spatial distribution of the galaxies is not consistent with their being associated in an evolved cluster centered on the radio galaxy, although we believe the evidence does strongly suggest that we are looking through a sheet or wall of galaxies associated with some extended Large-Scale Structure. The red colors of these galaxies are difficult to explain without the large cosmological K-corrections that would come with their being at high redshift (). The presence of a powerful, high-redshift radio galaxy in the field, as well as its possible interaction with one of the red galaxies, suggest that this structure may lie at the same redshift as the radio source: .
It will be important to verify the reality of this high-redshift structure by obtaining spectroscopic redshifts for some fraction of the red galaxies in this field. The brightest of the red excess galaxies are bright enough at visual wavelengths ( 23-24m) to make spectroscopic followup possible with 8–10 m-class telescopes. In order to facilitate this followup, as well as further study of this field, we are making our full dataset available through the electronic version of the Astronomical Journal.
References
- Aragón-Salamanca et al. (1993) Aragón-Salamanca, A., Ellis, R. S., Couch, W. J., & Carter, D. 1993, MNRAS, 262, 764
- Aragón-Salamanca, Baugh, & Kauffmann (1998) Aragón-Salamanca, A., Baugh, C. M., & Kauffmann, G. 1998, MNRAS, 297, 427
- Benitez et al. (1999) Benitez, N., Broadhurst, T., Rosati, P., Courbin, F., Squires, G., Lidman, C., & Magain, P. 1999, ApJ, 527, 31
- Bizenberger et al. (1998) Bizenberger, P., McCaughrean, M., Birk, C., Thompson, D., & Storz, C. 1998, in Astronomical Telescopes and Instrumentation, SPIE conference proceedings, vol. 3354, 825
- Bower, Lucey, & Ellis (1992a) Bower, R. G., Lucey, J. R., & Ellis, R. S. 1992a, MNRAS, 254, 589
- Bower, Lucey, & Ellis (1992b) Bower, R. G., Lucey, J. R., & Ellis, R. S. 1992b, MNRAS, 254, 601
- Casali & Hawarden (1992) Casali, M. M. & Hawarden, T 1992, in JCMT UKIRT Newsletter, 4, 33
- Cimatti et al. (1999) Cimatti, A., Daddi, E., di Serego Alighieri, S., Pozzetti, L., Mannucci, F., Renzini, A., Oliva, E., Zamorani, G., Andreani, P. & Röttgering, H. J. A. 1999, A&A, 352, 45
- Clements (2000) Clements, D. L. 2000, MNRAS, 312, L61
- Collins & Mann (1998) Collins, C. A. & Mann, R. G. 1998, MNRAS, 297, 128
- Dickinson (1997) Dickinson, M. 1997, in HST and the High Redshift Universe, eds. N. Tanvir, A. Aragón-Salamanca, & J. V. Wall, (World Scientific:Singapore), 207
- Djorgovski et al. (priv. comm.) Djorgovski, S. et al., unpublished
- Ficarra, Grueff, & Tomassetti (1985) Ficarra, A., Grueff, G. & Tomassetti, G. 1985, A&AS, 59, 255
- Francis et al. (1996) Francis, P., Woodgate, B., Warren, S., Moller, P., Mazzolini, M., Bunker, A., Lowenthal, J., Williams, T., Minezaki, T., Kobayashi, Y. & Yoshii, Y. 1996, ApJ, 457, 490
- Hall & Green (1998) Hall, P. B. & Green, R. F. 1998, ApJ, 507, 558
- Hasinger et al. (1998) Hasinger, G., Giacconi, R., Gunn, J. E., Lehmann, I., Schmidt, M., Schneider, D. P., Truemper, J., Wambsganss, J., Woods, D., & Zamorani, G. 1998, A&A, 340, L27
- Herbst et al (1999) Herbst, T. M., Thompson, D., Fockenbrock, R., Rix, H.-W., & Beckwith, S. V. W. 1999, ApJ, 526, 17
- Landolt (1992) Landolt, A. 1992, AJ, 104, 340
- Le Fevre et al. (1996) Le Fevre, O., Deltorn, J. M., Crampton, D., & Dickinson, M. 1996, ApJ, 471, 11
- Liu et al. (2000) Liu, M. C., Dey, A., Graham, J. R., Bundy, K. A., Steidel, C. C., Adelberger, K., & Dickinson, M. E. 2000, AJ, in press (astro-ph 0002443)
- Malkan, Teplitz, & McLean (1996) Malkan, M. A.; Teplitz, H.; McLean, I. S. 1996, ApJ, 468, L9
- Matthews & Soifer (1994) Matthews, K. & Soifer, B.T. 1994, in Experimental Astronomy, 3, 77
- Meisenheimer et al. (1997) Meisenheimer, et al. 1997, in The Early Universe with the VLT, ed. J. Bergeron (Springer:Heidelberg), 165
- Persson et al. (1998) Persson, S. E., Murphy, D. E., Krzeminski, W., Roth, M. & Rieke, M. J. 1998, AJ, 116, 2745
- Postman (2000) Postman, M. 2000, in Clustering at High Redshift, eds. A. Mazure, O. Le Fevre, & V. Lebrun, (ASP:San Francisco) ASP Conference Series, 200, in press, also astro-ph/9910473
- Reid et al. (1999) Reid, I. N., Kirkpatrick, J. D., Liebert, J., Burrows, A., Gizis, J. E., Burgasser, A., Dahn, C. C., Monet, D., Cutri, R., Beichman, C. A., & Skrutskie, M. 1999, ApJ, 521, 613
- Rosati et al. (1999) Rosati, P., Stanford, S. A., Eisenhardt, P. R., Elston, R., Spinrad, H., Stern, D., & Dey, A. 1999, AJ, 118, 76
- Stanford et al. (1997) Stanford, S. A., Elston, R., Eisenhardt, P. R., Spinrad, H., Stern, D., & Dey, A. 1997, AJ, 114, 2232
- Steidel et al. (1998) Steidel, C. C., Adelberger, K. L., Dickinson, M., Giavalisco, M., Pettini, M., & Kellogg, M. 1998, ApJ, 492, 428
- Tanaka et al. (2000) Tanaka, I., Yamada, T., Aragón-Salamanca, A., Kodama, T., Miyaji, T., Ohta, K., & Arimoto, N. 2000, ApJ, 528, 123
- Thompson et al. (1999) Thompson, D., Beckwith S. V. W., Fockenbrock, R., Fried, J., Hippelein, H., Huang J.-S., von Kuhlmann, B., Leinert, Ch., Meisenheimer, K., Phleps, S., Röser, H.-J., Thommes, E. & Wolf, C. 1999, ApJ, 523, 100
- Tody (1993) Tody, D. 1993, in Astronomical Data Analysis Software and Systems II, eds. R.J. Hanisch, R. J. V. Brissenden, & J. Barnes, A.S.P. Conference Series, 52, 173
- Vigotti et al. (1989) Vigotti, M., Grueff, G., Perley, R., Clark, B. G., & Bridle, A. H. 1989, AJ, 98, 419


| x | y | xR | yR | # | ||||||
|---|---|---|---|---|---|---|---|---|---|---|
| 2005.0 | 1775.7 | 15.97 | 0.03 | 2132.5 | 1663.5 | 18.63 | 0.03 | 00 06 07.55 | 39 02 09.6 | 1 |
| 1997.2 | 1348.7 | 19.51 | 0.14 | 2140.1 | 1234.6 | 22.12 | 0.05 | 00 06 07.56 | 39 00 44.9 | 2 |
| 2008.1 | 2226.3 | 18.93 | 0.10 | 2119.4 | 2115.8 | 22.03 | 0.04 | 00 06 07.62 | 39 03 38.9 | 3 |
| 1998.3 | 1751.7 | 18.91 | 0.10 | 2126.7 | 1639.2 | 24.52 | 0.28 | 00 06 07.66 | 39 02 04.8 | 4 |
| 1990.5 | 1385.5 | 19.13 | 0.12 | 2132.1 | 1271.3 | 21.83 | 0.04 | 00 06 07.68 | 39 00 52.2 | 5 |
| Cluster ID | Ref | ||
|---|---|---|---|
| B3 0003387 | 1.47? | 17.7 | 1 |
| ClG J08484453 | 1.27 | 18.1 | 2 |
| RXJ0848.94452 | 1.26 | 16.7 | 3 |
| AXJ2019112 | 1.01 | 17.1 | 4 |
| Cl 16034329 | 0.92 | 17.6 | 5 |
| Cl 16034313 | 0.89 | 17.0 | 5 |