An excess of very bright stars in the inner bulge
Abstract
From an analysis of the stars remaining in central regions of the Galaxy after subtracting those belonging to the disc and the bulge, we deduce that the inner bulge must have an extra young population with respect the rest of the bulge. It is shown that there is a higher ratio of very bright stars in the central bulge than than there is in the outer bulge. This is interpreted as being an additional young component due to the presence of star formation regions near the Galactic Centre which is absent in the outer bulge.
keywords:
Galaxy: structure—infrared: stars—Galaxy: stellar content—stellar statistics1 Introduction
In previous papers (López-Corredoira et al. 1997b; López–Corredoira et al. 2000 (hereafter L00)) we have analysed the luminosity function and density distribution of the Galactic bulge by inverting -band star counts from the Two Micron Galactic Survey in a number of off-plane regions (). Assuming a non-variable luminosity function within the bulge, we derived the top end of the -band luminosity function and the stellar density function, whose morphology was fitted to triaxial ellipsoids. The luminosity function shows a sharp decrease brighter than when compared with that assumed for the disc population.
In this paper, we provide an analysis of the central plane regions, i.e. including , in order to show that the innermost regions of the bulge have different characteristics from those of the outer bulge. The study of the inner bulge cannot be carried out by means of inversion techniques because the extinction is very patchy there, and we cannot carry out an inversion of the whole available data of the bulge because the hypothesis of constant luminosity function, which is a good approach for the outer bulge, is not for the bulge as a whole.
2 TMGS data
-band star counts were obtained from the Two Micron Galactic Survey (TMGS, Garzón et al. 1993, 1996; Hammersley et al. 1999), which has covered more than 350 square degrees of sky and has detected some 700000 stars in or near the Galactic plane. The survey is made up of constant declination strips which cross the Galactic plane in the areas , and , . It is complete between the limits and , except for the regions near the Galactic centre where confusion reduced the faint limit by about half a magnitude (although the detection limit of the survey is fainter than 10 mag). The method described in López-Corredoira et al. (1997a) show that confusion has a negligible effect for magnitudes brighter than these limits. Figure 1 shows both the corrected and uncorrected counts at , . As can be seen in the figure, the counts are nearly the same with or without correction. That confusion is not significant for the areas chosen can also be seen in the figures in Hammersley et al. (1999) when the TMGS counts are compared with a model. Taking into account that the correction is based on an extrapolation and the changes are minor when compared to the other sources of error, it is preferable to avoid any correction and use the original counts.
Overcrowding effects are not important here since the confusion is produced when two or more stars are placed in an area rather less than deg2 111The detector size of the TMGS is 15”. However, we can distinguish stars with separations less than that (see Garz n et al. 1993) in right ascension (around 4” or 5”) because we sweep the sky in this direction and the peaks of closer stars can be distinguished.. If we assume a Poissonian distribution in a field of density star/deg (the maximum observed density up to magnitude 8.5), the probability of observing two stars as one is less than (López-Corredoira et al. 1997a). Therefore, the artifacts of image crowding which generate possible excess of star counts (DePoy et al. 1993) cannot be responsible of the remnants to be studied along this paper. DePoy et al. (1993) are arguing that clustering of stars will increase this effect, however in López-Corredoira et al. (1998) we looked for clustering in the TMGS and found little in the bulge.

The constant central declination strip (, cutting the plane at ) with a width of (hence including the Galactic centre) within is used in this paper to provide information on the innermost region of the Galaxy.
![[Uncaptioned image]](/html/astro-ph/0007445/assets/x2.png)
Fig. 2 a)
![[Uncaptioned image]](/html/astro-ph/0007445/assets/x3.png)
Fig. 2 b)

Fig. 2 c)
2.1 Disc and bulge subtraction
In order to examine any remaining components in the inner Galaxy, first modelled disc and bulge stellar components are subtracted from the TMGS star counts.
The model of the disc, although coded by us, is based on the Wainscoat et al. (1992) SKY code. This model provides a good fit to the TMGS counts in the region where the disc dominates (Cohen 1994b; Hammersley et al. 1999; L00). The Wainscoat et al. (1992) model was revised by Cohen (1994a) but this does not significantly alter the form of the disc in the areas of interest here, and it is reasonable to expect that this disc model will adequately reflect the disc contribution along the lines of sight used in this paper.
A triaxial bulge is from the model by L00. This was obtained from the inversion of TMGS star counts after subtracting the disc in central off-plane regions. The model applies two approaches to the bulge: 1) the fitting of triaxial ellipsoids with constant axial ratios to the bulge and 2) the introduction of variable major–minor axial ratios to get a best fit to the off-plane regions. Here we use the variable axial ratio model, however either model fit leads to nearly the same qualitative result.
Extinction is included in the same manner as is Wainscoat et al. (1992) model. This assumes an exponential distribution of extinction with the same scale length as the old disc, kpc, and a scale height of 100 pc. The extinction is then normalized to give mag Kpc-1 in the solar neighbourhood. In fact, this model may lead to an overestimation of the extinction in the inner disc (Hammersley et al. 1999), but by comparing different regions it will be shown that this cannot be the cause of the excess of stars in the central bulge.
Figure 3 shows the residual counts after subtracting both the disc and bulge. The counts versus Galactic latitude present an “M”-shape, with centre on the plane. Furthermore, these counts are mostly between and . Figure 4 shows this for one region. Up to stars/deg2 are present in this range of magnitudes in the residuals, which amount to an important portion of the total number (including the disc and bulge), less than a thousand stars (see Fig. 2). The residuals up to 9th magnitude are relatively low, around 300 stars from a total of 6000, and is barely above the Poissonian noise. However, between magnitudes 5 and 7, the residuals are too excessive to be considered noise or errors in the bulge or disc subtraction.
![[Uncaptioned image]](/html/astro-ph/0007445/assets/x5.png)
Fig. 3 a)
![[Uncaptioned image]](/html/astro-ph/0007445/assets/x6.png)
Fig. 3 b)

Fig. 3 c)


2.2 An inner bulge and clouds
The “M”-shape is due to clouds near the Galactic centre (Hammersley et al. 1996, 1999) and this can be clearly seen in the original data (Fig. 2). The simple extinction model used here is not correct in the inner Galaxy including neither the fall of in extinction inside about 3 kpc nor the dust lanes near the Galactic Centre (Hammersley et al. 1999) and hence it clearly shows in the residual counts. The strip does not cut the plane exactly in the Galactic centre but at and this leads to an asymmetry between the peaks of the “M”, since the positions with negative Galactic latitudes are closer to the Galactic centre than those with positive latitudes.
The majority of the remnants are between magnitudes 5 and 7 and there are very few residual stars between magnitudes 7 and 9. In fact, most have a magnitude between 6 and 7 (Garzón et al. 1993). If these residual stars are at the same distance, this would imply that absolute magnitude range is only one or two magnitudes. A dispersion in distance and extinction would always increase the apparent magnitude range, so the range of absolute magnitudes must be limited to a width of one or two. A Galactic component cannot have such a restricted range of absolute magnitudes; hence, here only part of another component is being detected. The most probable reason for only detecting a couple of magnitudes of the LF of this feature is a contrast effect against the old bulge. L00 shows that the luminosity function of the outer bulge cuts on very strongly fainter than about 7 magnitude whereas brighter than this there are few stars. Fainter than about =7 the old bulge component will dominate every other component making up to 70% or the sources detected. Hence any error in the model for the old bulge leads to a huge error in any residual component fainter than =7. However, brighter than =7 there are few old bulge stars and if there were a component in the inner bulge extending to brighter magnitudes than the old bulge then it would be most clearly detected just brighter than =7.
The young component in the inner bulge is the best candidate to explain these residual stars.
The young disc (i.e. the spiral arms) cannot be responsible because the shape of the residual star count would be different, not an “M”-shape (Hammersley et al. 1999). Two hundred stars per square degree up to 7th magnitude (a third of the total number) is too high a count for the arms , and the “M”-shape suggests a remote distance for the sources, beyond the clouds and/or the dust lane. These stars are located around the Galactic centre, beyond the dust lane. In order to see this more clearly, Figure 6 shows the star counts with a higher resolution () in this region after subtracting both the model bulge and disc.
![[Uncaptioned image]](/html/astro-ph/0007445/assets/x10.png)
Figure 6 a)
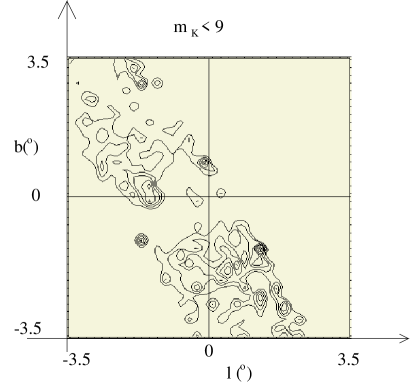
Figure 6 b)
In Fig. 6, both the dust lane and the increasing number of counts towards the centre, can be seen. The residual distribution is nearly concentric, although the patchiness of the extinction beaks up the regularity of the contours. This plot shows the excess of the “inner bulge” with respect the outer bulge. No accurate morphology of the inner bulge is obtainable because of this patchiness and the irregular distribution of young objects in this component. This irregularity is also due in part to the Poissonian error in the star counts in areas of 0.04 deg-2; however, this error disappears when the structure size is larger than the pixel area (if the excess is correlated with neighbouring pixels, it indicates that the excess is not random). Nevertheless, the shape can be distinguished: from a simple examination of Fig. 6 the inner bulge spreads over , and presumably has an ellipsoidal morphology.
An overestimation of the extinction in the Wainscoat et al. (1992) model would also lead to a remnant in the star counts after subtracting the bulge and disc. This effect can clearly be seen in the strip (see Figure 5) and is discussed in Hammersley et al (1999). However, unlike at the remnant is a narrow spike sitting on the plane and not a broad, ‘M‘ shaped, feature. Furthermore, the extinction would affect the whole range of magnitudes and not just those with apparent magnitudes between 6 and 7. This indicates that the origin for the residual counts near the GC cannot be extinction.
A young inner bulge population has already been noted with the same TMGS data but using a different technique by Calbet (1993) and Calbet et al. (1995). This population is revealed in an excess of very bright stars () with respect the rest of the bulge. A gradient of populations through the whole bulge was considered by L00 as one possibility to explain the gradient of the major-minor axial ratio, but this cannot even explain the total number of stars around the centre, as is shown in this paper; hence, a rather higher population gradient must exist in the transition region between the inner and the outer bulge (at around three degrees from the centre) than that in the L00 bulge model. Later publications have also found the young population with different data (see Blum et al. 1996a, 1996b; Narayanan et al. 1996; Frogel et al. 1999). The last-named authors have also pointed out its extension up to one degree away the Galactic centre, while the stars beyond one degree would be AGB stars associated with the old bulge population. However, we detect an excess of these kinds of stars up to 2 or possibly 3 degrees away from the Galactic centre, and these belong to the same young population.
If a depth for the inner bulge of kpc is assumed at a distance of kpc, then we deduce an average stellar density of star pc-3, a density which must be added together with the bulge and disc densities (around one to ten pc-3). Obviously, the increase in the total number of stars is negligible: the increase in mass is more conspicuous but also negligible. The only significant contribution is to the flux and the density of very bright stars.
2.3 Luminosity function
An estimate of the luminosity function (useful for qualitative comparison) may be obtained. Inversion methods for the stellar statistics equation, such as that applied in López–Corredoira et al. (1997b, L00), are useful for this purpose.
For each region centred on Galactic coordinates in the 0.2 degrees resolution plot of Fig. 6, where is the field number, the cumulative star counts, , towards the bulge expressed in rad-2, follows
| (1) |
where , is the normalized luminosity function ( ), is the density, and is the extinction in the line of sight. The disc and extinction models are taken from Wainscoat et al. (1992) model.
With the change of variables and we transform equation (1) for counts in the bulge into
| (2) |
which is a Fredholm equation of the first kind. When the luminosity function, , is the unknown, instead of , then we can make a new change of variable to obtain:
| (3) |
where is the unknown function and is the kernel of this new (first kind) Fredholm integral equation. The density, , of the bulge is taken from the model with variable major–minor axial ratio by L00 to give , and this integral equation is inverted for each position using Lucy’s statistical method (Lucy 1974; L00). Obtaining both the bulge density and luminosity function, as in López–Corredoira et al. (1997b, L00), is not appropriate here because the extinction and stellar distribution is too patchy in the plane to make stable inversions. The inversion of eq. (3) is more stable than the inversion of (2), allowing the luminosity function to be obtained, because the density distribution is sharply peaked and so the kernel in (3) behaves almost as a Dirac delta function: the shape of the density distribution does not significantly affect the shape of the luminosity function.
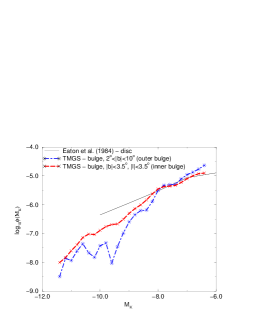
The average of the luminosity function for all the regions within the strip at , is shown in Fig. 7. The outcome is clear: an abundance of stars with between and is observed to be greater than that in the outer bulge, but less than the abundance in the disc (Eaton et al. 1984). An intermediate abundance between the young disc—with a high number of very bright giants and supergiants—and the old disc—with a deficit of these bright stars—is observed from the plot. The average includes all regions plotted in Fig. 6, including those within the clouds and/or dust lane area, so it is slightly underestimated. This suggests the existence of a star formation region in the centre (Lebofsky, Rieke & Tokemaga 1982), rich in supergiants and bright giants, which is anomalous to the rest of the bulge.
There are spikes with residuals an order of magnitude above the average; for instance, there are in Fig. 6 b), to 9th magnitude, some points with 1000 star deg-2—around ten times higher than the average (100 star deg-2). These spikes would have a luminosity function with very bright stars comparable with that of the disc, since there is nearly an order of magnitude between both the disc and inner bulge luminosity functions. The spikes in Fig. 6 are probably related to single star formation regions, although the patchiness of the extinction is a factor that can distort the shape of these areas.
3 Conclusions
It is shown that the inner bulge contains an important extra population of bright stars, between around and , which are not present in the external bulge. This is probably due to the existence of extra star formation near the Galactic Center but is not present in the rest of the bulge. Hence, in the same manner as there is a young and old disc, there appears to be a young inner bulge providing an extra contribution to the star counts near the Galactic centre.
Acknowledgments
We thank the anonymous referee for helpful comments that have improved the content and presentation of this paper.
References
- [\citeauthoryear] Bahcall J. N., Soneira R. M., 1980, ApJS 44, 73
- [\citeauthoryear] Blum R. D., Sellgren K., DePoy D. L., 1996a, ApJ 470, 864
- [\citeauthoryear] Blum R. D., Sellgren K., DePoy D. L., 1996b, AJ 112, 1988
- [\citeauthoryear] Calbet X., 1993, PhD thesis, Universidad de La Laguna
- [\citeauthoryear] Calbet X., Mahoney T., Garzón F., Hammersley P. L., 1995, MNRAS 276, 301
- [\citeauthoryear] Calbet X., Mahoney T., Hammersley P. L., Garzón F., López-Corredoira M., 1996, ApJ 457, L27
- [\citeauthoryear] Cohen M., 1994a, AJ 107(2), 582
- [\citeauthoryear] Cohen M., 1994b, Ap&SS 217(1), 181
- [\citeauthoryear] DePoy D. L., Terndrup D. M., Frogel J. A., Atwood B., Blum R., 1993, AJ 105, 2121
- [\citeauthoryear] Eaton N., Adams D. J, Giles A. B., 1984, MNRAS 208, 241
- [\citeauthoryear] Frogel J. A., Tiede G. P., Kuchinski L. E., 1999, AJ 117, 2296
- [\citeauthoryear] Garzón F., Hammersley P. L., Mahoney T., Calbet X., Selby M. J., Hepburn I. D., 1993, MNRAS, 264, 773
- [\citeauthoryear] Garzón F., Hammersley P. L., Calbet X., Mahoney T. J., López-Corredoira M., 1996, in: New Extragalactic Perspectives in the New South Africa, D. L. Block, J. Mayo Greenberg, eds., Kluwer, Dordrecht, p. 388
- [\citeauthoryear] Hammersley P. L., Cohen M., Garzón F., Mahoney T. J., López-Corredoira M., 1999, MNRAS 308, 333
- [\citeauthoryear] Hammersley P. L., Mahoney T., Garzón F., Calbet X., López-Corredoira M., 1996, in: New Extragalactic Perspectives in the New South Africa, D. L. Block, J. Mayo Greenberg, eds., Kluwer, Dordrecht, p. 534
- [\citeauthoryear] Lebofsky M. J., Rieke G. H., Tokemaga A. T., 1982, ApJ 263, 736
- [\citeauthoryear] López-Corredoira M., Garzón F., Mahoney T., Hammersley P., 1997a, in: The Impact of Large Scale Near-IR Sky Surveys, F. Garzón, N. Epchtein, A. Omont, B. Burton, P. Persi, eds., Kluwer, Dordrecht, p. 107
- [\citeauthoryear] López-Corredoira M., Garzón F., Hammersley P. L., Mahoney T. J., Calbet X., 1997b, MNRAS 292, L15
- [\citeauthoryear] López-Corredoira M., Garzón F., Hammersley P. L., Mahoney T. J., 1998, MNRAS 301, 289
- [\citeauthoryear] López-Corredoira M., Hammersley P. L., Garzón F., Simonneau E., Mahoney T. J., 2000, MNRAS 313, 392 (L00)
- [\citeauthoryear] Lucy L. B., 1974, AJ 79(6), 745
- [\citeauthoryear] Narayanan V. K., Gould A., DePoy D. L., 1996, ApJ 472, 183
- [\citeauthoryear] Wainscoat R. J., Cohen M., Volk K., Walker H. J., Schwartz D. E., 1992, ApJS 83, 111