Metal Enrichment of The Primordial Interstellar Medium through 3-D Hydrodynamical Evolution of The First Supernova Remnant
Abstract
The long-term evolution of supernova remnants (SNRs) in the primordial interstellar medium (ISM) with an inhomogeneous structure is calculated to investigate metal enrichment of the primordial gas. For this purpose, we have constructed a parallel 3-D hydrodynamics code incorporating the radiative cooling and self-gravity. The self-gravity and radiative cooling develop the inhomogeneous structure of the ISM from a small perturbation with a power-law spectrum. The resultant density ranges from 0.5 cm-3 to 106 cm -3. Calculations for a supernova (SN) with the progenitor mass of 20 are performed as the first step of a series of our study. It is found from the results that a single SN distributes some of newly synthesized heavy elements into a dense filament of the ISM with densities ranging from 100 to 104 cm-3 depending on where the SN explodes. Thus, the metallicity [Mg/H] of the dense filaments polluted by the SN ejecta becomes . From these filaments, the first Population II stars will form. This value is in accordance with the previous analytical work (Shigeyama & Tsujimoto) with accuracy of dex.
Subject headings:
galaxies: ISM — hydrodynamics — ISM: abundances — ISM: structure — methods: numerical — supernova remnants1. Introduction
Recently, the diversity in the abundance patterns of metal-deficient stars in the Galactic halo has been observed by several authors (McWilliam et al. 1995; Ryan, Norris, & Beers 1996). On the other hand, theoretical attempts (Audouze & Silk 1995; Shigeyama & Tsujimoto 1998) have led to the conclusion that star formation induced by quite few or a single supernova (SN) event results in the observed diversity in the abundance patterns. In particular, Shigeyama & Tsujimoto (1998) have suggested that star formation occurs in the thin shell produced by a SN explosion and that stars of the next generation inherit the abundance pattern thereof. This shell was assumed to contain all the heavy elements newly synthesized and ejected by the SN. As a result, the abundance pattern of new stars is determined by combinations of the SN ejecta and the interstellar medium (ISM) swept up by the explosion. In this scenario, the Rayleigh-Taylor instability is supposed to happen to destroy the dense heavy element layer into numbers of blobs which penetrate into the supernova remnant (SNR) shell. It is clear that a spherically symmetric SNR in a uniform ISM cannot bring its heavy element layer into the thin shell formed immediately behind the shock front. To check whether the abundance in the thin shell produced by a SNR reaches the average abundance inside the SNR as predicted by Shigeyama & Tsujimoto (1998), it is necessary to calculate hydrodynamical evolution of the SNR in three dimensions.
The evolution of a SNR is characterized by several phases (Chevalier 1977) as the ejecta-dominated (ED) phase, Sedov-Taylor (ST) phase, pressure-driven snowplow (PDS) phase, and momentum-conserving snowplow (MCS) phase. Each phase has been investigated by a number of authors, e.g., for the first two phases see Truelove & McKee (1999) and for the last two phases see Cioffi, McKee, & Bertschinger (1988). Most of these previous studies have been restricted to spherically symmetric SNRs in the uniform ISM. However, the inhomogeneity of an ISM affects the evolution of a SNR. A model of SNR evolution in an ISM with a density gradient (Hnatyk & Petruk 1999) has shown that the shape of the SNR was easily deformed to be non-spherical in yr after explosion. However, our objective is to see how a single SN event distributes newly synthesized heavy elements in the ISM when the SNR stops expanding at Myr after explosion. The ISM must also evolve on this time-scale due to gravity and radiative cooling. Hence, we need to follow the evolution of a SNR in the inhomogeneous and evolving ISM for more than 1 Myr.
In this Letter, we investigate the evolution of a SNR originated from a Population III (Pop III) star in the inhomogeneous ISM with the primordial abundances by using a 3-D hydrodynamics code. Especially, we will focus our attention on the correlation of the abundance of heavy elements with the gas density in each cell to identify the abundance of heavy elements that would be inherited by stars of the next generation. Consequently, we can test the hypothesis proposed by Shigeyama & Tsujimoto (1998).
2. The method and initial model
To model the three-dimensional evolution of a SNR, we have constructed a parallel 3-D hydrodynamics code incorporating self-gravity and radiative cooling of the ISM with no heavy elements. We adopt the Godunov type (Godunov 1959) scheme to solve the hydrodynamical equations (the HLLC method in Toro 1997). The usage of the first order scheme reduces not only the computational costs of the 3-D calculation by a factor of two compared with higher order schemes like PPM (Colella, & Woodward 1984) but also the number of boundary values to be transferred in parallel version. To obtain a second order scheme in time, the Strang-type dimensional splitting (Strang 1968) is used. In addition, we have made two modifications to the usual Godunov type scheme. First, to properly follow the adiabatic change of thermal energy in a pre-shock region, we adopt the method used in a usual cosmological hydrodynamics code (Ryu, Ostriker, Kang, & Cen 1993). Second, the consistent multi-fluid advection method (Plewa & Müller 1999) is implemented since we are interested in how heavy elements ejected by a SN explosion mix with the ISM. The 3-D Poisson equation is solved by the FFT method to calculate the self-gravity of the ISM. To solve the energy equation including radiative cooling term, we use an implicit method, i.e., the Newton-Raphson method.
In the early stage of the universe, the gas contains no heavy element and the main coolant at temperatures below K is hydrogen molecules. However, to solve rate equations for the formation and destruction of hydrogen molecules is not feasible for a simulation like presented here. We note that there are some attempts to take this approach (e.g., Abel et al. 1998). Accordingly, throughout this Letter, we use the radiative cooling rates for the gas with [Fe/H] 111The abundance ratios of the other heavy elements with respect to Fe have the “primordial” values in Sutherland & Dopita (1993) to mimic the cooling function of the very early stage of the universe. The cooling rate is computed by MAPPINGS III software by R.S. Sutherland (MAPPINGS III is the successor of MAPPINGS II described in Sutherland & Dopita 1993). The radiative cooling due to hydrogen molecules is not included in MAPPINGS III. In the low temperature range as low as 1000 K, the adopted cooling rate is slightly lower than the cooling rate by hydrogen molecules (see Figure 2 of Nakasato, Mori & Nomoto 2000). We use the equation of states incorporating hydrogen and helium in ionization equilibrium. We have assumed that ions and electrons are in thermal equilibrium, since the temperature in the SNR is almost always below K during the evolution.
The ISM is modeled by a periodic square box composed of 1503 zones. The size of the simulation box is set to 80 pc to cover the maximum size of a SNR. The simulation procedure is divided into following two stages.
The first stage of the simulation is devoted to archiving an inhomogeneous ISM structure. Firstly, an initial density field () for the first stage of the simulation is generated by the COSMICS package (Bertschinger 1995) with a power spectrum of the density expressed as . The initial mean number density of hydrogen atoms is set to cm-3. We assume that the initial temperature is uniform with K. Then, we obtain the initial velocity field () by integrating the equation of motion for one dynamical time ( Myr in the present case, where is the gravitational constant). We use the Zel’dovich approximation (Zel’dovich 1970) in this integration: , where is the acceleration field generated by through the Poisson equation. Then we have followed the hydrodynamical evolution of the box for further . Due to the self-gravity, filamentary and knotty structures gradually form like in calculations of the cosmological structure formation. In of the evolution, the inhomogeneity develops in the box with the density ranging from 0.5 cm-3 to 106 cm-3. The volume filling factor of the low density region with cm-3 (this equals to the initial mean density) is %. The velocity dispersion is about 3 km s-1. This value will be used to test the hypothesis of Shigeyama & Tsujimoto (1998). In the subsequent paper, we will present a detailed analysis of the 3-D inhomogeneous structure of the ISM obtained in the first stage of our simulation.
In the second stage of our simulation, we model the ST and PDS phases of the evolution of a SNR with the same code. For the initial condition of the SNR model, we deposit the SN explosion energy ( erg) into a cell as thermal energy. At the same time, we add the progenitor mass (20 as a fiducial value) to the same cell and treat 1.7 % (0.34 ) of the progenitor mass as Mg (Tsujimoto et al. 1995).
In this Letter, we do not intend to simulate the star formation processes. Instead, we show the results for two cases : the first SNR event occurs in (1) low density region or (2) high density region. We consider the region where is lower than cm-3 as the low density region and the rest of the box as the high density region. In the case (1), we select an arbitrary cell in the low density region as a SN site. After the star formation, the star leaves the star forming site and moves around under the gravitational field of the ISM. Thus, most of SNR events are expected to occur in the low density regions due to the large volume filling factor. Also in the case (2), we select an arbitrary cell in the high density region as a SN site. In the case (2), we treat 20 of the gas in the cell as the progenitor mass.
3. Results
3.1. case (1): low density regions
The first SN occurs in a smooth region where the density gradient of the ISM is small. This region corresponds to a “hole” (or a tenuous region) of the inhomogeneous ISM. The number density () of the chosen SN site at the end of the first stage is cm-3. After adding 20 ejecta to the cell, becomes cm-3. The temperature () of the SN site becomes K at the beginning of the second stage. Then a strongly shocked region is produced and the density of the cell decreases very quickly. Although the ejecta soon become nearly spherical in Myr, they are deformed after the collision with the dense structure of the ISM.
To see the evolution of the shape of the ejecta quantitatively, let the volume of the metal-enriched regions and the surface area of the metal-enriched regions. We define the volume filling factor () as and the deformation factor () as , where L is the size of the simulation box. Figure 1 shows the evolutions of (upper panel) and (lower panel) with the solid line for the case (1). In the PDS phase of a spherical SNR in a uniform ISM, the shocked volume evolve as (Cioffi, McKee, & Bertschinger 1988). If we assume the evolves as , the exponent during the first 1 Myr is smaller than unity and then increases to almost unity at Myr. It is likely that the ejecta expand faster than the shock front in later phases. The fact that shown in the lower panel is significantly greater than unity indicates that the shape of the surface of the ejecta becomes very deformed from a sphere due to the Rayleigh-Taylor instability.
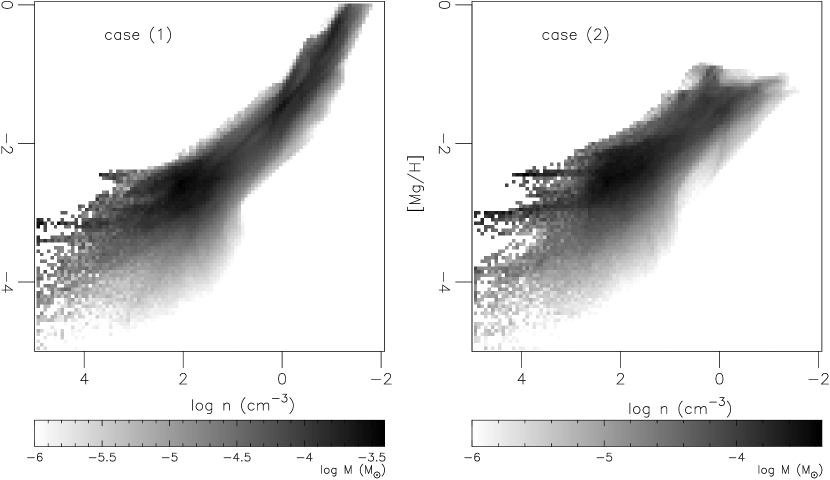
Figure 2 shows the mass of the heavy elements at Myr as a function of number density () and metallicity ([Mg/H]). We note that this mass distribution function does not change its shape for last 1 Myr. There are two peaks in this diagram. One is located at and not so pronounced as the other. The total amount of the heavy elements involved in this peak is not so large. The low density indicates that these heavy elements have been staying near the SN site. The other peak is located at . A majority of the heavy element is involved in this peak. The swept up mass estimated from equation (2) of Shigeyama & Tsujimoto (1998) becomes times greater than the original value in this equation. Here, the first factor in the left hand side comes from the density and the second from the sound speed (or the velocity dispersion). Thus the [Mg/H] estimated from this equation would be . The analytical work and 3-D calculation have shown a fairly good agreement in this respect. What Shigeyama & Tsujimoto (1998) did not mention is that this peak has a finite width. This metallicity distribution can be considered to be a consequence of the inhomogeneity of the ISM: A part of the ejecta that penetrates into a dense part of the primordial ISM, mixes with it, and tends to get a small metallicity. On the other hand, a part of the ejecta that contacts with a tenuous part of the ISM, mixes with a small amount of ISM thereof, and thus gets a larger metallicity. A part of the ejecta that never mixes with the ISM will keep its initial metallicity.
The resultant [Mg/H] ranges [Mg/H] with a peak at [Mg/H] . With the resolution of our calculations, i.e. pc, a cell with includes more than one solar mass. Thus the metallicity inherited by the next generation stars may be overestimated unless the mass of these stars is much smaller than one solar mass.
3.2. case (2): high density regions
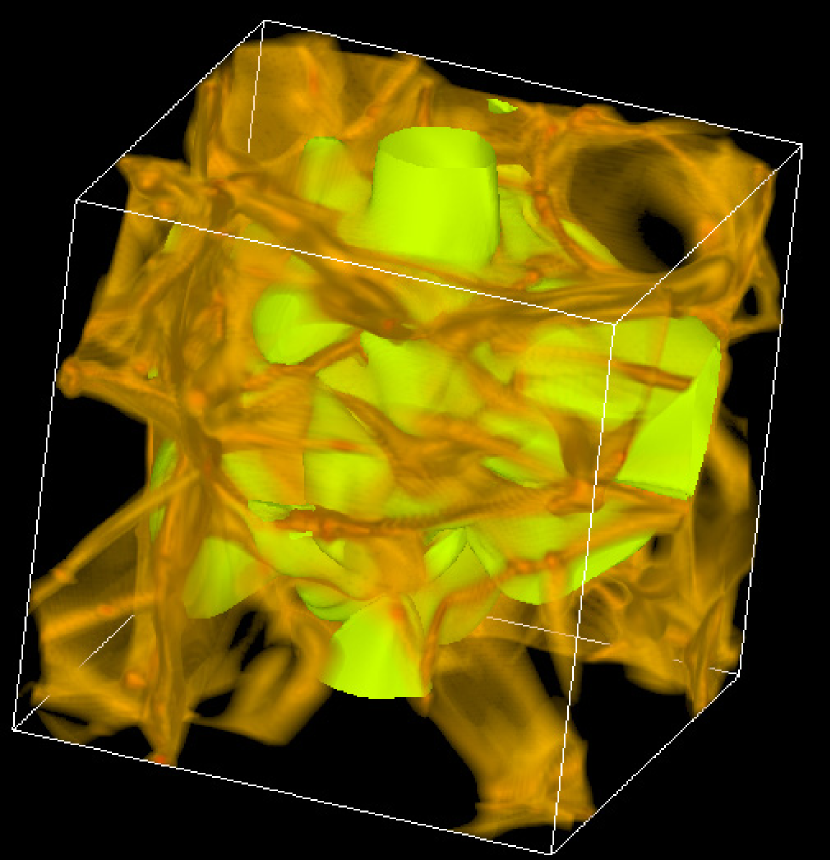
In this case, and of the SN site at the beginning of the second stage are 11,500 cm-3 and K, respectively. The evolution of and is presented in Figure 1 with the dotted lines. We can see that is always smaller than in case (1) and is always higher than in case (1). This is because the SN occurs in a dense filament that produces a large density gradient. Namely, the SNR easily expands perpendicular to the direction of the filament but is much slowed down along the direction of the filament. The surface of the metal-enriched region at Myr is shown in Figure 3 together with the filamentary structure of the ISM. The SN site is located at the center of the simulation box. The yellow surface represents the [Mg/H] iso-surface and the orange filamentary shape shows the 3-D density structure. The ejecta expand into tenuous regions of the ISM and are deformed by the filamentary ISM structure.
As in case (1), the frequency distribution function of the mass of Mg at Myr with respect to and [Mg/H] is shown in the right panel of Figure 2. Although there are two peaks at and also in this case, both of the locations and shapes are different from those for case (1). Equation (2) of Shigeyama & Tsujimoto (1998) gives [Mg/H] that agrees with this 3-D calculation within a factor of .
4. Summary and Discussion
In this Letter, we have presented the first results of 3-D hydrodynamical calculations of a SNR originated from a Pop III star in the inhomogeneous ISM with the primordial abundances. We have constructed an efficient parallel numerical code to solve the 3-D hydrodynamical equations and the Poisson equations. Using our code, we first evolve a random density field and obtain the inhomogeneous ISM model. Then, we follow the long-term evolution of a SNR to see how a single SN distributes the newly synthesized heavy elements into the ISM.
For the site of the first SN event in the simulation, we consider low density and high density environments. In both cases, a strong shock is produced and then the shock front is slowed down by collisions with the filamentary structure of the ISM. Our calculations indicate that a majority of the newly synthesized heavy elements is distributed into the gas in filamentary structures to get the metallicity of [Mg/H] depending on the SN site. Thus, Pop II stars born from a high density filament polluted with the ejecta of a SN will have [Mg/H] on their surfaces. We have compared the values of [Mg/H] in dense regions of the simulation box with those estimated from the analytical work by Shigeyama & Tsujimoto (1998) and found that they are in agreement with each other with an accuracy to dex, though the assumed density structure of the ISM in Shigeyama & Tsujimoto (1998) is quite different from that in the present work.
To understand metal enrichment process at the early stages of galaxy evolution, we will need to eliminate (or identify, at least) the influences from numerical artifacts that may be caused by the limited resolution of our model. First, we needed to deposit thermal energy into one cell to initiate a SN. A significant fraction of the explosion energy of a real SN with the size of pc must be in the form of kinetic energy. Thus the ejecta of a real SN are expected to penetrate deeper into the filamentary structure to get lower metallicity than shown in this Letter. Second, the inhomogeneous ISM model obtained in the first stage of our simulation procedure may be changed depending on a number of model assumptions which include the initial power spectrum of the model, the cooling rates due to molecular hydrogen, neglect of the dark matter potential, the effect of radiative transfer, and etc..
We will report results of a detailed study of the inhomogeneous ISM and longer evolution of the metallicity distribution in a separate paper (Nakasato & Shigeyama 2000). Calculations for SNe with different progenitor masses will be also performed to see the abundance patterns of Pop II stars.
References
- Abel et al. (1998) Abel, T., Anninos, P., Norman, M.L., Zhang, Yu, 1998, ApJ, 508, 518
- Audouze & Silk (1995) Audouze, J., & Silk, J., 1995, ApJL, 451, 49
- Bertschinger (1995) Bertschinger, E., 1995, http://arcturus.mit.edu/cosmics/
- Chevalier (1977) Chevalier, R.A., 1977, ARA&A, 15, 175
- Cioffi, McKee, & Bertschinger (1988) Cioffi, D.F., McKee, C.F., Bertschinger, E., 1988, ApJ, 334, 252
- Colella, & Woodward (1984) Colella, P., & Woodward, P.R., 1984, J. Comp. Phys., 54, 174
- Godunov (1959) Godunov, S.K., 1959, Mat. Sb., 47, 271
- Hnatyk & Petruk (1999) Hnatyk, B., & Petruk, O., 1999, A&A, 344, 295
- McWilliam et al. (1995) McWilliam, A., Preston, G.W., Sneden, C., & Searle, L., 1995, AJ, 109, 2757
- Nakasato, Mori & Nomoto (2000) Nakasato, N., Mori, M., & Nomoto, K., ApJ, 2000, 535, 776
- Nakasato & Shigeyama (2000) Nakasato, N., & Shigeyama, T., 2000, in preparation
- Plewa & Müller (1999) Plewa, T., & Müller, E., 1999, A&A, 342, 179
- Ryan, Norris, & Beers (1996) Ryan, S.G., Norris, J.E., & Beers, T.C., 1996, ApJ, 471, 254
- Ryu, Ostriker, Kang, & Cen (1993) Ryu, D., Ostriker, J.P., Kang, H., & Cen, R., 1993, ApJ, 414, 1
- Shigeyama & Tsujimoto (1998) Shigeyama, T., & Tsujimoto, T., 1998, ApJL, 507, 135
- Strang (1968) Strang, G., 1968, SIAM J. Num. Anal., 5, 506
- Sutherland & Dopita (1993) Sutherland, R.S., & Dopita, M.A., 1993, ApJS, 88, 253
- Toro (1997) Toro, E. F., 1997, Riemann solvers and numerical methods for fluid dynamics (Berlin: Springer-Verlag)
- Truelove & McKee (1999) Truelove, J.K., & McKee, C.F., 1999, ApJS, 120, 299
- Tsujimoto et al. (1995) Tsujimoto, T., Nomoto, K., Yoshii, Y., Hashimoto, M., Yanagida, S., & Thielemann, F.-K., 1995, MNRAS, 277, 945
- Tsujimoto, Shigeyama, & Yoshii (1999) Tsujimoto, T., Shigeyama, T., & Yoshii, Y., 1999, ApJL, 519, 63
- Zel’dovich (1970) Zel’dovich, Ya.B., 1970, A&A, 5, 84