HST/NICMOS Observations of the Host Galaxies of Powerful Radio Sources: Does Size Matter?
Abstract
We present near-infrared J and K band imaging of a sample of powerful radio source host galaxies with the Hubble Space Telescope NICMOS2 camera. These sources have been selected on their double lobed radio structure, and include a wide range of projected radio source sizes. The largest projected linear sizes range from the compact Gigahertz Peaked Spectrum (GPS, kpc) and Compact Steep Spectrum (CSS, 20 kpc) radio sources, up to the large-scale ( 20 kpc) classical doubles (FR II radio sources). We investigate the dependence of host galaxy properties (including near-IR surface brightness profiles) on radio source size, using both our own and published data. The absolute magnitudes and surface brightness profiles are consistent with the host galaxies being regular giant elliptical galaxies rather than Brightest Cluster Galaxies (BCGs). We find that the GPS, CSS, and FR II host galaxies are a uniform class of objects, consistent with a scenario in which a powerful radio source evolves along this size sequence.
1 Introduction
Powerful radio galaxies play a critical role in our understanding of both galaxy evolution and the phenomenon of activity in galactic nuclei. They provide probes of the intracluster medium, particularly in cooling flow clusters where they reveal the existence of large scale ordered magnetic fields in the ICM (Taylor et al., 1994). They interact with gas in the ISM of their host galaxies producing the alignment effect and therefore can be used as probes of the content and structure of the ISM (McCarthy, 1993). The higher redshift sources act as beacons which reveal the location of the earliest sites of the formation of giant ellipticals in the universe (e.g., Spinrad et al. 1995). Their luminosities, morphologies, and lifetimes constrain the processes through which angular momentum is extracted from gas in the central accretion disk around a supermassive black hole and jets are formed (e.g., Blandford 1994). Yet we know little about the life-cycles of these radio galaxies.
Recent work has identified the GHz Peaked Spectrum (GPS111While some GPS sources are known to be larger than the 1 kpc cutoff size, we only consider here the ones that are smaller than 1 kpc. Since we selected our sources to have a double lobed radio structure, our GPS criterion closely matches the one by Readhead et al.(1996a) for the Compact Symmetric Objects (CSO’s). Throughout this article the GPS and CSO classifications are considered identical.) and Compact Steep Spectrum (CSS) radio sources as likely candidates for the progenitors of the large-scale powerful classical double (3CR FR II) sources: e.g., O’Dea et al. (1991, 1996); Fanti et al. (1995); Snellen et al. (1996, 1999); Readhead et al. (1996a, b); O’Dea & Baum (1997); O’Dea (1998); de Vries et al. (1998b). The GPS/CSO and CSS sources are powerful but compact radio sources whose spectra are generally simple and convex with peaks near 1 GHz and 100 MHz respectively. The GPS/CSO sources are entirely contained within the extent of the narrow line region ( 1 kpc) while the CSS sources are contained within the host galaxy ( 20 kpc).
The typical overall lifetime of a radio source is on the order of 107 years, significantly shorter than the stellar evolutionary time-scale (for the bulk of the stars) of a few Gyrs. The radio structure therefore most likely originates and expands inside a well evolved stellar system, and provided we isolate and remove the instantaneous effects of radio–ISM interaction (like the aligned component), the global emission properties of these systems should be identical. Furthermore, within current unification scenarios, radio galaxies do not permit a direct view into the nucleus at optical and near-IR wavelengths, as the AGN emission is blocked by obscuring material. The emission is therefore dominated by the stellar component, with perhaps minor contributions from dust-reprocessed AGN light towards the near-IR. Thus, optical and near-IR imaging plays a powerful role in determining the relationship between the various classes of radio galaxies.
We have embarked on a multi-wavelength program whose goal is to understand the relationship between the GPS/CSO and CSS sources on the one hand and the large-scale sources on the other, and to use the properties of these objects to constrain radio source evolution. We have obtained ground-based optical imaging (O’Dea et al., 1996) which shows that the GPS/CSO, CSS, and large-scale sources all have similar host galaxy magnitudes and similar behavior on the band Hubble diagram - see also Snellen et al. (1996). The host galaxies appear to be passively evolving ellipticals, with the caveat that the larger sources exhibit an additional component of blue light associated with the alignment effect. Our broadband HST images of the CSS sources (de Vries et al., 1997) reveal that they show the alignment effect, even at low redshifts (0.1 0.5). Narrow-band [O III] imaging of a subset of the CSS sample shows the CSS radio sources interacting with and exciting gas as they propagate through the host galaxy and is consistent with the hypothesis that the CSS are physically young and not confined sources (de Vries et al., 1999; Axon et al., 2000).
In the near infrared, where host galaxies appear more regular and are less contaminated by non-stellar components, we obtained ground-based ,, and band imaging observations of samples of GPS/CSO, CSS, and large sources matched in redshift and radio flux density (de Vries et al. 1998a and 1998b, hereafter Paper I and II respectively). We find that (1) the integrated near-IR Spectral Energy Distributions (SEDs) are similar; (2) the SEDs are consistent with old stellar populations with formation redshifts between 5 and 10; (3) typically about 30% of the K band light is contributed by an additional component which is well described by emission from dust at a temperature of 1000 K. (4) The K band absolute magnitudes are consistent with passive evolution of the stellar component.
Thus far all our ground-based optical and near-IR observations, as well as IRAS (Heckman et al., 1994) and ISO (Fanti et al., 2000) observations suggest that both the host galaxies and AGN are similar in the GPS/CSO, CSS, and large-scale 3CR FR II. This continuity of properties supports the hypothesis that the GPS/CSO sources evolve through a CSS phase and then into the large-scale 3CR sources.
If this is the case, the number of radio sources per unit size interval depends on the details of their evolution. Comparing complete samples of GPS/CSO and CSS sources with the revised 3CR catalog (Laing et al., 1983), O’Dea & Baum (1997) found that the data are consistent with the proposed evolution scenario if the sources experience strong luminosity evolution; e.g., the radio luminosity must evolve as . See also Fanti et al. (1995); Begelman (1996); Readhead et al. (1996b); Kaiser et al. (1997); Blundell et al. (1999). The required evolution is consistent with a self-similar linear size evolution of the radio source in which equipartition is maintained between relativistic particles and magnetic fields and the radio sources advance at roughly constant velocity.
In this paper, we utilize the high angular resolution of HST’s NICMOS2 camera to determine accurate colors for the stellar and AGN components separately, and determine well sampled surface brightness profiles. These unique data allow us to do the following: (1) compare the stellar colors with the predictions of stellar evolution models; (2) examine the evolution of the absolute K band magnitudes as a function of redshift; (3) compare the surface brightness profiles and Kormendy relations (Kormendy, 1985); and (4) determine the AGN-normalized radio power as a function of linear size. Our results allow us to establish the consistency of the host galaxy and AGN properties among the GPS/CSO, CSS and large scale FR II radio sources.
2 Observations and Reduction
Our sample (cf. Table 1) is drawn from the O’Dea et al. (1991) compilation of GPS sources, and the Heckman et al. (1994) list of GPS, CSS and FR II sources. Each source is selected to have a double-lobe radio structure, with the possible presence of a radio core. The radio morphologies among the sample are kept as uniform and symmetric as possible, in an effort to minimize possible contamination by objects that appear smaller than they actually are (i.e., foreshortened by their particular viewing angle). Furthermore, the sample was matched among the subclasses in both redshift and radio power. The objects were observed with the NICMOS 2 camera (Thompson et al., 1998) on board HST during cycle 7a, as part of the 20 orbit program 7855 (P.I. Chris O’Dea). In order to sample the extremes of the radio size evolution better, we chose to image 8 GPS/CSO and 8 FR II’s, and to use the remaining 4 orbits on the intermediate size CSS sources. Each source was observed for 2640 seconds in the NICMOS filters F110W and F205W, for a total of 2560 seconds. A few sources with high declinations had longer orbits (4704 seconds, cf. Table 1). The NICMOS F110W and F205W filters are comparable to the ground-based and band filters, though both of the NICMOS filters are substantially broader – F110W extends blue-ward to 8000Å while F205W extends up to 2.4 micron.
Each source visit consisted of two dithered pointings, separated by 10″ along the field-of-view diagonal (272). Since all our sources were known to be smaller than 10″ (Paper I) this dither allowed us to remove remaining sky and detector signatures to a high degree.
2.1 Pedestal Removal
At the time of our reduction, the standard NICMOS reduction pipeline (calnica task in STSDAS/IRAF) did not properly remove the detector background, especially in the filters dominated by the thermal background (e.g., F205W). This so-called “pedestal” of residual sky222Actually the pedestal is due to a time varying DC bias offset, and has nothing to do with actual sky emission. We use “sky” in the sense of an unwanted component that has to be removed. has to be removed post-pipeline.
The structure of the pedestal in our data was very constant over the 6 month period during which our observations in program 7855 were obtained. The fact that we used a large dither and the relative sparseness of our fields allowed us to construct a “master sky dark”, using our own data (with 220 input frames for each filter). After slight rescaling for each individual source, subtracting this master sky dark removed almost all of the residuals, especially in the thermal-dominated F205W filter. For our particular dataset, this method proved to be more successful in removing the pedestal than methods by Van der Marel (unpedestal) and Dickinson (pedsky).
2.2 Photometry
The source photometry was done using the apphot package in IRAF. The magnitudes have been converted to the HST Vega system (NICMOS handbook 1998), yielding the following zero-points: ZP 22.25, and ZPF205W= 21.90. The magnitude is then given by: mband= 2.5 log(CountRate) + ZPband. The corresponding Vega fluxes are 1897.3 and 752.2 Jy for F110W and F205W, respectively. The results are listed in Table 1, columns 6 and 7. The listed errors are the formal fitting errors (1 ), which include contributions due to Poisson noise, read-out noise, and sky level uncertainties. In sources with a close companion, we first subtracted this companion galaxy before doing the photometry (cf. Sect. 2.4). The magnitudes have been corrected for Galactic extinction, using values taken from NED333 The NASA/IPAC Extragalactic Database (NED) is operated by the Jet Propulsion Laboratory, California Institute of Technology, under contract with the National Aeronautics and Space Administration. which are based on H I column densities of Burstein & Heiles (1982, 1984). To convert these values into the proper near-IR values, we interpolated between the near-IR values given by Cardelli et al. (1989), based on the relative widths and central wavelengths of F110W and F205W with respect to the and bands. This yielded: 0.380 , and 0.104 , both under the assumption 3.1. These values differ slightly from the and used in Paper I.
2.3 AGN and Galaxy Decomposition
In order to investigate the properties of the AGN and the stellar component, we need to decouple them from the total galaxy light. Fortunately, thanks to the high resolution of the NICMOS camera and the absence of seeing, we can improve significantly on the ground-based data (Paper II) in this respect; though it is still far from trivial. Obviously, sources with a strong unresolved component are decomposed rather easily, however, we find that most sources in our sample have fairly minor contributions from a nuclear point source (PS).
An upper bound to the PS contribution can be estimated by assigning all of the peak nuclear flux to an unresolved component. This peak nuclear flux is determined by fitting a Gaussian profile to the radial profile of the source. The Point Spread Function (PSF) is then scaled up to this value, and the integration of the flux in this scaled PSF yields the upper limit. This method is applied to the ground based data (cf. Table 4 of Paper I), and is used here for comparison purposes, see Table 3, Columns 2 and 4.
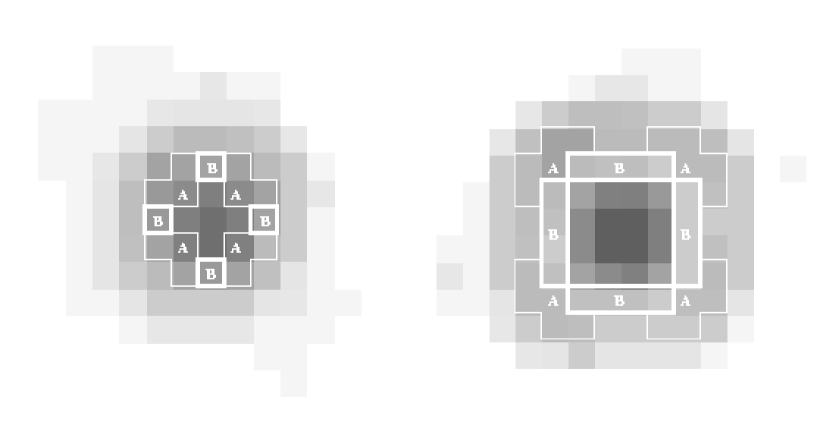
At these near-IR wavelengths, the NICMOS camera slightly resolves the Airy diffraction pattern. In camera 2, the radii for the first Airy minimum are approximately 1.8 and 3.1 pixels for F110W and F205W respectively. This effectively means that up to 16% of the total flux is spread out over large radii, providing a useful handle on the total PS flux. The NICMOS F110W and F205W PSF’s are presented in Fig. 1, where the Airy pattern is readily apparent in the F205W image. Addition of such a pattern to a galaxy will modulate the relative fluxes, especially in the areas marked “A” and “B” where, area “B” marks the first Airy minimum. By measuring these variations in a source and comparing them to those expected in a PSF, one can calculate the PS contribution to the total galaxy light. This method works best for the F205W data, where the Airy pattern is better resolved, and where the effect of the secondary support structure of the telescope on the PSF structure is less severe. PS contributions recovered this way are listed in Table 3 Columns 3 and 5. Note that these percentages compare very well to the upper limits derived in the previous section. Photometry of the separate AGN and galaxy components is presented in Table 3.
2.4 Galaxy Isophote Modeling
Subtraction of a galaxy model is useful for doing photometry on close binary galaxies, and in addition may provide insights on deviations from a simple elliptical galaxy shape revealing structures, such as line emission due to an aligned component, or very close interacting galaxies. We used the ellipse package in IRAF to construct model elliptical galaxies. The major axis position angle and local ellipticity were allowed to vary. The galaxy center was kept fixed, as the model otherwise incorporated too much detail: on test-runs, artificially superposed small galaxies were completely modeled away if the center was allowed to vary.
Results of the model galaxy subtraction can be found in Figs. 10–28, bottom two panels. It should be noted that modeling usually failed close to the nucleus, and a point source is often present in the residual maps. While this seems like a good way of obtaining the AGN luminosity (cf. last section), negative features caused by the inaccurate fit compromise accurate photometry.
We also used the galaxy models to determine the galaxy profiles along the major axis. In essence we determine a galaxy profile by fitting (at a certain radius) an ellipse that best describes the galaxy (at that same radius). The local surface brightness, ellipticity, and position angle are then stored in a table, which is used to extract the major axis profile and to create the galaxy model at the same time. A discussion on the fits to these profiles is presented in § 5.2.
2.5 Color Maps
The final step of our reduction process is the creation of F110W—F205W color maps. We convert counts in the images into Watts () before dividing the images. Thus, the ratio represents a real fractional energy excess. We also smoothed the F110W images to the resolution of the F205W images using a Gaussian approximation to the PSF. However, because of the mismatched Airy patterns in the two bands, some small artifacts are present in the color images; e.g., the blue (dark grey) nucleus in 0941080 is surrounded by a red (light grey / white) ring. The color maps are plots of the following function:
| (1) |
where CR is the count rate in the image, and the factor is used to normalize the relative energies per count in F110W and F205W, i.e., one count in F110W represents 2.68 times as much energy as a count in F205W. The offset by unity in both images suppresses large color variations in the noise dominated areas of the map. The color maps are presented in Figs. 10 – 28, bottom left of the larger panels.
3 Discussion of Individual Sources
3C 19 — FR II — This galaxy has an interacting companion, whose blue color is presumably due to ongoing star-formation. The color contrast is rather striking. The radio structure seems to be oriented towards another (faint) satellite galaxy.
3C 42 — FR II — This source is part of a small group of galaxies. Its radio structure is aligned with the closest companion. No apparent color differences between the various members are found.
3C 46 — FR II — The southern galaxy has a double nucleus, and most likely contains the radio source. The secondary nucleus is clearly visible in the residual images. This double nucleus galaxy is interacting with a slightly smaller companion to the north (PA 0°, distance 1.5″).
3C 67 — CSS — In the F110W residual image we see a hint of the aligned component which is seen in the WFPC2 F702W image (de Vries et al., 1997).
0404+768 — GPS/CSO — This source appears larger in F205W than in F110W, because of its very red color which cannot be accounted for by the small estimated Galactic extinction ( 0.57). Most of the color, therefore, has to be due to intrinsic absorption.
0428+205 — GPS/CSO — The galaxy has a red nucleus and is embedded in a faint halo, extending towards the south and east, encompassing the small companion to the SSE.
0500+019 — GPS/CSO — The radio axis points towards the companion object due south. The accurate centering of the nucleus in the host galaxy argues against a chance superposition of a galaxy and a (reddened) quasar, as proposed by Stickel et al. (1996). Thus, we suggest the red nuclear color is produced in the host galaxy (rather than in an intervening system – see also Paper I).
3C 200 — FR II — The elongation of the F110W contours close to the nucleus has the same position angle as the radio jet (Bogers et al., 1994). The associated excess emission is clearly present in the F110W residual image.
0941080 — GPS — Like 3C 46, this is an interacting system. However, there is evidence of enhanced star-formation in the southern (PA 191°, distance 2.6″) galaxy. The blue structure is flattened along the major axis of this galaxy, i.e. is disk-like. The radio source is associated with the large northern galaxy. Both have blue nuclei.
3C 268.3 — CSS — Of the prominent line-emission associated with this source (de Vries et al., 1999) only the faintest trace is recovered in our infrared images. The nucleus is very red, whereas both companion galaxies have neutral colors.
3C 303.1 — CSS — The alignment effect can be clearly recovered in the color map, where, presumably due to H line emission in the F110W filter, the aligned structure appears blue.
3C 456 — FR II — The F110W residual shows excess emission towards the south. It is not present in the F205W residual map though.
3C 458 — FR II — This source was not detected, possibly due to an error in the published radio source position.
3C 460 — FR II — This is another interacting system where there are indications of enhanced star formation in the interacting (PA 195°, distance 1.2″) companion. The host galaxy exhibits a patch of very red color to the south west of the nucleus (possibly due to dust). The radio axis is oriented towards the general direction of the companion.
2352+495 — GPS/CSO — This source has boxy isophotes, indicated by the residuals in the elliptical isophote subtraction. The radio axis is perpendicular (in projection) to the major axis of the galaxy.
In summary, the host galaxies of the GPS/CSO, CSS and large FR II are morphologically similar. Many show evidence of interaction with companion galaxies. Some galaxies exhibit red nuclei, while some companions have blue nuclei. In some galaxies, the companion galaxy is found along the radio axis, consistent with the suggestion of West (1994) that in prolate galaxies in the centers of clusters, both the radio source and satellite galaxies will share the same preferred axis.
4 Comparison of the GPS/CSO, CSS, and FR II Hosts
In this section we compare the host galaxy properties of the different radio size classes. As argued in Paper II, significant differences between the compact GPS/CSS and the large FR II host galaxies might indicate different origins for the radio activity, arguing against a common evolutionary scenario. In Sect. 5 we investigate the place of our powerful radio source hosts in the elliptical galaxy taxonomy.
4.1 Galaxy and Nuclear Colors
With the proper decomposition of galaxy and AGN contributions in the near-IR, we are able to investigate the properties of the colors of the galaxies as a function of radio source size independent of the AGN contribution. In addition, the properties of the AGN can be compared to the radio properties
We examine whether there is a correlation between AGN color (F110W—F205W) and relative AGN prominence in an object. Within the context of the current unified schemes, e.g., Antonucci (1993); Urry & Padovani (1995), the AGN should become more dominant in a galaxy as we view it closer to the axis of the obscuring torus and should become progressively bluer, as the extinction also decreases. However, different sources may have differing amounts of obscuration and extinction unrelated to orientation. Also near-IR emission from a hot dust component may be present (de Vries et al., 1998b). The data are plotted in Fig. 2; note that the sources with low PS dominance have large error bars. There does not seem to be a significant trend. Most sources have values of the F110W—F205W color , comparable to the host galaxy colors (some exceptions are discussed below). This result strengthens the analysis of Paper II, where we used galaxy colors which included some AGN contribution.
The absence of a trend in color with nuclear dominance is consistent with the following. (1) The radio sources are not viewed anywhere near the opening angle of the obscuring torus and (2) the sources all have similar amounts of obscuration and/or hot dust emission in our line of sight to the nucleus.444The source 2342+821 is an exception, since it has been re-classified as a quasar (Lawrence et al., 1996).


4.2 Constraints on Luminosity Evolution of the Radio Sources
Here we examine whether there is evidence for a decline in radio luminosity with increasing size. As proposed by Fanti et al. (1995); Begelman (1996); O’Dea & Baum (1997), the luminosity scales as . If we assume that the radiative output of the AGN is constant over the radio source lifetimes of (105-7 years), the amount of reprocessed near-IR AGN light should be relatively constant as well. Therefore, dividing the total radio flux density by the near-IR flux normalizes the radio power by the intrinsic AGN radiative luminosity, and makes a direct comparison between the sources of different sizes possible. We expect some scatter due to the following: (1) we measure only the projected linear size rather than the true radio source size; (2) due to varying obscuration and redshift, the observed K band nuclear light represents a different fraction of the true AGN bolometric luminosity; (3) the ratio of AGN bolometric luminosity to radio source luminosity depends on the “efficiency” factor which may vary from source to source or as a function of source size, e.g., Eilek & Shore (1989); Chyzy (1997); (4) the radio sources have different radio spectra (though they are all optically thin at the rest frame frequency of 2.7 GHz used here).
In Fig. 3, we show the k-corrected K-band normalized radio power versus projected linear size. The solid line represents the expected luminosity evolution, arbitrarily scaled. The GPS/CSO and CSS sources are consistent with the predicted luminosity evolution. However, the large sources ( 100 kpc) are inconsistent with this evolution. This plot can be compared with the P-D diagram in Blundell et al. (1999) in which they plot evolutionary tracks for different jet powers, with the main distinction that our sample has been normalized to the same AGN output. The slope is consistent with their jet-power ergs s-1 track (at least up to sizes of a few 100 kpc). Our discrepant large scale sources could fall on a roughly parallel track for more radio luminous objects, offset to the GPS/CSO-CSS track. Given the small number of large sources and the large scatter in the points, this question should be re-addressed with a larger sample. If this tentative result is confirmed, it would have significant implications for radio galaxy evolution. The current plot does not exclude the possibility that the AGN radiative energy output (i.e., band light) drops in the older and larger sources; the ratio of radio to band luminosity would therefore increase as the sources age relative to the predictions of a constant AGN output model. Another possibility is that radio luminosity decline slows down in the larger sources, contrary to the Kaiser et al. (1997) prediction. This might be the case if the ambient density profile flattens (O’Dea & Baum, 1997; Kaiser et al., 1997).
4.3 Stellar Population Synthesis Models
Since the galaxy light in the near-IR is due to the stellar population of the host, we can use stellar synthesis models (Bruzual & Charlot, 2000) to compare actual and expected colors as a function of mean population age and metallicity (cf. Paper II). For this purpose we generated F110W and F205W magnitudes and colors with and band filters, since the HST filters are not included in the standard code.
The results are presented in Figs. 4 and 5. The colors are based on the AGN-contribution subtracted magnitudes, and should therefore be due to the underlying stellar population exclusively. We plotted various evolutionary tracks, similar to those in Figs. 4 and 5 of Paper II. The solid track represents the case where an instantaneous starburst at the formation redshift ( 5) was allowed to passively evolve with time. The mean metallicity of the model galaxy was kept fixed at Z = 0.02 (left panel, the solar value), and Z = 0.05 (2.5 times solar, right panel). The short and long dashed lines are the non-evolving cases, which implies all sources are observed at the same stage of their evolution. The mean intrinsic age of the galaxy is assumed to be 5 Gyr for the bottom dashed track, and 10 Gyr for the top. Consistent with results from Paper II, we find the sources in our sample are best represented by a metallicity slightly above the solar value and an old mean population age ( 5 Gyr). This population age implies a high formation redshift, and well evolved populations. Thus, these radio sources are born and evolve inside mature elliptical galaxies.


The host galaxies of GPS/CSO, CSS, and FR II sources appear to have similar near-IR colors, confirming the results of Paper II. However, the higher resolution allow us to separate out close companions, and, as can be seen in Figs. 4 and 5, all three of these close companions are significantly bluer than their larger neighbors. This blue excess is most likely due to ongoing star-formation, triggered by the interaction with their more massive companion. The color maps show this blue excess as rather localized regions in 0941080b and 3C 460b; while in 3C 46b it is more evenly distributed over the galaxy. The presence of active star-formation implies these small companion galaxies are relatively gas-rich, unlike their more massive neighbors. The remaining other source which appears too blue is GPS/CSO 2342+821. This source is probably a quasar, also based on its position in Fig.2.
In summary, the host galaxies of GPS/CSO, CSS, and FR II radio galaxies have similar near-IR colors. They are consistent with stellar populations with a metallicity slightly above the solar value and an old mean population age ( 5 Gyr). In the next section we will compare our sample as a whole to other types of luminous ellipticals.
5 Comparison of the Host Galaxies with other Ellipticals
Elliptical galaxies can be characterized by just a few parameters: the mean surface brightness , effective radius , and central velocity dispersion . Ellipticals populate a plane in this 3D space: the fundamental plane, e.g., Djorgovski & Davis (1987). Since we currently lack velocity dispersions for these galaxies, we will use the projection of the fundamental plane onto the (,) plane. This correlation has been investigated first by Kormendy (1977, 1985), and is now known as the Kormendy relation. Since the absolute luminosities of our galaxies, due to the small redshift range, are comparable, the variation in host galaxy size is expected to be equally small. As a consequence, the variation in central velocity dispersion among our sample galaxies should also be small, making the – correlation informative (cf. § 5.2).
5.1 Evolution of the Absolute Host Galaxy Magnitude
A plot of absolute luminosity versus redshift has some nice features. First, sources are compared on the same absolute (physical) scale, given the proper k-correction, and not on apparent quantities. Furthermore, plotting against redshift provides a baseline over which the data can be compared with evolutionary tracks based on stellar synthesis models. And finally, a comparison to published data from the literature on different types of elliptical galaxies is possible.
We carried out this analysis on our ground-based data in Paper II. However, the poorer resolution of the ground-based data resulted in incomplete AGN–galaxy decomposition, e.g., 1404+286 and 1345+125 are known to be contaminated by emission from their nuclei. In Fig. 6, we plot the absolute magnitude of the galaxy, without the AGN contribution. As in Paper II, data from the literature on (usually radio quiet) Brightest Cluster Galaxies (BCGs) have been included, taken from Aragón-Salamanca et al. (1993) and Collins & Mann (1998). The literature -band data have been converted into the F205W filter system. Note that these data have not been decomposed into galaxy and AGN components like our NICMOS data. However, given the fact that BCGs generally exhibit flat, “cuspy”, luminosity profiles near their centers, e.g., Hoessel et al. (1987); Faber et al. (1997); Graham et al. (1996), a steep PS-like component is most probably an insignificant contribution to the overall luminosity in these galaxies.

As in Fig. 6 of Paper II, the brightest BCGs (which also tend to be the more X-ray luminous objects) appear to have a different evolutionary history than our sample and the predicted tracks for passively evolving galaxies. The bright upper end of our sample is consistent with a passive evolutionary scenario, more so than seen in Paper II in the ground based data-set, where in some cases the AGN contribution was significant. The fact that our sample covers a range of intrinsic galaxy masses is reflected in the increase in scatter towards lower redshifts. The lack of similar galaxies at somewhat higher redshifts is a selection effect. Something similar seems to apply to the lower X-ray luminosity sources, i.e. it is uncertain whether those sources are really absent at higher redshifts. Fig. 6 has some important implications. First, our hosts are less luminous than BCGs at similar redshifts. Owen & Laing (1989) and Owen & White (1991) find a similar result for Classical Doubles (FR II’s), which are significantly fainter than BCGs. Second, the redshift evolution of our sample seems more consistent with passive evolution than that of the brightest BCG’s, which appear to increase in luminous mass (possibly through merging) as they evolve. And finally, we see no dependence of absolute magnitude on radio source size.
5.2 Surface Brightness Profiles

Luminosity profiles and their derived quantities – effective radius (), effective surface brightness (), mean surface brightness (), and their general shape are all important quantities for discriminating between various objects. Spiral galaxies usually have exponential profiles, whereas ellipticals are better fitted with de Vaucouleurs’ type laws (). While the morphological differences between spirals and ellipticals are obvious555when S0’s are not taken into account and ellipticals as a class appear rather similar, they do exhibit significant differences in their profiles (cf. Fig. 7). For instance, Faber et al. (1997) find a correlation between absolute luminosity and profile shape, in the sense that the more massive systems have shallower inner profiles. Less luminous ellipticals have profiles which lack this “core”, and remain steep all the way up the resolution limit. Unfortunately, the physical size scale of this cusp has been found to be on the order of 500 pc, e.g., Lauer et al. (1995); Faber et al. (1997). This “break radius” corresponds to about 1 pixel for our sources (given the redshift range), which is clearly not enough to detect flattening on these scales. We can, however, fit the profile with a generalized de Vaucouleurs’ law (). This exponent also correlates with elliptical type. Following Graham et al. (1996), we define:
| (2) |
with the scale radius, the central surface brightness, and the constant approximated by: . Note that in the case the profile is exponential, and better represents spirals. All our source major axis luminosity profiles were fitted with this law, and a minimization yielded the best fitting values, given in Table 4.
Caon et al. (1993) found a correlation between the effective radius and the exponent , in the sense the galaxies with the smaller ’s also have steeper profiles (lower values of ). They divided the elliptical family into “ordinary” ( 3 kpc, 4), and “bright” ( 3 kpc, 4) classes. Graham et al. (1996) added BCG data to the same plot, confirming the trend. BCGs were found to belong to the “bright” class, and actually have the highest values of (Graham et al., 1996). The data on our sources are overplotted on the literature data in Fig. 7. The GPS/CSO, CSS and large FR II are consistent with having similar values of effective radius and . Most of our sample lies between the “ordinary” and “bright” regions of parameter space. None of the host galaxies in our sample have an exponential () profile, and therefore the radio sources do not seem to reside in spiral hosts. There is an offset between BCGs and our sample objects, i.e., the BCGs tend to have larger effective radii and shallower profiles than the radio source host galaxies.
5.3 The Kormendy Relation


The slope of the – , or Kormendy relation has been found to vary with the mean physical size of the sample under consideration. Initially, Kormendy (1985) established the slope of the relation as , where the fit is made to , and is on the magnitude scale. His sample included a large fraction of (local) small ellipticals and bulges, and not many giant galaxies. Shortly afterwards, Hoessel et al. (1987) noted a significant difference in slope between BCGs and non-BCGs, in the sense non-BCGs display a steeper slope ( 4.5, compared to 3.1 for BCGs). They suggested, among other things, a different formation process for BCGs compared to field ellipticals. Perhaps more relevant to our radio galaxies, various studies on FR I and FR II galaxies find a similar discrepancy between the two. Smith & Heckman (1989) find FR II’s to have steeper profiles than BCGs, while the FR I slope is consistent with the BCG slope. Another telling find is that FR II’s are found to have a lower absolute luminosity (in ) than BCGs (true for F205W as well, cf. Fig. 6), while FR I’s are comparable. Ledlow & Owen (1995) find a steepening in slope going from a sample of radio cD galaxies, to BCGs, to non-BCGs ( 3.3 – 3.8 – 4.0).
In this sense, it is interesting to determine the slope of the galaxies in our sample. Even though our data are in the near-IR and the data in the literature range from to band, the variations in slope as a function of color are found to be rather small; i.e., the zero-points vary, while the slopes do not (e.g., Pahre et al. 1996). In Figs. 8 and 9, we plotted the Kormendy relations for F110W and F205W respectively. We corrected the effective surface brightness for the cosmological dimming. The fits have slopes of 5.20.6 (F110W), and 4.00.5 (F205W) for a de Vaucouleurs’ law ( 4). For the generalized law the values are: 5.20.5 (F110W), and 4.50.4 (F205W).
These values strongly suggest our sample to consist of non-BCG sources. Combined with evidence from the literature on differences between powerful radio sources (FR II’s) and BCGs (e.g., Owen & Laing 1989), differences between FR I and FR II sources (e.g., Smith & Heckman 1989), and similarities between FR I and BCGs (Ledlow & Owen, 1995; Smith & Heckman, 1989), we conclude that GPS/CSO and CSS hosts are similar to FR II hosts but significantly different from at least some FR I hosts. This implies GPS/CSS radio galaxies in general do not evolve into BCG-FR I type sources. However, it is clear that not all FR Is live in BCGs (e.g., Ledlow & Owen 1995).
It will be important to expand this study to include larger numbers of objects, including FR I host galaxies. If future work should suggest that GPS/CSS sources do not evolve into FR Is this would imply the following: either FR I progenitors are not GPS/CSO sources when they are young, or, they are faint GPS/CSO sources and therefore do not enter the powerful radio samples we are studying. In the latter case the FR I sources would have much less radio luminosity evolution than FR II’s.
6 Summary and Conclusions
We present HST/NICMOS observations of 19 powerful radio galaxies spanning a wide range of radio source size and including the GPS/CSO, CSS, and large FR II radio galaxies. We have obtained F110W (J) and F205W (K) band imaging in the NICMOS2 camera. Our results are the following:
-
•
Based on the accurate decomposition of the stellar and AGN components of the host galaxy, we find these radio galaxy hosts are not dominated by a nuclear point source in the near-IR. The nuclear J-K colors do not depend on radio source size or the prominence of the nuclear point source. Thus, any material which obscures the AGN is optically thick at these near-IR wavelengths in all three classes of source.
-
•
The host galaxies of the GPS/CSO, CSS and large FR II are morphologically similar. Many show evidence of interaction with companion objects at differing distances, ranging from the binary nucleus in the southern component of 3C 46, to much wider pairs like 3C 16 and 0941080. Seven galaxies exhibit red nuclei, while some companion galaxies have blue nuclei (companions to 3C 19, 3C 46, 3C 460, 0941080). In nine galaxies, a companion object is found along the radio axis, consistent with the suggestion of West (1994) that in prolate galaxies in the centers of clusters, both the radio source and satellite galaxies will share the same preferred axis.
-
•
The colors of the host galaxy stellar population are in agreement among the radio source classes and are consistent with those of a passively evolving old stellar population. The mean inferred population age and metallicity are 5 Gyr and solar, respectively.
-
•
The absolute magnitude at K band (F205W) is similar for the GPS/CSO, CSS, and FR II host galaxies. The dependence of absolute magnitude on redshift is consistent with simple passive evolution models. On the other hand, a comparison sample of bright BCGs exhibits (1) brighter absolute magnitudes, and (2) perhaps more complex evolution suggesting the accumulation of light (mass) as the galaxies evolve.
-
•
Due to the high angular resolution of HST, we were able, for the first time, to determine meaningful radial profiles of these sources, despite their typical optical sizes of a few arc seconds. The observed range of effective radii and surface brightness profile slopes are in agreement among the three classes of radio source and are consistent with L∗ ellipticals and are inconsistent with those of BCGs. The behavior of the galaxies on the Kormendy relation is also consistent with these results.
-
•
We normalized the radio luminosity by the AGN K band luminosity in order to determine the radio source luminosity evolution as a function of projected source size. The GPS/CSO and CSS sources are consistent with the predicted luminosity evolution. However, the large sources ( 100 kpc) are inconsistent with this evolution. Given the small number of large sources and the large scatter in the points, this question should be re-addressed with a larger sample. If this tentative result is confirmed, it would have significant implications for radio galaxy evolution. One possibility is that the AGN radiative energy output (i.e., band light) drops in the older and larger sources; then the ratio of radio to band luminosity would increase as the sources age relative to the predictions of a constant AGN output model. Another possibility is that radio luminosity evolution slows down in the larger sources. This might be the case if the ambient density profile flattens (O’Dea & Baum, 1997).
In summary, the host galaxies of GPS/CSO, CSS, and FR II galaxies form a uniform class of objects, consistent with the radio source evolutionary scenario. There is some tentative evidence that the GPS/CSO and CSS sources follow the expected radio luminosity evolution, while the very large sources do not.
References
- Akujor & Garrington (1995) Akujor, C. E., & Garrington, S. T. 1995, A&AS, 112, 235
- Antonucci (1993) Antonucci, R., 1993, ARA&A, 31, 473
- Aragón-Salamanca et al. (1993) Aragón-Salamanca, A., Ellis, R. S., Couch, W. J., & Carter D. 1993, MNRAS, 262, 764
- Axon et al. (2000) Axon, D. J., Capetti, A., Fanti, R., Morganti, R., Robinson, A., & Spencer, R. 2000, AJ, in press
- Begelman (1996) Begelman, M. C. 1996, in: “Cygnus A – Study of a Radio Galaxy”, eds. C. Carilli and D. Harris, (Cambridge: Cambridge University Press), 209
- Blandford (1994) Blandford, R. D. 1994, in “The Physics of Active Galaxies”, eds. G. V. Bicknell, M. A. Dopita, & P. J. Quinn, (ASP, Provo), p. 23
- Blundell et al. (1999) Blundell, K. M., Rawlings, S., & Willott, C. J., 1999, AJ, 117, 677
- Bogers et al. (1994) Bogers, W. J., Hes, R., Barthel, P. D., & Zensus, J. A. 1994, A&AS, 105,91
- Bruzual & Charlot (2000) Bruzual, A. G., & Charlot, S. 2000, in preparation
- Burstein & Heiles (1982) Burstein, D., & Heiles, C. 1982, AJ, 87, 1165
- Burstein & Heiles (1984) Burstein, D., & Heiles, C. 1984, ApJS, 54, 33
- Caon et al. (1993) Caon, N., Capaccioli, M., & D’Onofrio, M. 1993, MNRAS, 265, 1013
- Cardelli et al. (1989) Cardelli, J. A., Clayton, G. C., & Mathis, J. S. 1989, ApJ, 345, 245
- Collins & Mann (1998) Collins, C. A., & Mann, R. G. 1998, MNRAS, 297, 128
- Chyzy (1997) Chyzy, K. T., 1997, MNRAS, 289, 355
- Dallacasa et al. (1995) Dallacasa, D., Cotton, W. D., Fanti, C., Fanti, R., Foley, A. R., Schilizzi, R. T., & Spencer, R. E. 1995, A&A, 299, 671
- Dallacasa et al. (1998) Dallacasa, D., Bondi, M., Alef, W., & Mantovani, F. 1998, A&AS, 129, 219
- de Vries et al. (1997) de Vries, W. H., O’Dea, C. P., Baum, S. A., Sparks, W. B., Biretta, J., de Koff, S., Golombek, D., Lehnert, M. D., Macchetto, F., McCarthy, P., & Miley, G. K. 1997a, ApJS, 110, 191
- de Vries et al. (1998a) de Vries, W. H., O’Dea, C. P., Perlman, E., Baum, S. A., Lehnert, M. D., Stocke, J., Rector, T., & Elston, R. 1998a, ApJ, 503, 138 (Paper I)
- de Vries et al. (1998b) de Vries, W. H., O’Dea, C. P., Baum, S. A., Perlman, E., Lehnert, M. D., & Barthel, P. D. 1998a, ApJ, 503, 156 (Paper II)
- de Vries et al. (1999) de Vries, W. H., O’Dea, C. P., Baum, S. A., & Barthel, P. D. 1999, ApJ, 526, 27
- Djorgovski & Davis (1987) Djorgovski, S., & Davis, M. 1987, ApJ, 313, 59
- Eilek & Shore (1989) Eilek, J. A., & Shore, S. N., 1989, ApJ, 342, 187
- Faber et al. (1997) Faber, S. M., Tremaine, S., Ajhar, E. A., Byun, Y-I., Dressler, A., Gebhardt, K., Grillmair, C., Kormendy, J., Lauer, T. R., & Richstone, D. 1997, AJ, 114, 1771
- Fanti et al. (1995) Fanti, C., Fanti, R., Dallacasa, D., Schilizzi, R. T., Spencer, R. E., & Stanghellini, C. 1995, A&A, 302, 317
- Fanti et al. (2000) Fanti, C., Pozzi, R., Fanti, R., Baum, S.A., et al. 2000, A&A, in press (astro-ph/0005035)
- Fey et al. (1996) Fey, A. L., Clegg, A. W., & Fomalont, E. B. 1996, ApJS, 105, 299
- Graham et al. (1996) Graham, A., Lauer, T. R., Colless, M., & Postman, M. 1996, ApJ, 465, 534
- Harvanek & Hardcastle (1998) Harvanek, M., & Hardcastle, M. J. 1998, ApJS, 119, 25
- Heckman et al. (1994) Heckman, T. M., O’Dea, C. P., Baum, S. A., & Laurikainen, E. 1994, ApJ, 428, 65
- Hoessel et al. (1987) Hoessel, J. G., Oegerle, W. R., & Schneider, D. P. 1987, AJ, 94, 1111
- Jenkins et al. (1977) Jenkins, C. J., Pooley, G. G., & Riley, J. M. 1977, MemRAS, 84, 61
- Kaiser et al. (1997) Kaiser, C. R., Dennett-Thorpe, J., & Alexander, P., 1997, MNRAS, 292, 723
- Kormendy (1977) Kormendy, J. 1977, ApJ, 214, 359
- Kormendy (1985) Kormendy, J. 1985, ApJ, 295, 73
- Laing et al. (1983) Laing, R. A., Riley, J. M., & Longair, M. S. 1983, MNRAS, 204, 151
- Lauer et al. (1995) Lauer, T. R., Ajhar, E. A., Byun, Y-I., Dressler, A., Faber, S. M., Grillmair, C., Kormendy, J., Richstone, D., & Tremaine, S. 1995, AJ, 110, 2622
- Lawrence et al. (1996) Lawrence, C. R., Zucker, J. R., Readhead, A. C. S., Unwin, S. C., Pearson, T. J., & Xu, W. 1996, ApJS, 107, 541
- Leahy & Perley (1991) Leahy, J. P., & Perley, R. A. 1991, AJ, 102, 537
- Ledlow & Owen (1995) Ledlow, M. J., & Owen, F. N. 1995, AJ, 110, 1959
- McCarthy et al. (1991) McCarthy, P. J., van Breugel, W., & Kapahi, V. K. 1991, ApJ, 371, 478
- McCarthy (1993) McCarthy, P. J. 1993, ARA&A, 31, 639
- McCarthy et al. (1995) McCarthy, P. J., Spinrad, H., & van Breugel, W. J. M. 1995, ApJS, 99, 27
- Neff et al. (1995) Neff, S. G., Roberts, L., & Hutchings, J. B. 1995, ApJS, 99, 349
- O’Dea et al. (1991) O’Dea, C. P., Baum, S. A., & Stanghellini, C. 1991, ApJ, 380, 66
- O’Dea et al. (1996) O’Dea, C. P., Stanghellini, C., Baum, S. A., & Charlot, S. 1996, ApJ, 470, 806
- O’Dea & Baum (1997) O’Dea, C. P., & Baum, S. A. 1997, AJ, 113, 148
- O’Dea (1998) O’Dea, C. P., 1998, PASP, 110, 493
- Owen & Laing (1989) Owen, F. N., & Laing, R. A. 1989, MNRAS, 238, 357
- Owen & White (1991) Owen, F. N., & White, R. A. 1991, MNRAS, 249, 164
- Pahre et al. (1996) Pahre, M. A., Djorgovski, S. G., & De Carvalho, R. R. 1996, ApJ, 456, L79
- Polatidis et al. (1995) Polatidis, A. G., Wilkinson, P. N., Xu, W., Readhead, A. C. S., Pearson, T. J., Taylor, G. B., & Vermeulen, R. C. 1995, ApJS, 98, 1
- Readhead et al. (1996a) Readhead, A. C. S., Taylor, G. B., Xu, W., Pearson, T. J., Wilkinson, P. N., & Polatidis, A. G. 1996a, ApJ, 460, 612
- Readhead et al. (1996b) Readhead, A. C. S., Taylor, G. B., Pearson, T. J., & Wilkinson, P. N. 1996b, ApJ, 460, 634
- Sanghera et al. (1995) Sanghera, H. S., Saikia, D. J., Lüdke, E., Spencer, R. E., Foulsham, P. A., Akujor, C. E., & Tzioumis, A. K. 1995, A&A, 295, 629
- Smith & Heckman (1989) Smith, E. P., & Heckman, T. M. 1989, ApJ, 341, 658
- Snellen et al. (1996) Snellen, I. A. G., Bremer, M. N., Schilizzi, R. T., Miley, G. K., & van Oijk, R., 1996, MNRAS, 279, 1294
- Snellen et al. (1999) Snellen, I. A. G., Schilizzi, R. T., Bremer, M. N., Miley, G. K., de Bruyn, A. G., & Rottgering, H. J. A., 1999, MNRAS, 307, 149
- Spinrad et al. (1995) Spinrad, H., Dey, A., & Graham, J. R. 1995, ApJ, 438, L51
- Stickel et al. (1996) Stickel, M., Rieke, M. J., Rieke, G. H., & Kühr, H. 1996, A&A, 306, 49
- Taylor et al. (1994) Taylor, G. B., Barton, E. J., & Ge, J. 1994, AJ, 107, 1942
- Thompson et al. (1998) Thompson, R. I., Rieke, M., Schneider, G., Hines, D. C., & Corbin, M. R., 1998, ApJ, 492, L95
- Urry & Padovani (1995) Urry, C. M., & Padovani, P., 1995, PASP, 107, 803
- West (1994) West, M. J., 1994, MNRAS, 268,79
| Source | ID | A(B)aaValue based on Burstein & Heiles HI maps. | exp.time | F110W magbbOne errors. | F205W magbbOne errors. | |
|---|---|---|---|---|---|---|
| 3C 16 | FR2 | 0.405 | 0.17 | 2640 | 18.810.01 | 16.980.02 |
| 3C 19 | FR2 | 0.482 | 0.28 | 2640 | 18.490.02 | 16.710.02 |
| 3C 42 | FR2 | 0.395 | 0.22 | 2640 | 17.820.01 | 15.990.01 |
| 3C 46 | FR2 | 0.437 | 0.21 | 2640 | 18.060.01 | 15.940.01 |
| 3C 46bccInteracting companion galaxy. | FR2 | 0.437 | 0.21 | 2640 | 18.140.02 | 16.760.03 |
| 3C 67 | CSS | 0.310 | 0.30 | 2640 | 17.550.01 | 15.990.01 |
| 3C 93.1 | CSS | 0.243 | 0.77 | 2640 | 16.360.01 | 14.840.01 |
| 0404+768 | GPS/CSO | 0.599 | 0.58 | 2704 | 18.250.03 | 16.040.01 |
| 0428+205 | GPS/CSO | 0.219 | 1.70 | 2640 | 16.180.02 | 14.510.01 |
| 0500+019 | GPS/CSO | 0.583 | 0.29 | 2640 | 18.970.03 | 16.620.01 |
| 0710+439 | GPS/CSO | 0.518 | 0.30 | 2640 | 18.070.02 | 16.120.01 |
| 3C 200 | FR2 | 0.458 | 0.08 | 2640 | 17.630.01 | 15.790.01 |
| 0941080 | GPS | 0.228 | 0.08 | 2640 | 16.870.01 | 15.240.01 |
| 0941080ccInteracting companion galaxy. | GPS | 0.228 | 0.08 | 2640 | 17.620.01 | 16.340.02 |
| 3C 268.3 | CSS | 0.371 | 0.03 | 2640 | 17.980.01 | 15.490.01 |
| 1323+321 | GPS | 0.369 | 0.02 | 2640 | 17.910.02 | 15.990.01 |
| 3C 303.1 | CSS | 0.267 | 0.08 | 2704 | 16.880.01 | 15.340.01 |
| 3C 456 | FR2 | 0.233 | 0.08 | 2640 | 17.010.01 | 15.200.01 |
| 3C 458ddMost likely misidentified. | FR2 | 0.289 | 0.19 | 2640 | 20.730.06 | 19.510.08 |
| 3C 460 | FR2 | 0.268 | 0.17 | 2640 | 17.190.01 | 15.370.01 |
| 3C 460bccInteracting companion galaxy. | FR2 | 0.268 | 0.17 | 2640 | 18.250.02 | 17.040.03 |
| 2342+821 | GPS/CSO | 0.735 | 0.78 | 2704 | 17.620.01 | 16.240.01 |
| 2352+495 | GPS/CSO | 0.237 | 0.71 | 2640 | 16.660.01 | 15.150.01 |
| Source | P.A.aaPosition angle, measured North through East. | SizebbRadio angular size in arcseconds. | Ref | Source | P.A.aaPosition angle, measured North through East. | SizebbRadio angular size in arcseconds. | Ref | Source | P.A.aaPosition angle, measured North through East. | SizebbRadio angular size in arcseconds. | Ref |
|---|---|---|---|---|---|---|---|---|---|---|---|
| 3C 16 | 35 | 75 | 1 | 0428+205 | 24 | 0.25 | 6 | 3C 303.1 | 50 | 2.5 | 9 |
| 3C 19 | 30 | 12 | 2 | 0500+019 | 7 | 0.03 | 7 | 3C 456 | 17 | 12 | 10 |
| 3C 42 | 49 | 36 | 3 | 0710+439 | 0 | 0.03 | 8 | 3C 460 | 36 | 6 | 11 |
| 3C 46 | 68 | 150 | 4 | 3C 200 | 28 | 25 | 1 | 2342+821 | 70 | 0.20 | 6 |
| 3C 67 | 5 | 4 | 5 | 0941080 | 32 | 0.06 | 7 | 2352+495 | 18 | 0.08 | 12 |
| 3C 93.1 | 19 | 0.25 | 6 | 3C 268.3 | 20 | 2 | 9 | ||||
| 0404+768 | 45 | 0.15 | 6 | 1323+321 | 47 | 0.08 | 6 |
References. — 1) Bogers et al. 1994, 2) Jenkins et al. 1977, 3) Leahy et al. 1991, 4) Neff et al. 1995, 5) Sanghera et al. 1995, 6) Dallacasa et al. 1995, 7) Dallacasa et al. 1998, 8) Fey et al. 1996, 9) Akujor et al. 1995, 10) Harvanek & Hardcastle 1998, 11) McCarthy et al. 1995 + McCarthy et al. 1991, 12) Polatidis et al. 1995
| F110WaaMaximum luminosity fraction attributable to unresolved nuclear component (%), based on fits to the peak flux; and modeled fraction (%) as described in the text. Fractional uncertainties are large, and should be taken on the order of a few percent. | F205WaaMaximum luminosity fraction attributable to unresolved nuclear component (%), based on fits to the peak flux; and modeled fraction (%) as described in the text. Fractional uncertainties are large, and should be taken on the order of a few percent. | |||||||
|---|---|---|---|---|---|---|---|---|
| Source | % | % | % | % | F110W | F205W | F110W | F205W |
| 3C 16 | 10 | 1 | 18 | 1 | 18.810.01 | 16.980.02 | 232 | 212 |
| 3C 19 | 6 | 1 | 11 | 1 | 18.500.02 | 16.710.02 | 232 | 212 |
| 3C 42 | 6 | 2 | 10 | 1 | 17.840.02 | 16.000.02 | 22.10.8 | 20.71.2 |
| 3C 46 | 4 | 1 | 7 | 1 | 18.060.01 | 15.940.01 | 232 | 212 |
| 3C 46bbbInteracting companion galaxy. | 7 | 3 | 19 | 3 | 18.170.01 | 16.800.03 | 22.10.7 | 20.60.7 |
| 3C 67 | 27 | 34 | 41 | 24 | 18.010.01 | 16.280.01 | 18.720.08 | 17.550.11 |
| 3C 93.1 | 7 | 8 | 15 | 7 | 16.460.01 | 14.910.01 | 19.070.29 | 17.750.34 |
| 0404+768 | 24 | 14 | 37 | 22 | 18.420.04 | 16.310.01 | 20.350.17 | 17.690.12 |
| 0428+205 | 4 | 2 | 7 | 3 | 16.200.02 | 14.540.01 | 20.50.9 | 17.20.8 |
| 0500+019 | 33 | 26 | 42 | 26 | 19.300.03 | 16.940.02 | 20.430.10 | 18.090.10 |
| 0710+439 | 16 | 16 | 27 | 15 | 18.260.02 | 16.290.01 | 20.060.16 | 18.170.17 |
| 3C 200 | 8 | 6 | 13 | 5 | 17.700.01 | 15.850.01 | 20.60.4 | 19.00.4 |
| 0941080 | 5 | 4 | 9 | 2 | 16.920.01 | 15.260.01 | 20.30.5 | 19.61.0 |
| 0941080bbbInteracting companion galaxy. | 9 | 1 | 22 | 1 | 17.620.02 | 16.340.02 | 232 | 212 |
| 1323+321 | 16 | 14 | 16 | 7 | 18.070.02 | 16.070.01 | 20.070.18 | 18.880.33 |
| 3C 268.3 | 42 | 17 | 66 | 44 | 18.180.02 | 16.110.01 | 19.900.15 | 16.400.06 |
| 3C 303.1 | 5 | 1 | 10 | 3 | 16.890.01 | 15.380.01 | 232 | 19.10.6 |
| 3C 456 | 10 | 6 | 30 | 14 | 17.080.01 | 15.360.01 | 20.00.4 | 17.370.18 |
| 3C 460 | 4 | 1 | 10 | 1 | 17.190.01 | 15.330.01 | 232 | 212 |
| 3C 460bbbInteracting companion galaxy. | 7 | 1 | 17 | 6 | 18.250.02 | 17.110.03 | 232 | 20.90.4 |
| 2342+821 | 34 | 37 | 54 | 26 | 18.110.02 | 16.580.01 | 18.700.07 | 17.690.10 |
| 2352+495 | 7 | 4 | 15 | 1 | 16.700.01 | 15.150.01 | 20.20.5 | 212 |
| F205WaaR is the effective radius (in kpc) of the applied r-law, is the corresponding effective surface brightness, and is the observed central surface brightness within a 1 pixel radius of the nucleus. The exponent of the best fitting law is given by n. | F110WaaR is the effective radius (in kpc) of the applied r-law, is the corresponding effective surface brightness, and is the observed central surface brightness within a 1 pixel radius of the nucleus. The exponent of the best fitting law is given by n. | |||||||
|---|---|---|---|---|---|---|---|---|
| Source | R | n | R | n | ||||
| 3C 16 | 3.310.25 | 18.370.17 | 15.97 | 3.700.57 | 2.220.07 | 19.470.07 | 17.57 | 2.260.13 |
| 3C 19 | 4.170.37 | 18.460.21 | 16.17 | 2.960.51 | 3.230.07 | 19.900.05 | 17.72 | 2.050.10 |
| 3C 42 | 8.820.50 | 19.510.12 | 15.64 | 4.060.57 | 5.080.14 | 20.410.06 | 17.21 | 3.240.17 |
| 3C 46 | 16.40.91 | 20.570.11 | 15.85 | 6.190.80 | 3.190.09 | 19.460.07 | 17.57 | 1.520.08 |
| 3C 46bbbInteracting companion galaxy. | 2.560.05 | 17.490.05 | 15.76 | 1.660.08 | 3.320.12 | 19.750.09 | 17.23 | 3.050.21 |
| 3C 67 | 1.680.10 | 16.480.17 | 14.36 | 3.090.40 | 1.360.05 | 17.750.11 | 15.65 | 2.190.14 |
| 3C 93.1 | 4.410.13 | 17.850.07 | 14.14 | 3.670.29 | 4.960.30 | 20.010.13 | 15.79 | 6.180.77 |
| 0404+768 | 3.180.42 | 17.380.31 | 14.52 | 7.542.67 | 2.620.17 | 19.310.17 | 16.84 | 2.330.27 |
| 0428+205 | 8.810.30 | 19.140.07 | 14.68 | 4.390.40 | 4.460.20 | 19.920.10 | 16.40 | 2.800.30 |
| 0500+019 | 3.110.45 | 17.730.30 | 14.94 | 5.241.31 | 2.970.22 | 20.100.17 | 17.40 | 3.040.38 |
| 0710+439 | 4.520.27 | 18.110.14 | 14.94 | 3.570.46 | 3.040.11 | 19.400.09 | 16.69 | 2.330.15 |
| 3C 200 | 4.180.22 | 17.710.13 | 15.15 | 3.860.48 | 3.390.04 | 19.010.03 | 16.82 | 1.340.05 |
| 0941080 | 4.220.11 | 17.980.06 | 15.02 | 2.450.15 | 3.070.08 | 18.980.07 | 16.20 | 1.790.11 |
| 0941080bbbInteracting companion galaxy. | 1.480.06 | 16.790.12 | 15.14 | 2.470.23 | 1.700.14 | 18.690.20 | 16.39 | 9.151.27 |
| 3C 268.3 | 0.410.21 | 12.751.37 | 13.41 | 107 | 0.460.21 | 15.651.20 | 15.88 | 107 |
| 1323+321 | 4.300.13 | 18.140.08 | 15.25 | 2.410.18 | 2.450.05 | 18.990.05 | 16.47 | 2.710.09 |
| 3C 303.1 | 4.630.12 | 18.110.06 | 14.96 | 3.000.19 | 3.580.06 | 19.150.04 | 16.42 | 2.210.08 |
| 3C 456 | 1.430.09 | 15.780.16 | 13.82 | 5.780.81 | 1.980.03 | 18.250.04 | 15.82 | 2.470.08 |
| 3C 460 | 4.180.12 | 17.920.07 | 15.00 | 3.360.24 | 3.120.05 | 19.140.04 | 16.72 | 2.220.07 |
| 3C 460bbbInteracting companion galaxy. | 2.040.07 | 17.780.10 | 16.10 | 1.350.09 | 2.730.28 | 19.840.23 | 17.38 | 2.450.48 |
| 2342+821 | 1.410.18 | 15.530.40 | 14.39 | 3.230.83 | 0.440.05 | 14.490.34 | 15.72 | 6.901.32 |
| 2352+495 | 2.520.06 | 16.930.06 | 14.42 | 4.010.23 | 2.190.03 | 18.320.03 | 15.86 | 2.600.07 |