Modeling the X-ray – UV Correlations in NGC 3516
Abstract
We test the “reprocessing paradigm” of the optical – UV AGN variability, according to which the variations in this wavelength range are driven by a variable X-ray component, by detailed modeling of the correlated X-ray – optical ( 3590 and 5510 Å) variability of the recent multiwavelength campaign of NGC 3516. To this end we produce model optical light curves by convolving the observed X-ray flux with the response function of an infinite, thin accretion disk, illuminated by a point-like X-ray source at a given height above the compact object (the lamp-post model) and compare their properties (amplitude, morphology, lags) to those observed. Special attention is given to the correct computation of the X-ray albedo of the disk, by including an X-ray heated ionized layer in hydrostatic equilibrium on its surface. We further compute the X-ray reflection response at two energies ( keV) and argue for the possibility of hard lags in their cross spectra. We also compute the continuum Optical – UV and the X-ray reflection spectra as well as the Fe K fluorescent line profiles which we also compare to observations. Despite the large () amplitude excursions of the X-ray flux, the model optical light curves exhibit variability amplitudes of 3 – 4 %, not unlike those observed. The model light curves exhibit clearly a feature associated with a large X-ray flux excursion not seen in the data, arguing for a reprocessing region of size cm, even though no lags are discernible in the cross correlation functions (CCF) of the 3590 and 5510 Å model light curves. However, the (CCF) between the X-ray and the model optical variations show clear lags of 0.1 and 0.25 days for black hole masses M⊙ respectively, not apparent in the data. The synchrony of X-ray - optical variations points toward the smaller mass values ( M⊙), which however are inconsistent with the model X-ray reflection spectra which exhibit several features below 4 keV and above keV not observed in the data. In fact, the model X-ray reflection spectra are roughly consistent with observations only for M⊙. The observed Fe K line profiles are too broad to be consistent with our models. Lowering the distance of the X-ray source from the disk, , helps a little in this respect, but only at the expense of reducing unrealistically the amplitude of Optical–UV variations. Our conclusion is that the combination of the observed optical/UV/X-ray spectral and timing observations are inconsistent with the lamp-post model geometry for NGC 3516.
submitted to Astrophys. J.
1 Introduction
A great deal of effort and observing time has been expended in the past decade or so in a systematic effort to “map” the central regions of Active Galactic Nuclei (hereafter AGN). Because the relevant sizes are too small to image with current technology, the attempted “mapping” has been effected through the time reverberation technique, i.e., the monitoring of the system in response to fluctuations in luminosity across the electromagnetic spectrum and the comparison of the relative amplitudes and lags between different wavelengths to models.
While the original reverberation effort was aimed at estimating the size of the broad line region (BLR) by measuring the lags between variations in the ionizing continuum and the broad emission lines (see Netzer & Peterson 1997 for a review), it was quickly realized that the same data could also be used to test models of the continuum emission itself by measuring the lags between variations in the UV and optical flux. The AGN optical – UV (hereafter O – UV) continuum is generally dominated by a broad quasi-thermal component, the so-called Big Blue Bump (hereafter BBB), thought to be due to – and modeled as – the emission of a geometrically thin, optically thick accretion disk radiating in black body form the locally dissipated accretion kinetic energy (Malkan & Sargent 1983; Malkan 1984; Laor & Netzer 1989; Sun & Malkan 1989). Thus, monitoring the O – UV continuum variability and the corresponding interband lags, places constraints on the models of such accretion disks.
It became apparent early on in this extensive mapping effort that the interband lags between optical and UV wavelengths were far shorter than those expected by most modes of information propagation in a thin accretion disk (the lags of the earlier campaigns were generally shorter than the sampling rates). This situation prompted the suggestion that the correlated O – UV continuum variability is due entirely to reprocessing of the more variable X-ray component by the geometrically thin accretion disk responsible for the emission associated with the BBB feature (Krolik et al 1991). This suggestion appeared to also fit nicely with the evidence of X-ray reflection by cold matter in AGN (Pounds et al. 1990) and the presence of relativistically broadened Fe K lines (e.g., Tanaka et al. 1995; see also a recent review by Fabian et al. 2000).
Thus, a “picture” of the innermost regions of accreting black holes began to emerge, consisting of a geometrically thin, optically thick accretion disk radiating away the dissipated kinetic energy in black body form, supplemented by an X-ray source located at a height of a few Schwarzschild radii above the disk (or modeled as a spherical source occupying the inner part of the disk). The disk’s soft photons were then thought to be the seed photons that in interactions with the electrons of the hot corona produce the observed X-rays, which are in turn reprocessed by the disk to provide the X-ray reflection feature, the Fe K line, as well as the observed rapid, inter band variability between the optical and UV wavelengths.
While fits to the observed X-ray spectra within the general framework of this arrangement seem to be in good agreement with observations, as well known, spectra generally provide information about column densities and optical depths rather than about densities and actual lengths, which are the quantities needed to confirm the actual geometry of the X-ray – UV – O emission. Verification of the precise geometrical arrangement requires a “mapping” of this geometry through timing observations. Such a (so-called) reverberation mapping requires sufficiently high data sampling rate, set by the light crossing time from the X-ray source to the reprocessing disk. For a source size a few Schwarzschild radii of a M⊙ black hole, this time scale (assuming that the source is located several Schwarzschild radii above the disk) is of order of sec. At the same time, the monitoring campaign has to be of sufficiently long duration to sample a large number of peaks and troughs to produce a reliable interband cross correlation.
There have been to date two monitoring campaigns specifically planned to comply with these criteria, namely those of NGC 7469 (Nandra et al. 1998, 2000) and of NGC 3516 (Edelson et al. 2000). Earlier coordinated multiwavelength observations, while forming a rather extended data base (see Nandra et al. 1998 for a summary), were deemed of inadequate sampling rate to provide conclusive results. The results of the NGC 7469 campaign (Nandra et al. 1998) were puzzling in that they indicated no clear correlation between the X-ray variations and that of UV emission, while the flux in both bands exhibited 50% variations in amplitude. At the same time there were clearly detected lags between the UV (1315 Å) and the optical (6962 Å) emission or order of 1–2 days (Collier et al. 1998). Revisiting these observations, Nandra et al. (2000) have indicated that the softening of the X-ray spectrum with increasing UV flux underestimated the soft X-ray emission. Taking this fact into consideration, they showed that the long term ( day) variations in the UV and X-ray bands were in fact “in synch” with each other. However, the X-rays exhibited in addition strong variations on time scales of sec which had absolutely no counterpart in the UV or optical light curves.
Motivated by these results, Berkley, Kazanas & Ozik (2000; hereafter BKO), examined in detail these observations in the framework of the “disk reprocessing model”: They produced simulated UV – O light curves using the observed X-ray light curves as input in a geometric arrangement of a point X-ray source at a given distance above the plane of a disk, as thought to be the situation in AGN. Their conclusions were that for any reasonable estimate of the black hole mass ( M⊙), both the UV (1315 Å) and the optical (6962 Å) emission should follow closely that of the X-rays. The short time sec) X-ray variability was always present in the model reprocessed emission, with almost undetectable ( day) lags in the cross correlation function of the simulated UV – O light curves, in disagreement with the results of Collier et al. (1998). However, they also found that if the reprocessing was driven by a component with light curve similar to that of the UV rather than the X-ray emission (i.e. it contained no high frequency variations), then the reprocessed emission could indeed produce a CCF with UV – O lags of order of a day, in rough agreement with Collier et al. (1998), provided that the X-ray source was located at a height of cm above the disk plane.
In the present paper we present an analysis of the campaign results of NGC 3516 (Edelson et al. 2000) similar to that of NGC 7469 given in BKO. However, the present analysis is more complete in several respects: (a) The albedo of the illuminated disk is computed (rather than assumed to be small) using the analysis of Nayakshin, Kazanas & Kallman (2000; hereafter NKK) which takes into account the effects of an ionized “skin” on the surface of the disk induced by the action of X-rays. (b) The effect of the presence of the black hole, more precisely the absence of reprocessing in a region of size underneath the X-ray source is taken into account. (c) The calculation of the simulated light curves includes a constant component, associated with the intrinsic emission by the geometrically thin accretion disk, of flux consistent with observations. The main effect of this component is to reduce the variability amplitude. (d) We compute “standard” accretion disk O–UV continuum spectra for the values of the mass and accretion rate obtained from the best fits of the model light curves which we then compare to observations. (e) We also compute the full X-ray reflection spectra which, by comparison to those observed by Nandra et al. (1999), yield additional constraints to the value of the black hole mass and the disk inclination. The combination of timing and spectral fits yields constraints which are generally not commensurate with each other, thereby excluding, as it will be discussed below, the simplest form of this specific model.
Our paper is structured as follows: §2 contains a description of the physics involved in the reprocessing of X-rays by a thin disk in hydrostatic equilibrium and also the method for the approximate computation of the X-ray albedo for different X-ray energies under these circumstances. Using the results of the albedo computation, §3 presents the response functions of the reflected X-rays at two different energies, in order to exhibit the X-ray energy dependence of this effect. In §4 simulated light curves, due to reprocessing of the X-rays observed in NGC 3516, are produced for the wavelengths used in the monitoring campaign; their cross correlation functions as well as those with the X-rays are computed and compared to those observed. In §5 we exhibit model O–UV continuum spectra for different values of our system parameters, which we compare to those observed. We also compute the associated X-ray reflection spectra, with particular emphasis in the X-ray reflection and Fe K line features, which are compared to those observed. Finally in §6 the results are summarized and conclusions are drawn.
2 Disk X-Ray Illumination and Albedo
A self-consistent calculation of the integrated X-ray scattering albedo, , is important because the amount of the thermalized radiation emitted in UV – O band is a function of the X-ray albedo: the amount of the UV – O flux, , due to reprocessing of the incident X-ray flux, , is
| (1) |
It has been argued in the past that, because the typical Seyfert 1 spectra exhibit reflection continuum and Fe K line features consistent with reflection by neutral matter, the albedo of the reflector is (e.g., Magdziarz & Zdziarski 1995), and therefore it is entirely justifiable to assume this to be essentially its correct value.
However, the recent calculations of NKK show that an ionized skin forms on the surface of an X-ray irradiated disk that could greatly influence both the albedo and the reflected spectra. In particular, when the skin is completely ionized, the spectra may appear to result from reflection by neutral-like matter because the skin itself does not leave any atomic physics imprints on the spectra, with the Compton reflection “hump” and the keV Fe K line then formed in the underlying cold, neutral matter. In other words, the fact that one often sees neutral-like reflection and Fe lines in Seyfert 1’s does not necessarily mean that the reflector is neutral and that the albedo . In fact, results of NKK show that the completely ionized skin can yield albedo reaching very high values, such that , with the resulting iron line still peaked at keV, albeit with a smaller equivalent width (EW). More recently, Nayakshin & Kallman (2000) showed that in the lamp-post geometry, the skin is almost never completely ionized, which means that situations with and EW few hundred eV (as observed in NGC 3516 by Nandra et al. 1999) are possible. Therefore, it does appear that an optically thick X-ray heated skin may in fact be present in NGC 3516, and hence we need to include it in our considerations below.
2.1 Thomson depth of the ionized “skin”
Because of the large computational overhead in the exact determination of the integrated X-ray albedo in a time-dependent X-ray reflection problem, we compute the albedo in an approximate way (the spectra for static situation are calculated “exactly” in §5). The first step in such a calculation is to determine the Thomson depth of the skin, (for every radius). Here we follow the method of Nayakshin (2000) with some modifications that extend the region of validity of his results. In particular, Nayakshin (2000) assumed for simplicity that the radiation field is roughly constant within the skin. Strictly speaking, this assumption is appropriate only when , where is the cosine of the incident angle for the X-rays. Instead of this, we now use the following iterative procedure: (1) Assume an initial value for the Thomson depth of the skin and calculate the radiation field within the skin with the approximate methods discussed in Sobolev (1975) and described in some detail in §2.2; (2) Find the gas pressure at the bottom of the skin (where , see Nayakshin & Kallman 2000); (3) Determine the geometrical location of the bottom of the skin, ; (4) Integrate the hydrostatic balance equation from the bottom up to obtain a new value for the “skin” Thomson depth; (5) Repeat the above steps until the procedure converges. This iterative calculation is in fact similar to the iterative scheme that one uses to solve the problem with “exact” numerical methods (e.g., NKK). However, the difference is that here we do not compute the ionization structure of the skin (it is assumed completely ionized) and hence can perform the transfer of radiation analytically, reducing the computation time from hours to seconds. We will report details of this approximation in a separate future publication. These modifications allow us to treat the optically thick situations and also arbitrary incidence angles.
2.2 Approximate radiation transfer
We assume that the illuminated gas consists of two layers, of which the top one is completely ionized while the bottom one neutral. We can then follow the methods described in Sobolev (1975), developed for the treatment of radiation transfer in the atmospheres of planets. In this approach, Compton scattering is assumed to be monochromatic (justifiable here since the photon energies we consider are much smaller than and the skin temperature is only few keV). The cold, neutral medium of the bottom layer is ascribed an albedo , appropriate to neutral matter (). Following the derivation given in Chapter 8 of Sobolev (1975), especially his §8.6, one can easily derive an approximate expression for the distribution of the radiation field at any depth within a skin of a given Thomson depth . This local radiation field determines the Compton temperature and the angle-integrated intensity of the radiation, which are needed in steps (2) and (4) of the iterative procedure of the calculation of described above.
The same procedure can be also used for the approximate calculation of the energy dependence of the reflected X-ray intensity by using an albedo for the bottom, neutral layer which is energy dependent. Because we know from our earlier, exact calculations (see NKK), that the temperature of this layer is always sufficiently low that the gas is weakly ionized, one can simply use the albedo of the neutral matter, given, for example, by Magdziarz & Zdziarski (1995). The reflected X-ray flux at an energy is then given by equation 8.100 of Sobolev (1975, with his because we assume that the scattering is isotropic), with the albedo as given by Magdziarz & Zdziarski (1995), and the notation changed appropriately to ours (e.g., , etc.). Clearly, this approach is not accurate for sharp spectral features, such as the Fe K line, or for high photon energies, i.e., keV or so, but it is nonetheless adequate for our purposes (see §3).
2.3 The Albedo
Using the radiative transfer approach described in §2.2, it is easy to show that the albedo due to the Compton scatterings in the skin is given by
| (2) |
where is the cosine of the incidence angle, while the total Thomson depth of the skin. This expression assumes that all the X-rays incident on the cold material below the ionized skin are absorbed. In reality, 10-20 % is reflected (see MZ95), and thus we approximate this situation by writing
| (3) |
where is the integrated albedo of the cold material, which we assume to have the value . The above approximate expression has the correct behavior for both optically thin (i.e., , when ) and thick limits () and will suffice for our present study.
3 The X-Ray Reflection Response
With an approximate expression for the reflected X-ray intensity at hand we can now discuss the response of the X-rays reflected (rather than reprocessed) by the disk as a function of photon energy. To simplify the treatment we will consider the response at only two photon energies, namely and keV. The lower value is representative of the behavior of soft X-rays that are largely absorbed by the neutral reflector (but may be reflected if ), whereas the higher one is representative of the behavior of hard photons that are mostly reflected rather than absorbed. It is of interest to examine whether such a different behavior would result in effects between these two bands which could be observed in the time domain. Even though no such analysis has been done for the multiwavelength campaign data of NGC 3516 that we are discussing here, we point out that these timing correlations within the X-ray band itself are an important property of the model and future observations should be planned as to extract these correlations in addition to those of the O–UV band with the X-rays.
The geometry of the source considered herein is identical to that discussed in BKO: A point-like X-ray source located at a height above the accretion disk and in particular above the compact object (i.e. the lamp-post model). To present a more precise treatment than BKO we also consider that the reprocessing surface does not extend to the foot of the vertical from the X-ray source onto the disk plane, but only to three Schwarzschild radii, . The presence of the black hole, or rather the absence of the reprocessing disk at radii is of some significance for the response function, especially when ; under these conditions both the minimum lag associated with X-ray reprocessing off the accretion disk and the fraction of the disk reprocessed X-ray luminosity are significantly different from the case that no such hole is present. Finally, as in BKO, the observer is considered to be at a position of latitude above the disk.
As shown in BKO the response function of an infinite plane to an X-ray source at a height in the direction of the observer (at latitude ), as a function of the time lag and the radial distance from the black hole, is
| (4) |
where and are the leading and trailing lags respectively at which the ellipses of constant lag (the intersection of paraboloids of constant lag with the disk plane) intersect the circle of a given constant radius (constant X-ray flux). The quantities and are given by the expressions
| (5) | |||||
| (6) |
The reflected X-ray flux, , at a given radius depends on the local angle specific albedo , which, as discussed above, is a function of both the X-ray energy and the observer latitude angle . The expression for is
| (7) |
where is the luminosity of the X-ray source, which is a function of time. Then, the reflected X-ray luminosity as a function of time, , is obtained by integrating the reflected X-ray flux over all lags and over the entire area of the disk. Due to the energy dependence of the albedo the above quantity depends on the energy of the X-ray photons. Thus,
| (8) |
The presence of a minimum disk radius at affects the lower limit of the lower limit, , of the time integration in the above equation, which is given by the maximum value of and . The effects of the absence of the disk at are then taken into account by considering the proper lower limit and that the integral is zero when . As in BKO the time and lags are measured here in units of .
In order to assess the effects of the different parameters associated with the calculation of the albedo and the disk – X-ray source geometry on the X-ray reflection by the disk, we present its response, i.e. the flux as a function of time resulting from a narrow – in time – pulse of X-rays for a variety of combinations of these parameters. Because the albedo is in addition a function of the X-ray photon energy, we also consider in each case the disk response at two different photon energies, namely keV.
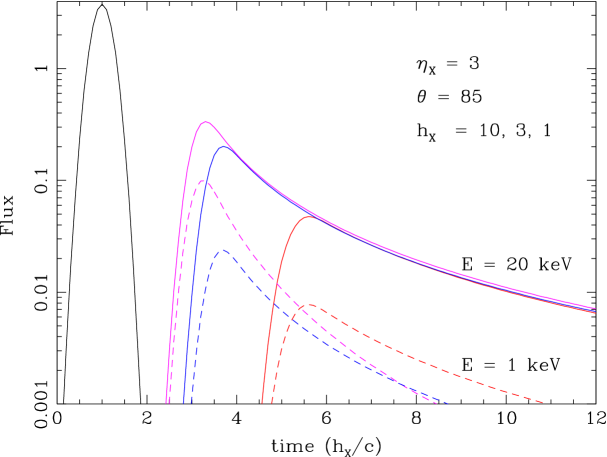
The form of the X-ray pulse assumed is that of a Gaussian of unit area, i.e. . The pulse width is a free parameter taking (in units of ) the values . The other parameters used are the ratio of the X-ray to disk luminosities, , the latitude angle of the observer, , and the height, , of the X-ray source above the disk plane (in Schwarzschild radii). While the mass of the black hole does not figure in the geometry of X-ray scattering it is implicitly involved in the computation of the albedo, because it determines the absolute value of the X-ray flux on the disk surface, which in turn determines its temperature. In all the runs presented in this section the black hole mass was held constant at the value M⊙, while the value of was kept at in units of the Eddington value, yielding a luminosity in general agreement with that of NGC 3516.
Figure 1 presents the response function of a nearly face-on disk ( degrees) of for three different values of the X-ray source height (in descending order in the figure) and for two different X-ray photon energies keV (solid curves) and keV (dashed curves), along with the input impulse of width . The figure exhibits clearly the strong dependence of the albedo on the photon energy. Also apparent is the effect of decreasing the X-ray source height on both the response amplitude and lag at which the response peaks. This effect is due to the absence of reprocessing matter at . Because the disk albedo at photon energy keV is almost independent of the incidence – reflection geometry and structure of the ionized skin on the disk surface (see upper panel of fig. 7 of NKK), the response curves overlap at large values of the time (lag). This is clearly not the case with the lower energy photons ( keV), for which the shape of the response changes significantly with , because of the dependence of the value of on this parameter.
The difference in response between the X-ray photons of different energies suggests that the presence of the cold disk in the vicinity of the X-ray source would modify the spectrum of the observed radiation, in the sense that the ratio of soft to hard photons received by the observer at infinity will be smaller than that produced by the source, due to the larger fraction of soft photons absorbed by the disk. This produces the well known “reflection” component (Basko et al. 1974; Lightman & White 1988; Magdziarz & Zdziarski 1995), which has apparently been observed in AGN (Nandra & Pounds 1994). However, in addition to the “hardening” of the (time integrated) spectrum due to the reflected component, the time delay information is also preserved in the signal: because a predominantly larger fraction of the hard relative to the soft photons reach the observer after reflection, i.e. after time , this geometric arrangement should lead to a broader autocorrelation function of the response with photon energy and therefore to lags in the cross-spectrum of the source between soft and hard energy bands, even though the CCF of the same bands peaks at zero lag.
It is of interest to remind the reader that hard lags in the cross-spectrum have indeed been observed in galactic X-ray sources, most notably in Cyg X-1 (Miyamoto et al. 1988; Nowak et al. 1998). These have been interpreted as due to Compton scattering in an extended hot corona (Kazanas, Hua & Titarchuk 1997; Hua, Kazanas & Cui 1999), or systematic hardening of the X-ray emission with time for a variety of reasons (Poutanen & Fabian 1999; Böttcher & Liang 1999). The difference in X-ray energy albedo in the geometry discussed above represents another process which would also induce lags of the correct sign in the X-ray light curves. However, while the lag sign is correct, their magnitude is much smaller than those observed. This could be remedied by either by removing the X-ray source sufficiently far away from the disk or by considering the photons which scatter at larger disk radii. The first option requires the ad hoc production of X-rays at very large distances above the disk; while one could contrive scenaria that would allow this, we refrain from doing so here. The second option produces only a very small number of photons which would exhibit these lags, since the X-ray flux reflected by the large radii portions of the disk decreases like ; thus, barring a significant change of the disk geometry with distance, it would be hard to discern the delays between these photons among those which arrive to the observer directly from the source.
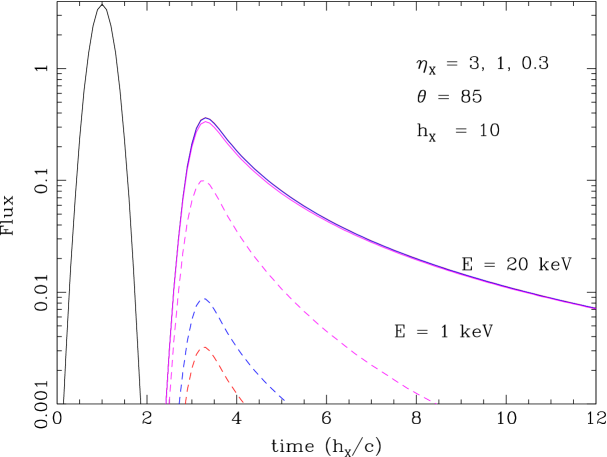
Figure 2 exhibits the effects of changing the ratio of the X-ray, , to the disk, , luminosities. These runs were produced assuming a constant value for the X-ray source height above the disk and an observer latitude degrees. As in Figure 1, the dashed and solid curves correspond to photon energies 1 and 20 keV respectively. As in Figure 1, here too the response of the 20 keV photons is independent of the value of , indicating that the albedo at this energy is independent of details of the structure of the ionized skin. However, this is not the case with the photons of keV, as it is clearly evident in the figure. For these photons, the decrease in albedo with decreasing leads to a corresponding substantial reduction in the reflected flux at this energy. The response curves peak at a lag from the injection of the X-ray pulse, as expected in reflection by an infinite plane for an observer right above the source, indicating that for the chosen value of the effects of the absence of the disk for are indeed small.
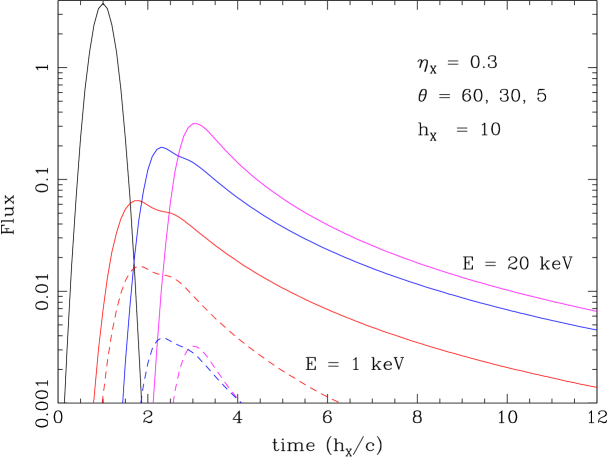
The effects of changing the observer latitude on the response function are shown in Figure 3. In computing these curves, the values and were used, with the usual notation for solid and dashed curves. Decreasing the observer latitude impacts differently the amplitude of the response for the soft (1 keV) and hard (20 keV) X-ray photons: The response of the latter decreases because of the decrease of the disk area projected along the observer’s line of sight. On the other hand, the response of the soft photons does increase with decreasing because of the accompanying increase in albedo at these energies which more than compensates for the decrease in projected area. One can even discern, for the smallest value of the angle, a secondary peak at lag , roughly away from the primary one, induced by the change of albedo with the scattering photon geometry. Apparent in the figure is also the expected shift of the peak of the response function to smaller lags with increasing inclination angle (decreasing ), due to the fact that the reflected X-rays can reach the observer with much reduced lag as in this case. As the lag in the X-ray response peak should also decrease to zero.
4 The X-ray Reprocessing
The fraction of the X-ray radiation which is not reflected by the disk is absorbed and reprocessed, presumably into thermal radiation, leading to the expected (and presumably seen) fluctuations at the continuum emission at UV – O wavelengths. The expected fluctuations can be easily computed by computing the temperature variations on the surface of the disk induced by the variable X-ray flux as a function of time (lag) and radius, and integrating the flux at a given wavelength over the entire disk area, in a fashion similar to that used in the previous section to compute the X-ray reflection as a function of time.


The temperature of the disk at a given distance from the compact object is determined by the sum of the fluxes from: (a) The reprocessed X-rays and (b) The intrinsic flux of the geometrically thin disk. We assume the ratio of the X-ray to the disk luminosity to be , while the total luminosity . Then we have the following relations between
| (9) |
Viscous dissipation provides for accretion onto a Schwarzschild black hole a total local radiant flux of magnitude (e.g. Shapiro & Teukolsky 1983)
| (10) |
where is the mass of the accreting black hole, is the accretion rate and the inner edge of the accretion disk, with in the case of a Schwarzschild black hole considered here. Let denote the efficiency of the thin disk in converting mass flux to radiation; then the local radiant flux due to the thin disk thermal emission, , and the corresponding temperature (assuming black body emission) are given by the relation
| (11) |
where cm is the Schwarzschild radius of the black hole ( is the black hole mass measured in units of M⊙) and is the radius normalized to , with and in the case of a disk around a Schwarzschild black hole. On the other hand, the reprocessed X-ray flux at radius on the disk and the temperature of the associated thermal emission are given by
| (12) |
where is the luminosity of the X-ray source and is the energy integrated, angle averaged albedo of the disk.
In applying the above considerations to models of the NGC 3516 campaign, because the X-ray luminosity is variable while that of the disk is assumed to be constant, the value of their ratio referred to in the rest of the paper is that observed at the beginning of the monitoring campaign. The instantaneous value of the temperature used in the computation of the variable flux is then given by
| (13) |
With the time dependent temperature as a function of radius at hand, the flux at a given wavelength is obtained by first integrating this emission at a given radius over all lags and then over all disk radii, to get
| (14) |
where is the black body emissivity of temperature at wavelength .


Using the above expression (Eq. 14) and the X-ray light curve of NGC 3516 of Edelson at al. (2000), we produced model light curves at a number of wavelengths in the UV and optical part of the spectrum, specifically at 1360, 3590 and 5510 Å to allow a direct comparison with those observed. The X-ray light curve used in Eq. (14) was obtained by a direct logarithmic interpolation of the light curve of Edelson et al. (2000), graciously provided to us by Dr. K. Nandra. One should note that the use of Eq. (14) in computing the model light curves requires the knowledge of the X-ray flux at times prior to that of day 915.8, at which the monitoring campaign began. Given that no information about this flux is available, we assumed it to be constant at the level it had at the beginning of the campaign. In addition to this problem, one must also allow this constant flux persist sufficiently long for the reprocessed radiation to reach a steady state level. Not taking this into consideration may result in a model light curve dominated by the X-ray “turn-on” phase. We have experimented with the “turn-on” time and found that for the longest wavelength (5590 Å) and for the largest value of the mass (), we should turn the source on at day 912 in order to achieve a steady emission at this wavelength by day 915.8.
In computing the model light curves we assumed that the X-ray spectrum of NGC 3516 is a power law, i.e. erg s-1 keV-1, , (Nandra et al. 1999), which extends to energies keV, thereby yielding for . Nandra et al. (1999), who presented the spectral analysis of the X-ray observations of this campaign, concluded on the basis of the Fe K line profiles that the disk inclination is small ( is large), so that the value of inferred above is a fair representation of the true value of this parameter because no significant absorption in an obscuring torus is expected for such small inclination angles. We therefore use this value for in the remainder of our paper, irrespective of the value of the latitude angle, , used.
With the value of fixed we study the effects of the remaining two parameters on the model light curves due to X-ray reprocessing. Figure 4 exhibits the relative amplitude of the observed X-ray light curve along with those of the model light curves due to X-ray reprocessing for the three wavelengths considered, namely 1360, 3590 and 5510 Å for a black hole mass M⊙, and . Figure 5 is an expanded version of Figure 4, exhibiting only the relative amplitudes of the model light curves. Similarly, Figures 6 and 7 exhibit the relative amplitudes of the same light curves for the same values of and but a black hole mass M⊙.
We also explored the effects of the observer latitude angle and the height of the source on the resulting light curves. Figure 8 has identical parameters to those of Figure 7 except for the observer latitude which is . There is an apparent increase in the lag of the reprocessed light curves relative to those of , as well as a small increase in the variability amplitude, which for 3590 Å reaches . Finally, for reasons which will be explained in the next section (the need for higher X-ray flux at small to improve the spectral fits) we have also produced light curves for the same almost face-on models () but smaller distance of the X-ray source from the disk (). The light curve for this set of parameters are shown (along with those of for comparison) in Figure 9. The effects of reducing are a small decrease in the respective lags and a substantial decrease in the level of variability to the % level.


The most apparent feature of the model light curves is the smallness of their variability amplitudes, given the large fluctuations ( of the X-ray flux. This is the result of the combination of “spreading” the reprocessed emission over a large range of radii and in addition of “diluting” its variations by the (presumably) constant flux intrinsic to the accretion disk. As shown in figures 5, 7 the variation amplitudes for 3590 and 5510 Åare of order ; while they are larger and more easily discernible at 1360 Å the observations in this wavelength are not reliable due to the influence of SAA on the UV detectors. Therefore, one cannot exclude the X-ray reprocessing model on the basis of the observed optical variability amplitudes.
However, despite the similarity in variability amplitudes between the observed and the model light curves, closer inspection reveals several differences between them that put the entire scheme into question. This has to do with the absence of O – UV response associated with the flare in X-ray flux which peaks near day 917. While this feature is evident and persists in all model light curves presented in the above figures, it appears to be absent in the observed light curves (see fig. 2 of Edelson et Al. 2000). The variability in the observed light curves seems to be completely dominated by the much broader and of lower peak-flux feature between days 917.3 and 920. One should note that the model light curves exhibit an increasing preponderance of this lesser flux, broader feature with the wavelength of reprocessed emission and black hole mass. Such a behavior in the time profiles of reprocessed emission, in response to low-broad vs. sharp-narrow features in the light curve of the driving flux, indicates that the size of the reprocessing region is larger than the duration of the “narrow” feature and more in line with that of “broad” one. This trend is apparent in figures 5 and 7 in which the amplitude of the feature with peak flux near day 917 becomes less pronounced relative to that extending from day 917.3 to 920, even though its peak flux (at day 918) is smaller. This suggests that using an even larger value for the black hole mass (actually, a value M⊙ for the black hole mass would produce a better fit to the UV spectrum – see next section) might reproduce the observed amplitude ratio of these two features; however, such an increase in the mass would further increase the already discernible lags between the X-ray and O – UV emission (see figure 7) which are not present in the data (see figure 2 of Edelson et al. 2000). The above discussion (and associated figures), in essence, casts the arguments against reprocessing made by Edelson et al. (2000) in a quantitative form.
We quantify further the issue of the lags between the various observed bands as a function of the black hole mass by computing their cross correlation functions between the model light curves at 5510 Å and 3590 Å and also between each of the model light curves at these wavelengths and that of the observed X-rays. These are presented in figures 10 and 11 for M⊙ respectively.


These figures indicate the presence of lags in the cross correlation functions (CCF) between the observed X-rays and the model light curves either wavelength of the reprocessed radiation, for either value of the black hole mass. However, for M⊙ the lags are too small ( days) to be easily detectable in the light curves of figures 4 and 6. This is not the case for M⊙, for which the lag between X-rays and optical emission (of either wavelength) is apparent and of magnitude days, with the lags increasing still further for . Unfortunately, the observed cross correlation functions between the same bands are much broader than those presented above to allow a direct comparison (see figure 6 of Edelson et al. 2000); however, there is indication in the latter that the X-rays preceed the optical emission by about 0.25 days. On the other hand, CCF the model light curves between 3590 and 5510 Å do not indicate the presence of any lags between these bands, even for the larger value of the black hole mass, just as is the case with the observed light curves of the same bands. They nonetheless exhibit an asymmetry between positive and negative lags suggestive of different durations for the reprocessed emission in these two bands. At this point, one should bear in mind that the absence or presence of lags in the cross correlation function depends also on the form of the input signal if there is a large range of radii which contribute to the reprocessed emission.
5 The Disk Spectra
Having obtained a range of values for parameter of the system from the timing observations and constraints, we use these to compute the corresponding O–UV and X-ray reflection spectra, which we then compare to observation. For the O–UV spectra we make the usual assumption that the local emission is that of a black body which irradiates the locally produced luminosity, as done before in the literature. For the X-ray spectra we use the self-consistent procedure discussed in NKK and further elaborated in Nayakshin (2000). This procedure is directly applicable to the generic model whose properties we attempt to test herein. This combined spectro-temporal approach puts far more severe and comprehensive restrictions on the specific model than its timing or spectral properties alone. We hope that such a combined approach will eventually point to the direction of class of models which can accommodate these combined constraints.
5.1 The Optical–UV Model Spectra
The equations used to compute the time dependent light curves to X-ray reprocessing on the disk (in particular Eq. (14) above) can be also used for the computation of the spectra of the geometrically thin, optically thick disk responsible for the O – UV emission. It has been argued long ago that the spectra of AGN in this wavelength range are well fit by such models (Malkan & Sargent 1983; Malkan 1984; Laor & Netzer 1989; Sun & Malkan 1989).
In order to do so, we assume that the X-ray flux remains constant and compute the resulting flux for different values of the wavelength rather than the time (technically, we allow only one step in the –integration in Eq. (14), while still integrating the emission over all for each value of ). The values of the black hole mass, , and accretion rate (in units of the Eddington rate), , are chosen so that they provide reasonable eye-ball fits to the observed fluxes as given in Edelson et al. (2000). In order to convert our luminosity values (derived from the use of a given value of ) to observed flux, the value of the Hubble constant Mpc-1 was used. The results of these calculations are given in Figure 12.
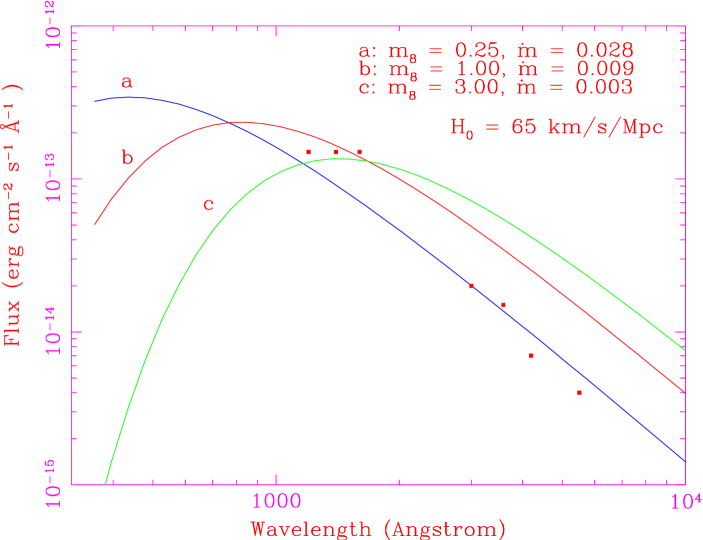
It is apparent from this figure that no single combination of these values provides (even) a rough fit to the combined data. While the values ( is the accretion rate in units of the Eddington accretion rate) could presumably provide a reasonable rough fit of the UV data (the flux of this part of the spectrum appears to be constant), they over produce the optical luminosity by about a factor of 5. Decreasing the value of the mass to , with a concomitant increase in the accretion rate to to keep the total luminosity constant, while it reduces the discrepancy of the flux in the optical part of the spectrum, (the slope of the spectrum actually is quite close to that observed), indicates an increase of the UV flux to shorter wavelengths which is not observed. Finally, the combination , provides a reasonable eye ball fit to the optical data but fails to reproducing the UV data by a a large margin. Similar combinations with smaller vales of , give spectra which peak at too short wavelengths to provide any useful fits to the UV data.
5.2 The X-ray reflection spectra
We compute the X-ray reflected spectra assuming that the X-ray spectral index is , as appropriate for NGC 3516 based on results of Nandra et al. (1999). Further, we use , exponential cutoff energy keV, and two values for the BH mass, and M⊙. Using the approach described in NKK and the associated numerical code, we compute the reflected spectra at 10 different radii (measured in units of the Schwarzschild radius), where and and for 10 different viewing angles. We then define a spectrum for an arbitrary value of and any viewing angle to be a linear interpolation of the spectra computed for the nearest values of and as well as viewing angles. Finally, we integrate over the accretion disk surface to obtain the full disk spectra at a given viewing angle, taking into account the gravitational redshift in the photon energy and Doppler boosting due to Keplerian disk rotation (for a non-rotating black hole). A more complete discussion of this procedure is given in Nayakshin (2000b). In addition, the detailed structure of the illuminated atmosphere of the disk at for the lamppost model, and the reflected spectra are presented in Nayakshin & Kallman (2000).
Figure 13 shows the reflected spectra at the inclination angle of (this angle appears to reproduce the Nandra et al. 1999 Fe line profile best, see below). More precisely, the curves in this figure exhibit the ratio of the observed spectrum (i.e Source + Reflected) with the effects of the observer viewing angle in full consideration, to that of the Source alone (assumed to be a power law), much in the spirit the ratios of data-to-model are presented by the observers. One should note that because the highly ionized skin reflects a large fraction of the photons even at soft X-ray energies, the ratio of the total observed spectrum to the direct continuum X-ray emission can be substantially higher than unity for all photon energies (see NKK). [Therefore, an observer fitting the spectrum with a Power law + Reflection from neutral material (which reflects very little at energies keV) would severely underestimate the reflection fraction and therefore the solid angle of the source subtended by the reprocessing “cold” matter (Done & Nayakshin 2000)]. Figure 13 demonstrates also the obvious fact that a decrease in the height of the X-ray source leads to a smaller fraction of intercepted by the disk and therefore to less reflected continuum and the Fe K emission (dashed lines).

The spectra corresponding to the black hole mass value of are rather unusual in the sense that they deviate very strongly from the roughly power-law type spectra, typical of Seyfert 1 nuclei in the 1–15 keV range. For this value of the mass and the observed X-ray luminosity, the ionized skin of the irradiated disk is Thomson thick but not completely ionized (i.e. “warm”). This leads to an enormous absorption edge (blended with Fe recombination continuum), and a very strong emission feature between and 4 keV, which is due to a blend of recombination continua from elements Mg, Si and S. As discussed in detail in Nayakshin & Kallman (2000), these features, as well as the He-like Fe line at keV (further broadened and shifted by Compton scattering and relativistic effects), are due to the presence of this “warm” skin on the disk surface. The absence of these features in the spectrum of NGC 3516, and in the spectra of Seyfert 1 AGN in general, seems to argue against this particular range of parameters for this specific X-ray reflection model.
For the larger value of the mass, , the X-ray flux on the accretion disk is smaller, leading to a correspondingly thinner ionized skin. As a result, even though the skin is still not completely ionized and does include emission from the transitions discussed above, its relative contribution to the reflected spectra is small compared to that of the underlying, neutral, cold layer. Therefore the spectra are much more similar to those observed that are generally fit with reflection from “cold”, neutral matter e.g., Basko et al. 1974; Lightman &1988; Magdziarz & Zdziarski 1995; Poutanen, Nagendra & Svensson 1996). The fits of the continuum-reflection spectra alone, therefore, seem to favor this larger value for the black hole mass, in sharp contrast to synchrony in the O–UV variations which is more consistent with the smaller () value. Let us now make a detailed comparison111Note that a study of the origin of the “absorption” feature reported by these authors is beyond the scope of this paper at this time (but see Ruszkowski & Fabian 2000) of the 4 computed spectra with that observed by Nandra et al. (1999).
5.3 The Fe Line Profiles.
Much of the significance of the Fe line observations lies in the fact that they are (occasionally) very broad (usually to the red), indicating emission from X-ray reprocessing on cold matter in the black hole vicinity. The Fe line in the spectra of NGC 3516, obtained during the campaign analyzed herein, was indeed broad (Nandra et al. 1999), thereby providing additional constraints on the parameters of this system. In the absence of data associated with the Fe line variability, we have attempted to delineate these constraints through the modeling of the line profiles. Note that the line profile is calculated as a part of our full calculation of the X-ray illumination, so that the spectra shown below are the same as those shown of Figure 13, except that we “zoom-in” the keV energy region. In Figure 14 we present the line profiles so computed for two different values of the inclination angle namely (the two solid lines; the lowest energy one corresponds to ) and for two different values of the black hole mass () and X-ray source height (), along with the best fit to the data by Nandra et al. (1999) (dotted line). The best fit line profile is rescaled so that its flux matches that of our model disk spectra at keV, while its integrated flux matches that of our models. The choice of inclination angles used by Nandra et al. (1999) and ourselves is dictated by the demand that these two effects conspire to produce a line peak around 6.4 keV, as observed.
It is apparent in the figure that none of our line profiles looks even approximately similar to that which best fits the data (dotted line). The main reason is the excessive flux at keV relative to that at keV in the observed profile. Indeed, in order to provide a fit to the red wing of the line, Nandra et al. (1999) used a very steep law for the X-ray illumination of the disk (). This limits the emission to a section of the disk located very close to the black hole, resulting in the observed broad profile. We have attempted to simulate this by reducing the X-ray source height . While the resulting line profiles are indeed broader, they still fall far short from matching those of Nandra et al. (1999). This is due to both geometry, which dictates that a larger fraction of be “waisted” in the hole below at , and also to ionization physics: because the illuminating X-ray flux at small is now larger than it is for , the skin is more ionized and produces less of the He-like Fe line, leading to an overall decrease of its equivalent width. We do not think that any value of could produce the required illumination law, at least for a Schwarzschild geometry. Consideration of a Kerr geometry may help in this respect, however, our models cannot correctly compute the resulting profile without incorporating the additional details involving the photon propagation in this geometry. Another possible remedy would be to take into account the Fe K line emission from the cold infalling material within (e.g., Reynolds & Begelman 1997). Nonetheless, it is our contention that concentrating the X-ray flux to a small area in the hole’s vicinity would result in a much smaller variability amplitude in UV–O wavelengths than observed (see for example Fig. 9), because the UV–O emission comes from where the X-ray flux would be too small.
In relation to our detailed line profiles shown in Fig. 14 we would like to note the following: For the smaller value of the black hole mass, favored by the synchrony in interband variations (), the reflected spectra are distinctively non power-law like, due to the high Thomson depth of the skin. There is a drop in the computed spectrum above keV not observed in the actual data (see Figure 1 in Nandra et al. 1999); the data also show a flux decrease below keV compared to an increase in the same energy range produced by our models. In addition, the line flux contains contributions from 6.7 keV (He-like) and 6.9 keV (H-like) ions, which increase its width near the line core by an amount larger than allowed by the data222Out of curiosity, we computed a full disk spectrum for with the Doppler effects turned-off and found the line width to be keV due to Compton scattering in the skin and the presence of He- and H-like ion contributions.. These spectral discrepancies between model and data argue convincingly against this value for the black hole mass within the lamp-post model. The spectra for the larger mass models (), are significantly different for the reasons discussed in §5.2. The smaller Thomson depth of the skin leads to a narrower line, dominated by the 6.4 keV transitions and broadened by the kinematics of the disk. The Fe absorption edge is neutral-like at keV, but it is not well seen in the model spectra due to its blending with the Fe line emission by the combined effects of Doppler and gravitational smearing. There is no noticeable edge/recombination feature at keV, and also no low energy (at keV) Mg, Si and S features in agreement with observation (Nandra et al. 1999). The EW of the line is a little low, a fact that could be remedied by by allowing for a super-solar Fe abundance (see George & Fabian 1991).
the spectra in the region of few keV because there is not enough column density in completely ionized . Thus, the reflected spectra are much more power-law like and are not in conflict with the Nandra et al. (1999) data, unlike case. The centroid energy of the line in the rest frame of the disk material is 6.4 keV, as observed.

6 Summary, Conclusions
We have examined in detail the spectro-temporal properties of the “standard” model of the central regions in AGN, which consists of a geometrically thin, optically thick accretion disk along with an overlying illuminating X-ray source at a height , in view of the observations of the recent monitoring campaign of NGC 3516 (Edelson et al. 2000). To this end we have produced model light curves at the observed wavelengths 1360, 3590 and 5510 Å, assuming that they result from the reprocessing of the observed X-ray flux by the geometrically thin, optically thick accretion disk. Comparison of the timing characteristics (amplitudes, lags between the various wavelengths) of our model light curves to those observed set the range of acceptable values for the parameters which characterize geometry of the model, namely . Using values of these parameters derived from the timing considerations, we produced the O–UV continuum, as well as the detailed X-ray reflection spectra expected from the X-ray illumination of the accretion disk, taking into detailed account the ionization, radiative transfer, hydrostatic balance and kinematic and gravitational effects. The model light curves also include (in addition to the variable X-ray reprocessed flux) a constant contribution due to the energy liberation in the thin disk itself as inferred from observations of NGC 3516.
Our results can be summarized as follows:
1. The variability amplitudes of the reprocessed emission at 3590, 5510 Å are in reasonable agreement with those observed, given the inferred ratio of the X-ray-to-disk luminosities and assuming . The reprocessed light curves in these two wavelengths appear to vary in synchrony for the smaller of the values of the black hole mass examined (), with only a small lag ( days) between the X-rays and the reprocessed radiation, which could be accommodated by the data. However, the data exhibit a noticeable absence of direct correspondence between the X-ray and the optical emission, not observed in the model light curves. In particular, the X-rays exhibit, at day 916.8, a specific large amplitude () “flare”, of 0.7 day duration not observed at 3590, 5510 Å, while it is very clearly present in the model light curves of the same wavelengths. This suggests that the size of the reprocessing region should be larger than 0.7 light days. Indeed, increasing the black hole mass results in model light curves which progressively suppress this feature but which, at the same time, destroy the overall synchrony of variation between the X-rays and the flux at 3590 and 5510. Already for a mass the lags between the X-rays and the model light curves are inconsistent with observation, while this feature is still clearly present in the model light curve. A mass of suppresses this feature to the extent that it is consistent with observations, but only for 5510 Å, thereby not resolving the inconsistency (for brevity we do not exhibit these results in a figure). Interestingly, however, the synchrony in the variation between 3590 and 5510 Å is not destroyed; their CCF still peaks close to zero lag but it becomes progressively asymmetric with the increase in , more than allowed by the data. We have not explored the effects of any larger values for the mass as they appear unreasonable and inconsistent with the O–UV continuum data (see next point). One could decrease the X-ray - O–UV lags by increasing the disk inclination angle, , but this is not allowed by the line profile data (see last point). We can conclude, therefore, that the timing observations alone are not consistent with range of the model parameters explored herein, and likely with any set of values of these parameters.
2. The observed O–UV spectral distribution of NGC 3516 is generally narrower than that of the “standard” accretion disks. Hence, a reasonable fit of the UV flux () overproduces the optical emission, while producing a good fit to the optical flux () places the peak emission at wavelengths far shorter of the observed 1200–1500 Å, underproducing the observed flux at this range. Interestingly, each mass range is consistent with only one specific aspect of the timing data: the smaller mass with the X-ray - optical variation synchrony and the larger one with the suppression of the X-ray flux feature near day 916.8, in the model light curves.
3. The model X-ray reflection spectra are clearly inconsistent with those observed for the “small” values of the black hole mass (), due to the high Thomson thickness of the non fully ionized skin, which produces atomic transition features not observed in the data. Increasing the mass to leads to a much smaller Thomson depth of the skin, and hence X-ray reflection spectra resembling those observed (but see the last point). Note, however, that high black hole masses are strongly ruled out by the timing data (first point). Significantly, our models predict specific correlations (hard lags) between photons at keV and at keV, of order sec (for , as assumed in our models) in the cross spectra of these energies, even without any lag present in their CCF. The X-ray sampling rate of the source is sufficiently high that a search for these lags may be reasonable and possible.
4. The Fe line (more accurately the Fe line complex) observations, in conjunction with our models, serve mainly to constrain the inclination angle of the disk to . While our models produce reasonable equivalent widths for this line, they are unable to match, even approximately, the best fit of the observed profile. The main reason is the large red wing of the Fe K line extending to keV, which requires that most of this emission, and therefore the associated X-ray illumination, be confined to a region very close to the black hole horizon. Our models, with the source located at any source height, fall far short from achieving this. An extreme Kerr hole would help in this respect, however, quantitative models do not exist for this case; furthermore, it is not apparent how such models would provide a resolution of the issues raised in point 1 above. Finally, concentrating too much of the X-ray luminosity in the few region will leave too little of this luminosity to illuminate the region tens of (that emits the O–UV part of the spectra) so that it will underproduce the amount of the O–UV variations compared to those observed.
Where do all these leave us? It is apparent that one cannot fulfill all the observational constraints within this picture of the central engine of AGN. The alternatives are few: (a) Ignore some of the constraints as less important and attempt concordance within this less restricted constraint list (b) Abandoned this model in favor of a different one.
Of the present constraints, those set by timing seem to be the more significant ones, in that by themselves point to a possible internal inconsistency of the model. As argued elsewhere (e.g. Kazanas, Hua & Titarchuk 1996), spectral fits and observations can, generally, yield information only about optical depths and column densities and that timing information is necessary to convert these to the length and densities necessary to determine the geometry of the source. The problem with the timing observations is that it is not known, in the absence of repeated observations, whether they reveal a typical or a transient property of the object under consideration. Clearly “more observations are needed”, with as broad wavelength coverage as possible, given that it is the interband variability which provides the most stringent constraints on the models.
Of our model spectra and their fits to the data, those of the O–UV continuum maybe thought as the more suspect given the simplicity of their assumptions and the possibility of their contamination by the host galaxy. However, since that such a contamination would more likely contribute to the optical rather than the UV flux, its removal it would only increase the discrepancy between model and observation. The X-ray reflection spectra, on the other hand, are very robust within the specific model examined and seem to argue for the larger values of the mass considered. The energy dependent albedo and the related timing analysis within the X-ray band itself, if feasible, should clearly set additional, independent limits on size of the system. We hope that such analysis in this and other objects be carried out and set as one of the observing goals.
We would like to thank K. Nandra for providing us with the X-ray light curve of NGC 3516.
References
- (1) Basko, M.M., Sunyaev, R.A., & Titarchuk, L.G. 1974, A&A, 31, 249
- (2) Berkley, A. J., Kazanas, D. & Ozik, J. 2000, ApJ (in press astro-ph 0001242)
- (3) Böttcher, M., & Liang, E.P., 1999, ApJ, 511, L37
- (4) Collier, S. J. et al. 1998, ApJ, 500, 162
- (5) Done, C., & Nayakshin, S. 2000, submitted to ApJ
- (6) Edelson, R. et al. 2000, to appear in ApJ
- (7) Fabian, A.C., Iwasawa, K., Reynolds, C.S., & Young, A.J. 2000, invited review, astro-ph/0004366
- (8) George, I.M., & Fabian, A.C. 1991, MNRAS, 249, 352
- (9) Hua, X.-M., Kazanas, D., & Cui., W. 1999, ApJ, 512, 793
- (10) Kazanas, D., Hua, X.-M. & Titarchuk, L. G. 1997, ApJ, 480, 735
- (11) Krolik, J. H., Horne, K., Kallman, T. R., Malkan, M. A., Edelson, R. A., & Kriss, G. A. 1991, ApJ, 371, 541
- (12) Laor, A. & Netzer, H. 1989, MNRAS, 238, 897
- (13) Lightman, A.P., & White, T.R. 1988, ApJ, 335, 57
- (14) Magdziarz, P., & Zdziarski, A.A. 1995, MNRAS, 273, 837
- (15) Malkan, M. A. & Sargent, W. L. W. 1982, ApJ, 254, 68
- (16) Malkan, M. A. 1983, ApJ, 286, 582
- (17) Miyamoto, S., Kitamoto, S., Mitsuda, K., & Dotani, T. 1988, Nature, 336, 450
- (18) Nandra, K., & Pounds, K. A. 1994, MNRAS, 268, 405
- (19) Nandra, K., et al. 1998, ApJ, 505, 594
- (20) Nandra, K., et al. 1999, ApJ, 521, L17
- (21) Nandra, K., et al. 2000, submitted to ApJ
- (22) Nayakshin S., & Dove, J.B. 2000, submitted to ApJ (astro-ph 9811059).
- (23) Nayakshin, S. 2000a, ApJ, 534, 718
- (24) Nayakshin, S. 2000b, submitted to ApJ
- (25) Nayakshin, S., Kazanas, D., & Kallman, T. 2000, to appear in ApJ volume 537.
- (26) Nayakshin, S., & Kallman, T. 2000, submitted to ApJ (astro-ph/0005597)
- (27) Nowak, Michael A., Wilms, J., Vaughan, B.A., Dove, J. B., Begelman, M. C. 1999, ApJ, 515, 726
- (28) Netzer, H., & Peterson, B.M. 1997, Astronomical Time Series, Eds. D. Maoz, A. Sternberg, and E.M. Leibowitz, 1997 (Dordrecht: Kluwer), p. 85.
- (29) Pounds, K., Nandra, K., Stewart, G. C., George, I. M., & Fabian, A. C. 1990, Nature, 344, 132
- (30) Poutanen, J., Nagendra, K.N., & Svensson, R. 1996 MNRAS, 283, 892
- (31) Poutanen, J., & Fabian, A. C. 1999, MNRAS, 306, L31
- Reynolds and Begelman (1997) Reynolds, C.S., & Begelman, M.C. 1997, ApJ, 488, 109
- (33) Ruszkowski, M., & Fabian, A.C., 2000, MNRASaccepted.
- (34) Shapiro, S. L., & Teukolsky, S. A., 1983, “Black holes, white dwarfs, and neutron stars: The physics of compact objects.”, New York, Wiley-Interscience,
- (35) Sobolev, V.V., 1975, Light scattering in planetary atmospheres, New York, Pergamon Press.
- (36) Sun, W. H. & Malkan, M. A., 1989, ApJ, 346, 68
- (37) Tanaka, Y. et al. 1995, Nature, 375, 659