Mid-infrared interferometry on spectral lines:
III. Ammonia and Silane around IRC +10216 and VY CMa
Abstract
Using the U.C. Berkeley Infrared Spatial Interferometer with an RF filterbank, the first interferometric observations of mid-infrared molecular absorption features of ammonia (NH3) and silane (SiH4) with very high spectral resolution () were made. Under the assumptions of spherical symmetry and uniform outflow, these new data permitted the molecular stratification around carbon star IRC +10216 and red supergiant VY CMa to be investigated. For IRC +10216, both ammonia and silane were found to form in the dusty outflow significantly beyond both the dust formation and gas acceleration zones. Specifically, ammonia was found to form before silane in a region of decaying gas turbulence (20 R⋆), while the silane is produced in a region of relatively smooth gas flow much further from the star (80 R⋆). The depletion of gas-phase SiS onto grains soon after dust formation may fuel silane-producing reactions on the grain surfaces. For VY CMa, a combination of interferometric and spectral observations suggest that NH3 is forming near the termination of the gas acceleration phase in a region of high gas turbulence (40 R⋆).
keywords:
molecular processes, turbulence, instrumentation: interferometers, instrumentation: spectrographs, techniques: interferometric, stars: AGB and post-AGB, stars: circumstellar matter, stars: winds1 Introduction
Both high and low-mass stars near the end of their lives are known to emit copious amounts of material with the high mass-loss rates critically dependent on the formation of silicate or carbonaceous dust grains within a few stellar radii of the red (super-) giant photosphere. Stellar photons both impart momentum to the dust particles through absorption and scattering (which drive a wind) and heat dust close to the star to temperatures up to 1200-1500 K (e.g., Lafon & Berruyer (1991)). Thermal radiation from these hot dust grains peaks in the near-infrared (1-5 m), while more distant and cooler (500 K) grains emit mostly in the mid-infrared (5-20 m).
Although the physical sizes of these evolved stars are impressive (R AU), their galactic paucity means that even the closest examples lie at distances greater than 50 pc. Thus the characteristic size scale for dusty circumstellar emission at a few stellar radii is generally a small fraction of an arcsecond, too small to be resolved using standard observing techniques from ground-based telescopes limited by telescope diffraction (in the mid-infrared) and/or atmospheric turbulence (for shorter wavelengths). However, long-baseline interferometry in the infrared can directly detect and measure the morphologies of these envelopes.
The high densities of heavy elements and the mild temperatures around evolved stars encourage the formation of myriad diatomic and polyatomic molecules in addition to dust grains. For instance, over 50 molecular species have been found around prototypical carbon star IRC +10216 (see review by Glassgold [1998]). Attempts to understand the density, temperature, and velocity distributions as well as the formation mechanisms of these molecules have contributed to the development of the field of astrochemistry.
Using estimates of the temperature, atomic abundances, and gas density in and above the photosphere, predictions of molecular abundances can be made through detailed calculations of a network of chemical reactions. By assuming local thermodynamic equilibrium (LTE), various molecules are said to “freeze-out” in the stellar wind. The decreasing temperatures and densities cause reaction rates to fall quickly, locking the atoms in certain energetically favorable molecules. Frozen equilibria models have proven useful at explaining the abundances of many molecules observed around AGB stars (e.g., Lafont, Lucas, & Omont (1982)), however additional chemical processes are needed to explain some detected species. For instance, penetration of interstellar UV-radiation catalyzes photochemical reactions in the outer envelopes of AGB stars (e.g., Cherchneff & Glassgold (1993)), while other molecules may be produced under non-equilibrium conditions associated with shocks (Willacy & Cherchneff (1998)). Particularly relevant here is the fact that negligible amounts of silane and ammonia are predicted by most freeze-out models, yet they have been detected with some abundance in circumstellar envelopes (e.g., Keady & Ridgway (1993)); their formation is hypothesized to be catalyzed on the surfaces of dust grains in the flow. In addition, recent discoveries of brown dwarfs and extrasolar planets have catalyzed interest in the chemistry of cool stellar atmospheres (e.g., Burrows & Sharp 1999), leading to new insights into molecular formation mechanisms in these environments. Since it is often difficult or impossible to experimentally reproduce the physical conditions of circumstellar and interstellar space, molecular observations are critical to test and guide relevant theories.
This paper is the third in a series on the spatial distributions of dust and molecules in the inner envelopes of nearby red giants and supergiants. Paper I (Monnier et al. 2000a ) discussed the hardware implementation of this experiment, while Paper II (Monnier et al. 2000b ) discussed recent visibility data at 11.15 m and presented the appropriate dust shell models for IRC +10216 and VY CMa. This paper (Paper III) makes use of these results as well as the first mid-infrared visibility data ever reported on spectral lines, providing critical new information on the molecular stratification around these stars.
The methods used in this work are technologically challenging and represent significant advances in infrared interferometry. By combining the high spatial resolution of long-baseline interferometry with the high spectral resolution of heterodyne spectroscopy (Paper I), this work has, for the first time, probed the brightness distribution on and off of spectral absorption features as narrow as 1 km s-1(). This allows the absorbing regions of polyatomic molecules to be directly measured, setting strong limits on the formation radii. Such measurements are important for determining the formation mechanism since there is presently no good theory to explain the observed high abundance of certain molecular species (e.g., NH3 and SiH4).
2 Modeling
The observing methodology for extracting visibility data on and off of spectral lines with the Infrared Spatial Interferometer has been discussed in detail in Paper I and Monnier (1999). New dust shell models of IRC +10216 and VY CMa have been developed in Paper II. However, interpreting spectral line observations requires modeling of the distribution of circumstellar molecules as well as dust.
As for observations of continuum radiation with the ISI, it is rarely possible to directly reconstruct an image of the astrophysical source due to the sparse sampling of the Fourier plane afforded by a two-element interferometer. This limitation necessitates the use of radiative transfer models for interpreting the line data. This section discusses the assumptions used in creating models of the molecular envelopes around AGB stars, the numerical code, and the scientific goals of subsequent analyses.
2.1 Simple models
In Paper II, the assumptions of a spherical symmetric and uniform outflow of dust embedded in the stellar winds were adopted, approximations which have been extended to include the distribution of molecular material. As with the models of the dust shells, the molecular envelope was characterized by the inner formation radius and overall abundance factor, free parameters in fitting models to the molecular line data.
Observations have shown that the line shapes of SiH4 and NH3 around AGB stars typically show emission in the red wing and absorption in the blue (e.g., Goldhaber (1988)). This kind of profile is expected for molecular emission and absorption in an expanding envelope (e.g., Shu (1991)). Figure 1 shows a theoretical line profile similar to those actually observed. The bulk of the absorption is blue-shifted with respect to the star at the speed of the outflow. This is because the entire column of molecular gas along the line-of-sight connecting the observer and the star is at the same relative velocity (-voutflow), assuming uniform outflow; hence, there is a large optical depth, , at this frequency and self-absorption is observed. On the other hand, lines-of-sight which penetrate the molecular gas envelope at impact parameters off the observer-star axis encounter parcels of gas at a variety of relative doppler shifts. The optical depth at any particular frequency is hence generally low, allowing emission from deeper layers of hot dust to escape and to be observed without significant molecular absorption. The low-level emission observed at both blue- and red-shifted velocities arises from relaxation of IR-pumped and collisionally-excited transitions into higher energy vibrational states. Note that absorption in the line core occurs primarily because of the large optical depth at that frequency combined with the fact that the temperature decreases with increasing distance from the star. Hence, absorption under these conditions would occur even when the molecules are in local thermodynamic equilibrium (LTE) with the dust and radiation.
For the AGB stars under study here, the source of most of the mid-infrared flux is thermal emission from the dust envelope (Danchi et al. (1994)), not from the star itself. Since the blue-shifted absorption features indicate that most of the absorption is occurring along the direction towards the center of dust envelope, an interesting measurement that can be made with an interferometer is the size of the absorption region. This measurement yields direct information on the approximate location of the surface, which can be used to determine the abundance and inner radius of molecular formation. However this method is insensitive to molecules which may exist right at the inner radius of the dust, if they are in LTE. This is because there is no significant background source of radiation to absorb. These complications require the use of a sophisticated spectral line code to quantify the sensitivity of this method to molecules forming near the inner radius of the dust shell. Such a code has been used, and is described in the next section.
Previous spectral line work (Betz, McLaren & Spears (1979); McLaren & Betz (1980); Goldhaber & Betz (1984); Goldhaber (1988); Keady & Ridgway (1993)) has shown that ammonia and silane exist around AGB stars at up to 104 times the abundances predicted by equilibrium calculations of expanding outflows (for more recent work under somewhat different physical conditions, see Burrows & Sharp 1999). It has been suggested that dust catalyzes the formation of these molecules through chemical reactions on grain surfaces. If this is the case, one might expect the inner radius of molecular formation to coincide with the dust formation radius. However, atoms and molecules generally have low sticking efficiencies at high temperatures, elastically scattering off the grain surfaces (e.g., Leitch-Devlin & Williams (1985)). This fact and the lack of known chemical pathways for the formation of molecules such as ammonia and silane make direct measurements of molecular formation radii important, and this is one of the prime goals of the filterbank project of the Infrared Spatial Interferometer.
2.2 Radiative transfer calculations
Radiative transfer in spectral lines often is accomplished by applying the Sobolev approximation (e.g., Goldhaber (1988); Shu (1991)), which assumes that large-scale velocity gradients essentially radiatively decouple parcels of molecular gas. To accurately calculate the radiative transfer in a spectral line, the Sobolev approximation requires the natural linewidth, in this case determined by microturbulence (for cold gas) or thermal motions (for hot gas), to be much smaller than the expansion velocity. While this condition is reasonably satisfied for the narrowest lines (), it is only weakly so for the broadest ones ().
In order to avoid this uncertainty, all radiative transfer calculations in spectral lines were performed using a code developed by Dr. J. J. Keady (Keady (1982)), based on the method of Mihalaset al.(1975). It accurately calculates line profiles as well as frequency-dependent emission profiles, from which visibility curves can be computed on and off spectral features. This code was developed to treat the case of molecules embedded in an expanding flow, even when the absorbing molecules are comingled with continuum-emitting sources. This is likely the case for AGB stars where thermal emission by dust is believed to be “filling-in” the absorption features. The program, written in Fortran, formally solves the observer’s frame transport equation, which is necessary to correctly account for the propagation of line radiation through an expanding flow, thus avoiding the questionable Sobolev approximation. Dr. Keady has allowed his code to be used for the analyses which follow, and has assisted in porting the Fortran code to run under Solaris. This code has been extensively tested, having been used for over 15 years (Keady (1982); Keady, Hall & Ridgway (1988); Keady & Ridgway (1993); Winters et al. (1998)). While the code was already able to be used with spherical top molecules (e.g., SiH4), the appropriate partition function and statistical weights had to be programmed for NH3 (a symmetric rotor). A nice summary of the mid-infrared molecular properties of both SiH4 and NH3 can be found in chapter 5 of Goldhaber’s thesis (1988). Readers interested in the numerical details of the radiative transfer calculation should consult Keady (1982) and Mihalaset al.(1975) for further details.
2.3 Assumptions
2.3.1 Dust
The source function used for radiative transfer in Keady’s code assumes a single dust grain size and temperature at a given radius from the star. The code (Wolfire & Cassinelli (1986)) which was used for fitting the ISI continuum visibility data in Paper II utilized the full MRN (Mathis, Rumpl & Nordsieck (1977)) distribution of grain sizes and hence some modification must be made to adopt our previous models for use by Keady’s algorithm. The average cross-section of the MRN distribution was used as input to the Keady code, along with the size-averaged dust temperature. This necessary simplification resulted in a slight misfit to the ISI continuum visibility data, which was compensated for by empirically adjusting the overall value of the single grain-size dust opacity (30% change).
2.3.2 Temperature(s) of the gas
In addition to spherical symmetry and uniform outflow, other assumptions are also generally made for line calculations. Most important is the assumption that the occupation of various ro-vibrational states of the polyatomic molecules can be approximated by a Boltzmann distribution using separate vibrational and rotational temperatures, Tvib and Trot. Ideally, the populations of the various states should be calculated using a multi-level model molecule. However, the collisional excitation constants are poorly known for SiH4 and NH3 and the large number of (far-IR) rotational transitions make for a difficult and uncertain result.
Goldhaber (pg.103, Goldhaber [1988]) considered this question in some detail for IRC +10216 and his conclusions will now be summarized. For sufficiently high molecular densities, both mid-IR and far-IR (i.e., ro-vibrational and pure rotational) transitions will be optically thick, trapping line radiation. In this case, collisional excitation and de-excitation will have a strong influence on the level populations, equilibrating the vibrational and rotational temperatures with the gas (kinetic) temperature. However, the molecules under consideration here are not found at sufficiently high densities for this to apply.
At the somewhat lower densities encountered for ammonia and silane, the mid-IR (ro-vibrational) transitions become optically thin. In terms of excitation mechanism, this allows IR pumping of the vibration-rotation transitions to dominate (over collisions) within about 70 R⋆, while rotational relaxation in the pure rotational transitions (far-IR) dominate in the outer envelope (where these transitions become optically thin). Collisional excitation and de-excitation never play a dominant role. Hence, Tvib and Trot should be close to the radiation/dust temperature, Tdust, suggesting that Tvib=Trot=Tdust is a good starting point. The radial dependence of the rotational and vibrational temperatures usually need slight adjustment during the modeling process to reproduce the relative depths of high and low excitation lines.
One interesting exception applies to the J=K states of NH3. The rotational dipole moment along the symmetry axis (z-axis) of NH3 is equal to zero; hence the selection rule must apply for all radiative (dipole) transitions (see Townes & Schawlow [1975]). Therefore, a molecule rotating in the J=K state can not radiatively de-excite to a lower energy (lower J) state. Hence, the equilibrium population of J=K states is not determined by the radiation temperature but by collisions with the ambient gas (mostly H2); the rotational temperature of these states should be in equilibrium with the gas (kinetic) temperature. However, a strong (parallel-type) vibrational band at 6.1 m does allow transitions, thereby allowing K-ladders to come into equilibrium if sufficiently excited by the radiation field. Sufficient IR pumping in this band is likely to dominate over collisional processes out to a few hundred R⋆, although a detailed calculation is lacking (see Goldhaber [1988]).
2.3.3 Molecular constants
The polyatomic molecules of SiH4 and NH3 have been modelled using physical constants, including the moments of inertia and vibrational energy levels, adopted from Keady & Ridgway (1993) and Goldhaber (1988). Readers interested in learning more about molecular spectroscopy should consult these sources; a rigorous and complete treatment of the subject can be found in Microwave Spectroscopy by Townes & Schawlow (1975).
| SiH4 | |
|---|---|
| B = 2.8591 cm-1 | Gray, Robiette, & Johns (1977) |
| = 913.473 cm-1 | Gray, Robiette, & Johns (1977) |
| = 0.247 debye | Keady & Ridgway (1993) |
| NH3 | |
| B = 9.9466 cm-1 | Urbanet al.(1983) |
| C-B = -3.7199 cm-1 | Urbanet al.(1983) |
| = 932.434 cm-1 | Urbanet al.(1983) |
| = 0.24 debye | Nakanaga, Kondo, & Saeki (1985) |
2.4 Analysis method
For each star and target molecule, the analysis strategy for ISI spectral line data was straightforward and had three major steps.
-
1.
The dust shell was modelled in order to have a reasonable approximation of the continuum source. This has been done in Paper II, where coeval continuum visibility data were used to create appropriate dust shell models of the astrophysical sources under study.
-
2.
Molecules were assumed to form at a given radius from the star and flow out uniformly. Theoretical spectral line profiles were then calculated to fit both ISI measurements and also previous observations of spectral line depths and ratios. Lines of various excitation energies were used (when available) in order to probe the abundance, temperature, and turbulent structure of the gas. This level of analysis relied heavily on the careful modeling pre-existing in the astrophysics literature.
-
3.
Theoretical visibilities on and off the spectral line were calculated and compared to the observed visibility ratios. The radius of molecular formation set in step 2 was varied until all available data were satisfactorily fit.
This method allows one to distinguish between gas models with high molecular abundance far from the star and those with lower molecular abundance close to the star in two different ways. While the line depth of a given transition can always be fit by varying the abundance and mean gas temperature, the relative line depths of transitions with different excitation energies can not. This probe of the average excitation temperature, when coupled with estimates of the radial temperature profile and assumption of uniform outflow, can be used to infer the location of molecular formation (e.g., Keady & Ridgway (1993)). Here in this work, we also apply a second, more direct, approach by using an interferometer. With suitable spectral and spatial resolution, one can directly detect the absorption pattern when the molecules are sufficient close to the star. This is the main thrust of this paper, where we show that molecules within 40 R⋆would significantly modify the emission pattern in the line core, providing a method independent of the line ratio argument for detecting the presence of molecules close to the star.
2.5 Comparing model quantities to observations
After fully specifying the dust and gas characteristics, the Keady code returns a spectral line profile and monochromatic radial emission profiles. This section discusses some of the details regarding comparison of the modelling results with ISI filterbank data.
2.5.1 Spectral line profiles
Because of the heterodyne detection scheme, mid-infrared radiation arriving outside of the primary beam of the interferometer was not seen. This had a small effect on the depth of the spectral line, since only a fraction of the molecular absorption occurs in the outer envelope. The effect was compensated for by multiplying the angular distribution resulting from monochromatic radial emission calculations by the effective primary beam of FWHM 3 ″(see Paper II for more discussion) and then adjusting the flux level accordingly. All spectral profiles shown in the next sections have had this correction applied.
Next, the finite bandwidth of the filterbank observations and the double-sideband (DSB) nature of the detection were accounted for. The bandpass center frequency and width were used to determine the average depth of the calculated spectral line for a corresponding single-sideband (SSB) observation. The dilution of the line depth due to the combination of the “uninteresting” additional continuum sideband encountered in practical observation was accounted for by dividing the SSB line depth by 2. This resulting DSB (diluted) line depth was then compared to observations with the filterbank.
Figure 1 shows one of the output figures from the modeling analysis suite. The bandwidth of the observation is marked off by vertical dashed lines, and line diagnostics have been calculated. The line width and average DSB line depth were also calculated for comparison with spectral line observations. Other quantities were also determined, such as the equivalent width, which were useful when comparing with lower spectral resolution data.

2.5.2 Visibility ratios
The basic observable of the filterbank experiment is the visibility ratio on the spectral line compared to the dust continuum. Monochromatic radial emission profiles were calculated at 10 specific frequencies across the spectral line, sampling the stellar continuum as well as the entire absorption region. The double-sideband, radial emission profile for the finite bandwidth selected by the filterbank was determined by a flux-weighted average of the emission profiles inside the observation bandwidth and an equal bandwidth of continuum. This resultant profile was multiplied by the effective primary beam and the visibility then calculated. The visibility curve of the continuum emission was calculated as well, and the visibility ratio (on the line compared to the continuum) as a function of baseline was then determined.
Figures 1-3 illustrate this entire process, showing example output at every stage of the analysis process for a silane line around IRC +10216. All subsequent model visibility ratios have been processed in identical fashion, but these diagnostic plots are not presented for brevity. The particular gas model shown in figures 1-3 has a silane formation radius of only 10 R⋆, small enough to produce a large change in the visibility on and off the spectral line. Since the filterbank system measures a visibility ratio, the radial emission profiles were usually of only secondary interest, and more emphasis was placed on interpretations of ratios.
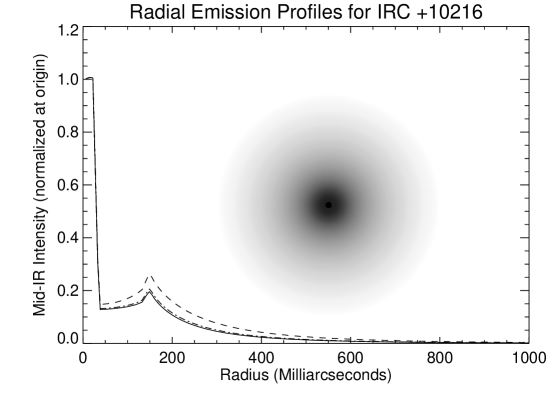
To facilitate a better understanding of the visibility data, example brightness profiles appear in figure 2. The bright spike at the origin is from stellar photospheric emission seen through the dust and gas, while the secondary peak at 150 mas reveals the location of the dust shell inner radius. It is important to note that while the star itself clearly shines through the dust envelope (it is the highest surface brightness feature of the nebula), it contributes a tiny percentage of the total mid-IR emission due to the large size of the dust shell. The inset image is a two-dimensional representation of the absorption region defined by the ratio of the absorption core to the continuum profiles. One can see that absorption for this model is indeed highest near the center of the dust shell. The basic point of the filterbank experiment was to measure the size of this absorption region.

Figure 3 shows the visibility curves corresponding to the emission profiles of figure 2. The various curves are described in the figure caption, and show the effects of applying the instrumental corrections discussed in this section. In this case, a visibility ratio of about 0.92 would be expected for the range of baselines observed (2-4 m).
The analysis process discussed above took into account all the practical details of the experiment: finite bandwidth, primary beam, double-sideband detection. The next sections present the data from the filterbank experiment and detail the modeling results.
3 Interferometry on Spectral Lines: Results
Spectral line observations were carried out for two target sources, the carbon star IRC +10216 and the red supergiant VY CMa. General introductions to both of these stars, including discussions of previous continuum observations, can be found in Paper II. A summary of all the filterbank data can be found in figure 4; details will be discussed in subsequent sections. Recall from Paper I that the ratio of the visibility on the line compared to off the line is made from dividing the fringe amplitude ratio by the infrared power ratio. Hence, in figure 4, the “Visibility Ratios” were derived from the “Fringe (Amplitude) Ratios” and the “IR Power Ratios,” and do not represent an independent set of measurements. See tables of line frequencies in Monnier (1999, tables C.4 & C.5) for more information regarding specific molecular transitions.
3.1 Comparison with previous spectroscopic results
While the interferometric data presented here are the first of its kind, the depths of the spectral lines have been observed before. Figure 5 shows a comparison of all the lines observed with the double-sideband line depths observed by Goldhaber (1988). While the agreement is good in general, there is a clear signal that the line depths measured in 1998 were slightly deeper around IRC +10216 than the mid-1980s observations of Goldhaber. There are many possible explanations for this. Changes in the dust shell geometry, molecular abundance, as well as different seeing conditions during the observations themselves can cause small changes in the line depth. However, the good overall agreement is confirmation that the circumstellar environments important for forming these spectral lines around both VY CMa and IRC +10216 have not changed radically in the last decade, justifying the use of previous modeling efforts (Goldhaber (1988); Keady & Ridgway (1993)) in developing molecular gas models (see modeling step 2 in §2.4).
4 IRC +10216
A journal of spectral line observations for IRC +10216 can be found in table 2, while a full and concise summary of the data appears in table 3. Separate modeling for both molecules, SiH4 and NH3, is presented below.
| Target | Target | LO | LO | LO | Dates |
|---|---|---|---|---|---|
| Molecule | Transition | Molecule | Transition | Wavelength | (U.T.) |
| (m) | |||||
| SiH4 | R-(00) A2-A1 | 13C18O2 | P(20) | 10.945 | 1998 Nov 05, Nov 06, Nov 13 |
| SiH4 | R-(03) F2-F1 | 13C16O2 | R(10) | 10.318 | 1998 Oct 18, Oct 19, Nov 21 |
| SiH4 | R-(03) A1-A2 | 13C18O2 | P(10) | 10.853 | 1998 Nov 04, Nov 10, Nov 14 |
| SiH4 | R-(09) A2-A1 | 13C16O2 | R(30) | 10.694 | 1998 Oct 27, Oct 28, Nov 27, Dec 03, Dec 11 |
| NH3 | aQ(3,3) | 12C16O2 | P(34) | 10.741 | 1998 Oct 20, Oct 21, Oct 22, Nov 20 |
| Target | Target | Bandwidth of | Fringe | IR | Visibility | |
|---|---|---|---|---|---|---|
| Molecule | Transition | Filterbank | Amplitude | Power | Ratio | |
| (MHz) | (km s-1) | Ratio | Ratio | |||
| SiH4 | R-(00) A2-A1 | 180 | 1.97 | 0.881 0.013 | 0.890 0.006 | 0.990 0.016 |
| SiH4 | R-(03) F2-F1 | 180 | 1.86 | 0.912 0.013 | 0.907 0.011 | 1.006 0.019 |
| SiH4 | R-(03) A1-A2 | 180 | 1.95 | 0.871 0.019 | 0.855 0.008 | 1.019 0.024 |
| SiH4 | R-(09) A2-A1 | 180 | 1.93 | 0.946 0.031 | 0.972 0.007 | 0.973 0.033 |
| NH3 | aQ(3,3) | 180 | 1.93 | 0.881 0.024 | 0.881 0.020 | 1.000 0.035 |
4.1 Silane in IRC +10216
4.1.1 Previous work
The mid-infrared transitions of silane around IRC +10216 have been observed by Goldhaber & Betz (1984), Goldhaber (1988, hereafter G88), Keady & Ridgway (1993, hereafter KR93), and Holler (1999). Goldhaber and colleagues used a heterodyne spectrometer which produced the highest spectral resolution data, fully resolving the absorption line cores (spectral resolution 0.2 km s-1). KR93 employed a Fourier Transform Spectrometer at Kitt Peak with somewhat lower spectral resolution, about 3 km s-1, sufficient to determine the spectral line strengths but insufficient to fully resolve the cores. Holler used a broadband RF spectrometer coupled to the heterodyne detection system of the ISI, resulting in sub- km s-1spectral resolution (also see Isaaket al.[1999]). Because the line depths have remained largely unchanged over the last 15 years, the modeling results of these workers was assumed to hold true today. The most detailed analysis can be found in KR93, and their gas model parameters were a starting point for the analysis which follows.
KR93 found a relative abundance of silane compared to molecular hydrogen of 2.210-7 with a rotational temperature law, T (r is expressed in units of stellar radii), which falls off slightly faster than the dust temperature. The calculated column density was 2.21015 cm-2. In addition, Tvib was taken to be about 85% of the Trot to match the weak emission observed in the higher J lines. These results assumed spherical symmetry, a uniform outflow of 14 km s-1outside of 20 R⋆, and a microturbulent velocity of 1 km s-1. It was found that the line ratios were much better fit by truncating the silane distribution inside 40 R⋆, and KR93 concluded that silane must be forming in the outflow at about this radius. With these assumptions, KR93 was able to satisfactorily match the line strengths of 7 silane transitions and the spectral profile of one of Goldhaber’s high spectral resolution profiles. Holler (1999) estimated the column density of SiH4 from data taken in May 1999 using one ISI telescope and found it consistent with previous measurements (2.71015 cm-2).
4.1.2 Visibility observations
Table 3 reports the visibility ratios on and off of various silane absorption features in Fall 1998. A stellar recessional velocity of VLSR=-26.0 km s-1has been used to convert VLSR to expansion velocity, based on G88. In all cases, the visibility ratio has been observed to be consistent with unity, and data from all baselines (2-4 m) have been averaged together. Qualitatively, this implies that the absorption region is large compared to the spatial resolution of the interferometer baseline, 0.4″.
The model for the molecular envelope developed in KR93 was combined with the new dust shell model from Paper II as a starting point for this modeling work. In particular, the same power law relation for the rotational temperature was used and the vibrational temperature was set equal to 85% of the dust temperature. A microturbulent velocity of 0.6 km s-1was used to match the line widths observed by Goldhaber (1988). Next, a series of gas models was calculated using different silane formation radii: 10 R⋆, 40 R⋆, and 80 R⋆. The silane abundances were then scaled to match the average line depths of the observed transitions. For each of these 3 gas models and for all 4 observed lines, the visibility ratios of the line compared to the continuum were calculated and compared to observations.
The results of these models appear in figure 6. Indeed, gas models with largest formation radii fit the line depths of the four lines the best, as was found by KR93, implying a relatively low overall rotational temperature of the absorbing molecules. In addition, the importance of the visibility ratio observations made with the ISI and filterbank can be seen. For formation radii less than about 40 R⋆, the predicted visibility ratios are significantly below unity. Even for a formation radius of 40 R⋆ (the choice preferred by KR93 based on spectroscopy alone), the visibilities in the spectral lines are too small to be consistent with observations (although not strongly ruled out). The column density for the most favored 80 R⋆ model was found to 1.31015 cm-2 (2.01015 cm-2 for the 40 R⋆ case).
Since we have measurements of 4 lines of differing rotational excitation energies, the sensitivity of the visibility ratios to the rotational temperature law can be investigated. Models with identical gas density distributions were run using Trot=Tvib=Tdust, and the results for these calculations can be found in figure 7. This temperature law does not fit the line depths as well as the first set of models, supporting the adoption of the empirical temperature fall-off of KR93. Alternatively, the population of low-lying J transitions could be enhanced if the mass-loss rate was higher in the past; this would have the effect of increasing the density of cold silane, increasing the molecular absorption from the ground state. The visibility ratios are similar to those found in the KR93-based models above and the earlier conclusion of a large molecular formation radius is supported and now shown to be insensitive to choice of temperature profile.
4.1.3 Conclusions
In short, the filterbank observations largely confirm the conclusions of KR93; namely, that silane must be forming at a large distance from the star. The visibility data directly measures the size of the absorption region to be larger than 0.4″and favors a formation radius even larger than that proposed by KR93. The combination of spectroscopy and interferometry convincingly demonstrates that silane is forming at a radius of 80 R⋆. The visibility data are only able to set a lower limit on the formation radius since no visibility difference on and off the line was detected within the experimental uncertainty.
For the stellar radius of 22 mas used in the model and a distance of 135 pc, 80 R⋆ corresponds to about 240 AU from the star. It is not clear why silane would begin to form at so remote a location in the outflow. The densities of the atomic constituents of silane are proportional to r-2 for a uniformly expanding envelope and would act to shut off chemical reactions which are density-dependent. If silane is formed on the surfaces of grains, then the gas phase density of silicon (and its compounds) may not be so important, but rather the amount of gas-phase silicon and H2 adsorbed onto grains. Adsorption of H2 on the grain surfaces would probably be small at the higher temperatures (1000-1400 K) where dust forms, and be more pronounced at larger distances form the star (for example, see calculations of Leitch-Devlin & Williams [1985]). In these models, the temperatures of the gas and dust are about 290 K at 40 R⋆and 200 K at 80 R⋆.
Gas-phase SiS, which forms in abundant quantities in the photosphere, has been predicted to be depleted significantly by adsorption onto grains (Glassgold & Mamon (1992)). In fact, depletion of SiS within 100 R⋆ has already been observed in both mid-infrared (Boyle et al. (1994)) and mm-wave transitions (Bieging & Nguyen-Quang-Rieu (1989); Bieging & Tafalla (1993)). We hypothesize that the large radius of SiH4 creation is related to the time-scale for this depletion process and/or the adsorption of H2 onto grains. It is hoped that the introduction of these new observations will stimulate renewed theoretical interest in understanding both the chemical origins and lineage behind the high abundance of silane around IRC +10216.
4.2 Ammonia in IRC +10216
4.2.1 Previous work
The mid-infrared rovibrational transitions of ammonia around IRC +10216 have been observed by Betzet al.(1979, hereafter B79), Goldhaber (1988, G88), Keady & Ridgway (1993, KR93), and Holler (1999). Some details regarding the spectrometers employed have already been summarized in §4.1.1. Because the line depths have remained essentially unchanged over the last 15 years, the modeling results of these workers are again assumed to be valid today. As in the case for silane, the most detailed analysis can be found in KR93, and their gas model parameters acted as a starting point for the analysis which follows.
KR93 found a relative abundance of ammonia compared to molecular hydrogen of 1.710-7 with a rotational temperature profile, T (r is expressed in units of stellar radii), a faster fall-off than the profile used for silane. Even with this steeper fall-off, the predicted depth of the lowest lying aR(0,0) line was much weaker than that observed, requiring either much colder or more dense gas in the outer envelope (400 R⋆). The calculated column density was 21015 cm-2, very similar to recent results from Holler (2.21015 cm-2, Holler (1999)). These results assumed spherical symmetry, a uniform outflow of 14 km s-1outside of 20 R⋆ , and a microturbulent velocity of 1 km s-1. Since a fit of the larger width of the high excitation aQ(6,6) line with a constant velocity flow was not possible, a more complicated velocity model was used which had the gas accelerating to terminal velocity at radii between 5 and 20 R⋆ (see figures 3a & 11 in KR93 for the velocity and density laws adopted).
Although unable to reproduce the line shapes in precise detail, the KR93 models were successful at qualitatively explaining the bulk of the spectroscopic observations available by placing the ammonia density peak around 12 R⋆. Importantly, these models represent ideal test cases for the filterbank experiment, because the presence of ammonia absorption inside of 20 R⋆ is expected to be clearly indicated by its visibility.
4.2.2 Results
Table 3 shows the ratio of the visibilities observed in and out of the aQ(3,3) NH3 absorption feature in the Fall of 1998. A stellar recessional velocity of VLSR=-26.0 km s-1has been used to convert VLSR to expansion velocity, based on G88. The filterbank bandpass selected (1.9 km s-1) was somewhat smaller than the full-width half-depth (FWHD) observed by G88, about 5 km s-1, and centered on the absorption core, corresponding to an outflow velocity of 14 km s-1. In this case, as for the silane observations, the visibility ratio was observed to be consistent with unity.
The modeling process began with the dust shell model from Paper II and the gas model developed in KR93. The same power law relation for the rotational temperature and a 1.0 km s-1microturbulent velocity was initially used. An ammonia density and velocity distribution similar to KR93 were used, although simplified. Specifically, the velocity was increased linearly from 0.1 to 14 km s-1between 3 and 20 R⋆. The ammonia density profile used started at 5 R⋆, peaked at 10 R⋆, and decreased outside of 20 R⋆ consistent with a uniform outflow (). This corresponded to a linearly increasing ammonia shell mass until 20 R⋆, where uniform outflow was assumed to begin. See figure 8 for a plot of the density profile used.
As was shown for silane in the last section, significant molecular absorption inside about 20 R⋆ necessarily results in substantial differences in interferometric visibilities on and off the spectral line. Figure 9 shows the spectral profile and visibility ratio for the above model of ammonia around IRC +10216, based on KR93, and also the spectral line data taken from G88. KR93 did not model this specific transition, so the agreement can not be expected to be precise; indeed, the line prediction is narrower than the profiles observed by Goldhaber. The density of ammonia has been adjusted to match the line depth observed in Fall 1998 within the bandpass of the ISI filterbank, resulting in a column density of 8.41015 cm-2 for this model.
The model visibility ratio at a spatial frequency of radians-1 is 0.926 compared to the observed ratio of 1.0000.035. This model is thus ruled out at a 2- level. This reinforces a conclusion from the modeling of silane: significant molecular absorption occurring within about 20 R⋆ for IRC +10216 results in a strong on-line and off-line difference in the interferometric visibilities, a signal not seen with the ISI filterbank experiment. The conclusions that ammonia forms at a distance of 20 R⋆from the star indicates that, as in the case of silane, ammonia molecules do not form near where the dust condenses but rather at lower temperatures and probably through surface adsorption. The dust grain temperature at 20 R⋆is 400 K in these models.
4.2.3 Discussion
There are other, purely spectroscopic, observations which also suggest that the explanation put forth by KR93 for the broad aQ(6,6) line, bulk acceleration of gas within 20 R⋆, may not be fully correct. KR93 did not attempt to fit the high spectral resolution profiles published in G88, which revealed details concerning the ammonia around IRC +10216 not reproduced by models relying on accelerating gas to broaden the absorption lines.
KR93 fit the aQ(6,6) line data originally published in B79 which was cut-off at -17 km s-1relative to the stellar velocity. Features broadened due to absorption by gas in the acceleration region would be asymmetric, with a sharp blue edge and significant red-shifted absorption by hot gas. Indeed, the model profiles of KR93 show this telltale characteristic (see figure 13 of KR93), but were unconstrained by the incomplete B79 published profile. Complete line profiles including the full blue-wing of the absorption feature were published in G88, revealing a rather symmetric line – at odds with KR93 model results.
Thus far, the linewidth data from G88 can not be reproduced in detail with this class of models, independent of the visibility data. The line widths were observed to increase with the energy of the rotational level. The 1- widths were measured to be 0.8 km s-1, 1.7 km s-1, and 3.1 km s-1for the aR(0,0), aQ(2,2), and aQ(6,6) transitions respectively, while the relative velocity of the core remained constant to within 1 km s-1. While a near-star acceleration law and suitably peaked ammonia distribution can be adjusted to reasonably fit the linewidth of any single transition (e.g., figure 9), the large increase between the aQ(2,2) and aQ(6,6) line is not reproduced. Furthermore, lines broadened by accelerating gas should show significant shifts in the location of the core as a function of excitation energy.
The presence of decaying gas turbulence outside the acceleration region may explain qualitatively the linewidth behavior and the lack of a significant difference in the visibilities. The inner dust shell of IRC +10216 is already known to be quite clumpy in near-infrared images (Weigelt et al. (1998); Haniff & Buscher (1998); Tuthill, Monnier & Danchi (1998); Monnier (1999); Tuthill et al. (2000)). Furthermore, dynamical models of dust shell production in carbon stars lead to large velocity dispersion as the individual shells of dust are accelerated (Winters et al. (1995); Weigelt et al. (1998); Winters et al. (1998)). Both turbulence and velocity gradients across individual dust shells (clumps) will cause significant broadening of lines formed in these regions. Under these conditions, one would also expect the doppler velocity of the core to be nearly constant, consistent with observations, but the line widths would naturally decrease for lines forming further in the outflow as sound waves (or weak shocks) bring the outflow into hydrostatic equilibrium. The dynamical dust shell models of Winterset al.could be coupled with the radiative transfer code of Keady to quantitatively test these suppositions (as for CO in Winterset al.[1998]).
There are other potential explanations for why absorption lines by high-J states are much broader than for lower-excitation states. For instance, if the high-J states are populated by shock-heating, one would expect a higher velocity dispersion due the turbulence and velocity shifts accompanying shocks. This class of explanation, whereby the excitation mechanism (and possibly even the formation mechanism) is directly related to peculiar local conditions (e.g., shocks, high velocity dispersion), needs further consideration.
4.3 Summary for IRC +10216
The narrow line widths of all the silane lines and the lack of an interferometric signal place the location of silane formation at or beyond 80 R⋆ outside the turbulent inner envelope. In addition, the lack of interferometric signal and the broad (symmetric) lines of ammonia place their formation outside of 20 R⋆, beyond the gas acceleration region, but in a turbulent (or clumpy) flow. These ideas are illustrated schematically in figure 10 and represent a significant improvement to our knowledge of the molecular stratification around IRC +10216.
5 VY CMa
While no silane has been observed in the oxygen-rich stellar wind of the red supergiant VY CMa, many absorption lines of ammonia have. A journal of these spectral line observations made with the ISI filterbank can be found in table 4.
| Target | Target | LO | LO | LO | Dates |
|---|---|---|---|---|---|
| Molecule | Transition | Molecule | Transition | Wavelength | (U.T.) |
| (m) | |||||
| NH3 | aQ(2,2) | 13C16O2 | R(24) | 10.738 | 1998 Oct 20, Oct 21, Oct 22, Nov 25 |
| NH3 | sP(4,3) | 13C16O2 | P(30) | 11.262 | 1998 Oct 27 |
| NH3 | aQ(6,6) | 13C16O2 | R(18) | 10.784 | 1998 Oct 18, Oct 19, Oct 28, Nov 05, Nov 24, Dec 11 |
| Target | Target | Bandwidth of | Fringe | IR | Visibility | |
|---|---|---|---|---|---|---|
| Molecule | Transition | Filterbank | Amplitude | Power | Ratio | |
| (MHz) | (km s-1) | Ratio | Ratio | |||
| NH3 | aQ(2,2) | 540 | 5.80 | 0.9330.022 | 0.932 0.012 | 1.001 0.027 |
| NH3 | sP(4,3) | 420 | 4.73 | N/A | 0.983 0.026 | N/A |
| NH3 | aQ(6,6) | 540 | 5.82 | 0.922 0.024 | 0.950 0.012 | 0.971 0.028 |
| NH3 | aQ(6,6) | 180 | 1.94 | 0.958 0.080 | 0.956 0.046 | 1.002 0.097 |
| Red Half | ||||||
5.0.1 Previous work
The mid-infrared transitions of ammonia around VY CMa were first observed by McLaren & Betz (1980). However, a larger set of data with better frequency coverage was published by Goldhaber (1988, G88) and these data have been used for subsequent consideration. Details regarding the capabilities of the heterodyne spectrometer employed can be found in §4.1.1. While McLaren & Betz reported a significant change in the line profile of NH3 aQ(2,2) between October 1978 and December 1979, the profile reported by G88 observed in September 1982 is nearly identical to the December 1979 data. In addition, the G88 line depth is consistent with the spectral data obtained by the filterbank in this paper (see table 5). In light of this consistency, the assumption that the G88 line profiles are still representative of the current epoch has been made.
All of the lines, aR(0,0), aQ(2,2), aQ(3,3), & aQ(6,6), observed by G88 possessed broad absorption features with 1- widths of 3.8 km s-1. The cores of the lines were centered around V km s-1, with the high excitation line cores being slightly less blue-shifted. Assuming a stellar recessional velocity of V km s-1(based on maser data), this corresponds to an outflow rate of 29 km s-1. Using these lines, G88 estimated a column density of ammonia of (64)1015 cm-2 using a simple model based on the Sobolev approximation. We have repeated these calculations using a similar gas model with the Keady code.
5.0.2 Results and models
Table 5 shows the visibility ratios observed on and off of a number of NH3 absorption features in Fall 1998. A stellar recessional velocity of VLSR=22.3 km s-1has been used to convert VLSR to expansion velocity, based on G88. The filterbank bandpasses selected were set to equal the full-width half-depths (FWHD) observed by G88, and were centered on the absorption cores. Data in table 5 represents a non-detection of the sP(4,3) line, which also had not been detected by any previous measurements. Just as for the IRC +10216 (see table 3), the visibility ratios were observed to be consistent with unity. In addition to the full aQ(6,6) absorption line, the red half of the line was observed separately in the hopes of observing the location of any accelerating gas. However, the SNR for this measurement (10) was not high enough to justify further modeling.
A simple gas model based on the line-fit of the aR(0,0) line in G88 was developed using the new VY CMa dust shell model of Paper II. Unlike the case for IRC +10216, the linewidths for the NH3 lines around VY CMa were all roughly the same. This fact and that the line core locations only showed a slight shift with excitation energy support a model in which the absorption lines all form mostly outside of the acceleration region. Therefore a constant outflow model was adopted using an expansion velocity of 29 km s-1, which matched the profiles of the aQ(2,2) and aQ(6,6) lines; the broad linewidths were created by model microturbulence of 3.5 km s-1.
The temperature of the J=K rotational states is controlled either by collisions, due to the lack of dipole transitions from these states to lower J, or by IR-pumping in the 6.1 m band (see §2.3.2). During modeling, this temperature profile is normally varied using a power-law (as by KR93) to empirically fit the line depth ratios. Unfortunately there were insufficient number of lines available in this case to utilize this strategy. An alternative scheme, in which two temperature profiles were assumed to represent reasonable limits, was used here:
-
1.
The rotational temperature was set equal to the dust temperature, Trot=Tdust. This corresponded to full coupling of the internal degrees of freedom of the gas molecules to the radiation field.
-
2.
TT, where r is expressed in units of stellar radii. This choice is similar to that found empirically for ammonia around IRC +10216 by Keady & Ridgway (1993). While VY CMa and IRC +10216 do have similar mass-loss rates (within a factor of 10), the differing chemistry (O-rich vs. C-rich) may affect the cooling rates, and this ad hoc temperature profile is clearly rather speculative.
Because G88 in most cases did not publish the emission components of the NH3 transitions, we were not able to model this aspect of the line profile. Instead we followed KR93 (for IRC +10216) and suppressed emission in our model profiles by assuming the vibrational temperature was 85% of the dust temperature.
Figure 11 shows the results assuming Trot=Tdust. The high optical depth at 11 m (, see Paper II) effectively shields the inner dust and molecular envelope from view. The =1 surface is located at about 12 R⋆ along the central impact parameter and hence most of the observed continuum emission is occurring outside of this. This explains why none of the models with molecular formation radii between 10-80 R⋆ were decisively ruled out with the interferometry data of figure 11. However, one can see that for this assumed temperature law, the line ratios were best fit by a molecular formation radius outside of 40 R⋆. Interestingly, this distance corresponds to the extent of the acceleration region deduced from proper motion studies of the H2O masers (Marvel (1996); Richards, Yates & Cohen (1998)). Figure 12 shows the results for the temperature profile of case 2, assuming TT; the same general conclusions still apply, showing that they are not highly model-dependent. It is worth noting that the equivalent widths for models with small molecular formation radii (especially for 10 R⋆) were systematically higher than those measured by G88. While the line depths in the filterbank bandpass were fitted by increasing the ammonia density, the linewidths themselves were not. Ideally, the microturbulence parameter should be adjusted for each set of molecular formation radii to compensate for differing line broadening effects, such as from thermal broadening and the finite size of the continuum source. Such adjustments did indeed improve the quality of these fits, but significantly increased the complexity of the modeling while only weakly affecting the line and visibility ratios.
5.0.3 Discussion
We conclude that NH3 probably forms near the termination of the acceleration phase in the circumstellar envelope of VY CMa (40 R⋆). This hypothesis is supported by the following observations:
-
•
Weak (but non-negligible) correlation of absorption core velocity with excitation energy suggests ammonia exists to a limited degree in the acceleration region.
-
•
Line ratios of the aQ(2,2) and aQ(6,6) transitions were best fitted by a molecular formation radii 40 R⋆, a result found to be insensitive to the rotational temperature profile.
-
•
The visibility data for the high excitation aQ(6,6) line marginally supports a large molecular formation radius, but the high optical depth of the dust shell makes the interferometric data relatively insensitive to absorption in the inner circumstellar envelope.
Around IRC +10216, high excitation NH3 lines were observed to be significantly broader than for the low-lying J-states. Interestingly, this behavior was not duplicated for NH3 around VY CMa. Unlike the case for IRC +10216, it appears that ammonia is forming at least partly in the acceleration region around this star and hence the line formation of all the transitions is more affected by large turbulence in this region. Alternatively, the highly asymmetric inner dust shell seen in the near-infrared (Monnier et al. (1999)) and hinted at by ISI visibility data (Paper II) may be influencing the line formation characteristics. If the outflow is significantly asymmetric, linewidths will be clearly affected by the varying projected outflow velocities of absorbing gas. Continued monitoring of water masers in the inner dust shell may clarify the gas dynamics and level of gas turbulence. This information will be critical for further progress in understanding the geometry of the molecular envelope around VY CMa.
6 Conclusions
We have presented the first interferometric results on mid-infrared spectral lines around evolved stars. Specific results for the carbon star IRC +10216 and the red superigant VY CMa have been summarized in previous sections. In addition, a few general conclusions can be drawn:
-
•
The formation radii of silane and ammonia are significantly beyond the dust formation zone for both evolved stars examined here.
-
•
Since dust formation by itself does not catalyze formation of these molecules, some other physical mechanism(s), still unknown, must be at play. Probably the adsorption of gas-phase molecules (e.g., SiS or H2) onto grains set the time/length-scale for the important chemical reactions occurring on the grain surfaces.
-
•
When coupled with spectroscopic observations, these results indicate that turbulence, or velocity dispersion, is quite high in the inner envelope and is more likely responsible for the broad linewidths of high excitation transitions than bulk acceleration.
Acknowledgements.
The authors would like to recognize W. Fitelson, C. Lionberger, and M. Bester for important contributions to the construction and software development of the filterbank, and K. McElroy for observing assistance. We also acknowledge productive discussions with A. Glassgold and A. Betz. JDM also would like to thank J. Keady for kindly allowing his sophisticated radiative transfer code to be used for this project, and for many stimulating discussions about the molecules of IRC +10216. This work is part of a long-standing interferometry program at U.C. Berkeley, supported by the National Science Foundation (Grant AST-9221105, AST-9321289, and AST-9731625) and by the Office of Naval Research (OCNR N00014-89-J-1583).References
- Betz, McLaren & Spears (1979) Betz, A. L., McLaren, R. A. & Spears, D. L. 1979, ApJ, 229, L97 [B79]
- Bieging & Nguyen-Quang-Rieu (1989) Bieging, J. H. & Nguyen-Quang-Rieu 1989, ApJ, 343, L25
- Bieging & Tafalla (1993) Bieging, John H. & Tafalla, Mario 1993, AJ, 105, 576
- Boyle et al. (1994) Boyle, R. J., Keady, J. J., Jennings, D. E., Hirsch, K. L. & Wiedemann, G. R. 1994, ApJ, 420, 863
- Burrows & Sharp (1999) Burrows, A. & Sharp, C. M. 1999, ApJ, 512, 843
- Cherchneff & Glassgold (1993) Cherchneff, Isabelle & Glassgold, Alfred E. 1993, ApJ, 419, L41
- Danchi et al. (1994) Danchi, W. C., Bester, M., Degiacomi, C. G., Greenhill, L. J. & Townes, C. H. 1994, AJ, 107, 1469
- Glassgold & Mamon (1992) Glassgold, A.E. & Mamon, G.A. 1992, Chemistry and Spectroscopy of Interstellar Molecules, 261
- Glassgold (1998) Glassgold, A. E. 1998, IAU Symposia, 191, 337
- Goldhaber & Betz (1984) Goldhaber, D. M. & Betz, A. L. 1984, ApJ, 279, L55
- Goldhaber (1988) Goldhaber, D. M. 1988, University of California at Berkeley, PhD Dissertation [G88]
- Gray et al. (1977) Gray, D. L., Robiette, A. G., & Johns, J. W, 1977, Molecular Physics, 34, 1437
- Haniff & Buscher (1998) Haniff, C. A. & Buscher, D. F. 1998, A&A, 334, L5
- Holler (1999) Holler, C. 1999, Ludwig-Maximilians-Universitaet, Master’s Thesis
- Isaak, Harris & Zmuidzinas (1999) Isaak, K., Harris, A. I. & Zmuidzinas, J. 1999, Highly Redshifted Radio Lines, ASP Conf. Series Vol. 156, Ed. by C. L. Carilli, S. J. E. Radford, K. M. Menten, & G. I. Langston. ISBN 1-886733-76-7, p. 86., 86
- Keady (1982) Keady, J. J. 1982, New Mexico State University, Ph.D. Dissertation
- Keady, Hall & Ridgway (1988) Keady, J. J., Hall, D. N. B. & Ridgway, S. T. 1988, ApJ, 326, 832
- Keady & Ridgway (1993) Keady, J. J. & Ridgway, S. T. 1993, ApJ, 406, 199 [KR93]
- Lafon & Berruyer (1991) Lafon, J.-P. J. & Berruyer, N. 1991, A&A Rev., 2, 249
- Lafont, Lucas, & Omont (1982) Lafont, S., Lucas, R. & Omont, A. 1982, A&A, 106, 201
- Leitch-Devlin & Williams (1985) Leitch-Devlin, M. A. & Williams, D. A. 1985, MNRAS, 213, 295
- Marvel (1996) Marvel, K. B 1996, New Mexico State University, Ph.D. Dissertation
- Mathis, Rumpl & Nordsieck (1977) Mathis, J. S., Rumpl, W. & Nordsieck, K. H. 1977, ApJ, 217, 425
- McLaren & Betz (1980) McLaren, R. A. & Betz, A. L. 1980, ApJ, 240, L159
- Mihalas, Kunasz & Hummer (1975) Mihalas, D., Kunasz, P. B. & Hummer, D. G. 1975, ApJ, 202, 465
- Monnier (1999) Monnier, J. D. 1999, University of California at Berkeley, PhD Dissertation
- Monnier et al. (1999) Monnier, J. D., Tuthill, P. G., Lopez, B., Cruzalebes, P., Danchi, W. C. & Haniff, C. A. 1999a, ApJ, 512, 351
- (28) Monnier, J. D., Fitelson, W., Danchi, W. C., & Townes, C. H. 2000, ApJS, in press [Paper I]
- (29) Monnier, J. D., Danchi, W. C., Hale, D. S., Lipman, E. A., Tuthill, P. G., & Townes, C. H. 2000, ApJ, in press [Paper II]
- Nakanaga et al. (1985) Nakanaga, T., Kondo, S. & Saeki, S. 1985, Journal of Molecular Spectroscopy, 112, 39
- Richards, Yates & Cohen (1998) Richards, A. M. S., Yates, J. A. & Cohen, R. J. 1998, MNRAS, 299, 319
- Shu (1991) Shu, F. H. The physics of astrophysics. Vol.1: Radiation, University Science Books (Mill Valley, CA), 1991
- Townes & Shawlow (1975) Townes, C. H., & Schawlow, A. L. 1975, Microware Spectroscopy, Dover Publications, Inc. : New York
- Tuthill, Monnier & Danchi (1998) Tuthill, P. G., Monnier, J. D., & Danchi, W. C. 1998, IAU Symposia, 191, 331
- Tuthill et al. (2000) Tuthill, P. G., Monnier, J. D., Danchi, W. C., & Lopez, B. 2000, ApJ, in press
- Urban et al. (1983) Urban, S. , Papousek, D., Kauppinen, J., Yamada, K., & Winnewisser, G. 1983, Journal of Molecular Spectroscopy, 101, 1
- Weigelt et al. (1998) Weigelt, G., Balega, Y., Bloecker, T., Fleischer, A. J., Osterbart, R. & Winters, J. M. 1998, A&A, 333, L51
- Willacy & Cherchneff (1998) Willacy, Karen & Cherchneff, Isabelle 1998, A&A, 330, 676
- Winters et al. (1998) Winters, J. M., Keady, J. J., Fleischer, A. J. & Gauger, A. 1998, A Half Century of Stellar Pulsation Interpretation: A Tribute to Arthur N. Cox, edited by Paul A. Bradley and Joyce A. Guzik, Proceedings of a Conference held in Los Alamos, NM 16-20 June 1997, ASP Conference Series #135, p. 337., 337
- Winters et al. (1995) Winters, J. M., Fleischer, A. J., Gauger, A. & Sedlmayr, E. 1995, A&A, 302, 483
- Wolfire & Cassinelli (1986) Wolfire, Mark G. & Cassinelli, Joseph P. 1986, ApJ, 310, 207