Wide-Field Thermal Imaging of the Orion Nebula
at High Spatial Resolution
Abstract
We describe multi-wavelength (8–20m), diffraction-limited, mid-infrared images of the OMC-1 cloud core in Orion, covering an approximately two arcminute area around the Trapezium and BN/KL regions. We have detected mid-infrared emission at the locations of a subset of the previously identified proplyds in the Orion Nebula along with two new infrared sources. The Ney-Allen nebula surrounding the OB star Ori D exhibits a ring or toroidal structure at the longest wavelengths. The BN/KL complex appears as an extended, butterfly-shaped structure with significant bipolar symmetry which is bifurcated by a dust lane at the longer wavelengths. The infrared sources IRc3, 4, and 5 give the appearance of a ring-like structure with a possible jet-like protrusion from its center along a line from IRc2. Derived color temperature and dust opacity maps suggest that IRc3, 4, and 5 may not be self-luminous objects.
Astronomy Department, Boston University,
725 Commonwealth Avenue, Boston, MA 02215
deutschl, mkassis, nathans@bu.edu
Smithsonian Astrophysical Observatory,
60 Garden Street MS/65, Cambridge, MA 02138, USA
jhora, gfazio@cfa.harvard.edu
Steward Observatory, University of Arizona,
933 North Cherry Avenue, Tucson, AZ 85721, USA
hbutner, whoffman@as.arizona.edu
Infrared Processing and Analysis Center,
MS 100-22, Caltech, Pasadena, CA 91125, USA
adayal@ipac.caltech.edu
1. Introduction
The OMC-1 cloud core in Orion contains two areas of active and recent star formation, namely the Trapezium Cluster in the Orion Nebula and the embedded BN/KL region, where the surrounding dense envelope of dust and gas conceals many of the important processes underway. Mid-infrared observations offer an opportunity to probe the physical properties of deeply embedded star formation regions. First, mid-infrared wavelengths suffer less extinction than shorter wavelengths due to scattering by dust. Second, mid-infrared observations trace the presence of warm dust (through thermal emission), which can be used to gain an understanding of the overall thermal structure of a region. Third, mid-infrared observations can help define the dust properties through the detection of spectral features such as the well known silicate band at 9.7m and the ‘unidentified infrared’ (UIR) emission bands attributed to polycyclic aromatic hydrocarbons, or PAHs. A number of investigators have looked at these regions at near- and mid-infrared wavelengths over the past 30 years: see, e.g., Becklin & Neugebauer (1967), Kleinmann & Low (1967), McCaughrean & Gezari (1991), Dougados et al. (1993), Gezari & Backman (1994), Hayward, Houck, & Miles (1994), McCaughrean & Stauffer (1994), Morino et al. (1998), Gezari, Backman, & Werner (1998), and references therein. See also the chapters by Allen & Hillenbrand, McCaughrean, and Schreyer, Henning, & Wiesemeyer.
Due to the technology available at the time, most previous mid-infrared imaging studies of the region covered either a large area at low spatial resolution or a smaller area in detail. Here we present new large-field, diffraction-limited, multiwavelength, and deep images covering an approximately 22 arcminute field containing the BN/KL and Trapezium regions in Orion, made using MIRAC2 (Mid-infrared Array Camera, Hoffmann et al. 1998; see also http://cfa–www.harvard.edu/jhora/mirac/mirac.html). These images have uncovered new information about embedded sources and circumstellar and extended material in these regions of active star formation. We present here a brief summary of our observational results.
2. Observations
Mid-infrared images at 8.8, 10.3, 12.5, and 20.6m were made using MIRAC2 on the 3.0 m NASA Infrared Telescope Facility on 7–11 October 1995. Chop-nod images acquired in 33 or 44 (at 20.6m) raster patterns centered on the Trapezium were registered using the commanded telescope offsets. The image scale at all wavelengths was 0.34 arcsec/pixel. The mosaicked field of 2.12.1 arcmin covers both the Trapezium and BN/KL regions, and the final mosaics are made of 80–170 individual 10 second images coadded. The mosaics were calibrated using images of the standard star Tau. The measured FWHMs for Tau at 8.8, 12.5, and 20.6m were equal to the diffraction limit values of 0.7, 1.0, and 1.7 arcsec, respectively. The NEFDs (equivalent to the 1 detection limit) for a point source are 9, 22, and 200 mJy, and the 1 background values are 0.3, 0.5, and 3.0 mJy, at 8.8, 12.5, and 20.6m respectively.
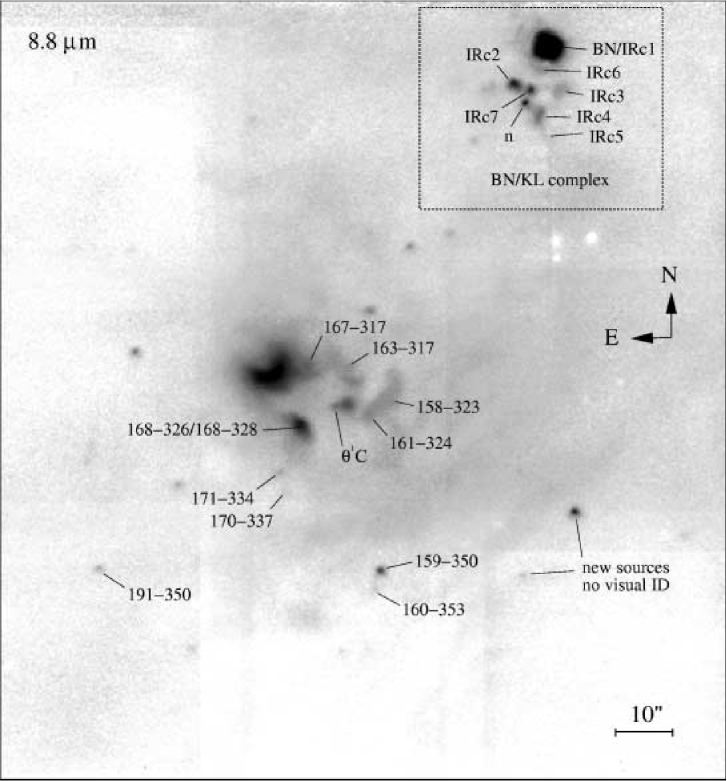
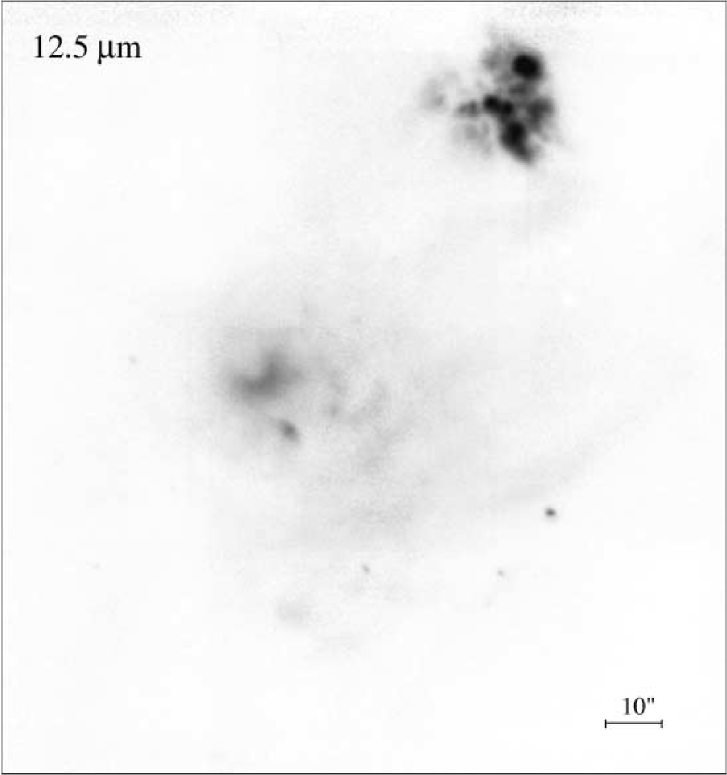
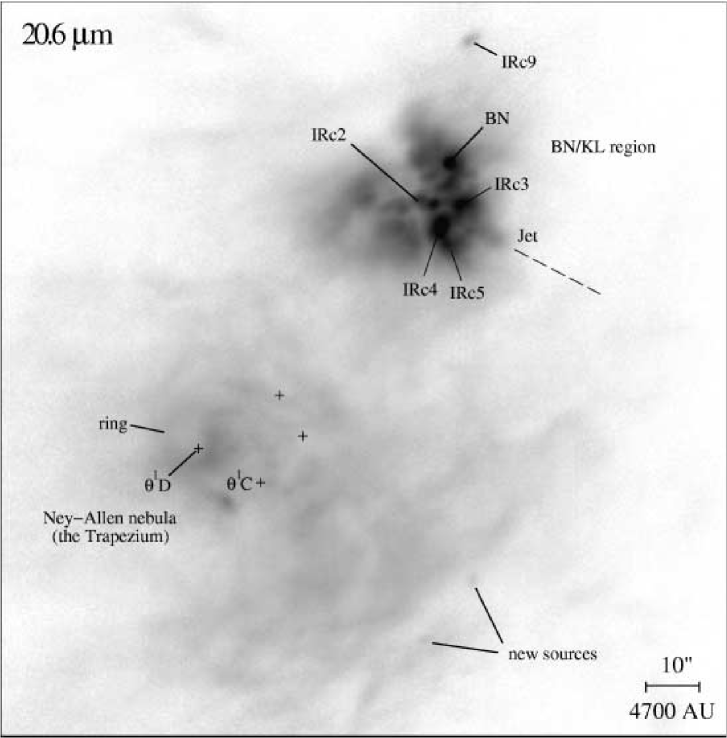
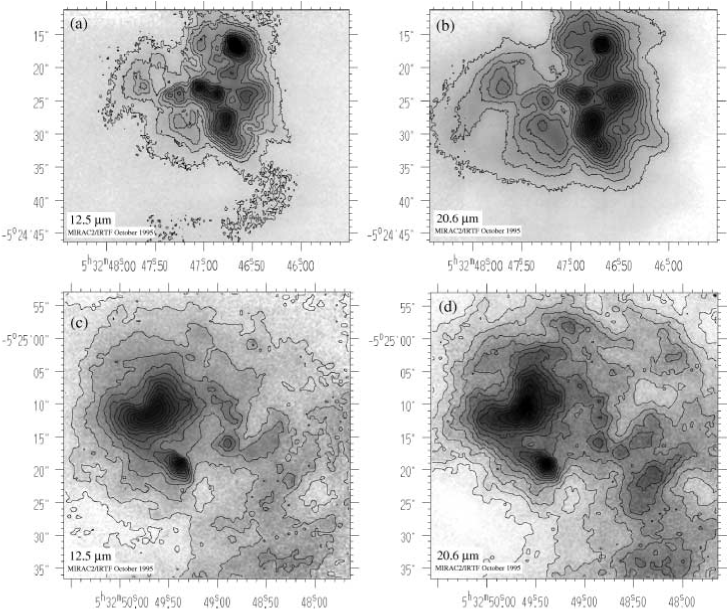
Figures 1, 2, and 3 show the mosaics at 8.8, 12.5, and 20.6m respectively (the 10.3m image is not shown). Figure 4 then shows close-up views of the Trapezium and BN/KL regions at 12.5 and 20.6m with overlaid contours.
3. The Trapezium Region
In the region surrounding the Trapezium OB stars, we detect mid-infrared emission at the locations of eleven proplyds (protoplanetary disks; see the chapter by McCaughrean) previously identified at optical and radio wavelengths (Laques & Vidal 1979; Churchwell et al. 1987; Garay, Moran, & Reid 1987; O’Dell, Wen, & Hu 1993; O’Dell & Wong 1996). In the nomenclature defined by O’Dell & Wen (1994), these proplyds are 158-323, 159-350, 160-353, 161-324, 163-317, 167-317, 168-326, 168-328, 170-337, 171-334, and 191-350: their locations are marked on the 8.8m mosaic (Fig 1). There are many other proplyds for which no mid-infrared emission is detected. The 8.8m mosaic also shows previously known arc-like structures (Hayward et al. 1994) containing some of the proplyds and curving away from Ori C.
From our derived 12.5m/20.6m color temperature map (not shown), we find that the strongest temperature peak in this region is coincident with Ori D. The extended, diffuse emission in the area which contains most of the proplyds around Ori D is elevated in temperature ( 110–130 K), and many of the detected proplyds are identified as distinct temperature peaks above the level of this diffuse emission. The arcs are also distinctly traced as 120 K structures on top of 110 K diffuse emission.
We have also detected two new sources without optical counterparts, about 50 arcsec southwest of the Trapezium. These lie in the vicinity of the OMC-1S complex, a site of ongoing star formation which includes a number of embedded near-infrared sources (McCaughrean 1988; Gaume et al. 1999), H2O masers (Gaume et al. 1998), and two or more highly-collimated molecular outflows (Ziurys, Wilson, & Mauersberger 1990; Schmid-Burgk et al. 1990; McMullin, Mundy, & Blake 1993; Rodríguez-Franco, Martín-Pintado, & Wilson 1999a, 1999b). Our 12.5m/20.6m color temperature map identifies the two sources as strong temperature peaks in the region, suggesting that they are self-luminous, with derived color temperatures of 225 K for the brighter northeast source and 180 K for the fainter southwest source. The new sources lie some 10–20 arcsec north of the origin of the OMC-1S outflows, and while they have no optical counterparts, they are seen to be coincident with very red near-infrared sources on the periphery of the OMC-1S core (see the chapter by McCaughrean).
The Ney-Allen nebula around Ori D appears to have a ring-like or toroidal structure as an extension to its familiar crescent shape. This structure is most apparent in the 20.6m image and color temperature maps. In addition, the dust opacity map (not shown) derived from the color temperature and 12.5m intensity maps shows an opacity ‘hole’ coincident with the center of the ring structure.
Finally, the strong, extended, diffuse emission throughout this region is seen to dominate at the longer wavelengths, with the relative contribution more compact sources such as the Ney-Allen nebula and proplyd-containing structures decreasing with wavelength.
4. The BN/KL Complex
The structure of the BN/KL region changes markedly as we look at longer mid-infrared wavelengths. At 8.8m (Figure 1), the BN object or IRc1 is by far the brightest source in the field, followed by IRc2, IRc7, and source ‘n’ of Lonsdale et al. (1982). The individual sources appear relatively compact, and there is little apparent extended or diffuse emission associated with them. In the 10.3m image (not shown), silicate absorption is clearly present. By 12.5m (Figure 2), IRc3, 4, and 5 are substantially increased in relative brightness compared to the other sources in the field. A clumpy, apparently bipolar structure is present which is bifurcated by a dark dust lane at a position angle of approximately 30∘. The brighter half of this ‘butterfly’ includes the known IRc sources such as IRc1, 2, 3, 4, 5, and 7, while the fainter half extends to the east with some symmetry in the location of clumps or sources between the two sides. A jet-like structure can be seen in the southwest which appears to lie along a line that includes IRc2 and passes through a ring-like structure defined by IRc3, 4, and 5. This collimated structure appears to coincide with slow, outflowing water masers (Genzel et al. 1985; see also the chapter by Schreyer et al.). At 20.6m, the eastern half of the ‘butterfly’ shows even greater extension and intensity, and the symmetry of the structures in the two halves is quite pronounced. At both 12.5 and 20.6m, a faint source appears just to the northeast of IRc2 in the center of a large, dark ‘hole’ between the two sides at the top of the dark lane. This source may lie along the line through the jet-like structure to the southwest. Also, by 20.6m, IRc4 becomes brighter than the BN object, and IRc9 can be seen as an elongated object north of BN (only the 20.6m image extends far enough north to include IRc9).
A derived color temperature map reveals that BN and IRc2 are the dominant temperature peaks in the region, in agreement with previous results (Wynn-Williams et al. 1984; see also the chapter by Schreyer et al.). Temperatures in the region away from these two temperature peaks fall in the range of 100–140 K. IRc3 and 5 do not correspond to color temperature peaks, but do correspond to dust opacity peaks, suggesting that they are not self-luminous sources. IRc4 and the faint source northeast of IRc2 correspond to slight local temperature increases. However, IRc4 is a definite opacity peak, while the faint northeast source is in an opacity hole. The pattern of the temperature contours follows the ring-like structure seen in the intensity images for IRc3, 4, and 5. Another source in the eastern half of the ‘butterfly’, just to the east of IRc2, shows up as both a local temperature peak and an opacity minimum. Finally, we see that the entire BN/KL region has a much higher average opacity than the region around the Trapezium OB stars.
This brief overview of the results from our imaging work will be followed by a full analysis in another paper presently in preparation.
Acknowledgments.
The MIRAC2 project has been supported by the National Science Foundation, the National Aeronautics and Space Administration, Steward Observatory of the University of Arizona, and the Smithsonian Astrophysical Observatory. Lynne Deutsch and William Hoffmann were visiting astronomers at the NASA Infrared Telescope Facility. We thank Mrinal Iyengar, Mari Paz Miralles, and the IRTF staff for assistance at the telescope.
References
Becklin, E. E., & Neugebauer, G. 1967, ApJ, 147, 799
Churchwell, E. B., Felli, M., Wood, D., & Massi, M. 1987, ApJ, 321, 516
Dougados, C., Léna, P., Ridgway, S. T., Christou, J. C., & Probst, R. G. 1993, ApJ, 406, 112
Garay, G., Moran, J. M., & Reid, M. J. 1987, ApJ, 314, 535
Gaume, R. A., Wilson, T. L., Vrba, F. J., Johnston, K. J., & Schmid-Burgk, J. 1998, ApJ, 493, 940
Genzel, R., Reid, M. J., Moran, J. M., & Downes, D. 1981, ApJ, 244, 884
Gezari, D. Y. & Backman, D. E. 1994, in Infrared Astronomy with Arrays: The Next Generation, ed. I. S. McLean, (Dordrecht: Kluwer), 195
Gezari, D. Y., Backman, D. E., & Werner, M. W. 1998, ApJ, 509, 283
Hayward, T. L., Houck, J. R., & Miles, J. W. 1994, ApJ, 433, 157
Hoffmann, W. F., Hora, J. L., Fazio, G. G., Deutsch, L. K., & Dayal, A. 1998, Proc. SPIE, 3354, 647
Kleinmann, D. E., & Low, F. J. 1967, ApJ, 186, L7
Laques, P., & Vidal, J. L. 1979, A&A, 73, 97
Lonsdale, C. J., Becklin, E. E., Lee, T. J., & Stewart, J. M. 1982, AJ, 87, 1819
McCaughrean, M. J. 1988, PhD thesis, University of Edinburgh
McCaughrean, M. J., & Gezari, D. Y. 1991, in Astrophysics with Infrared Arrays, ed. R. Elston, ASP Conf. Ser., 14, 301
McCaughrean, M. J., & Stauffer, J. R. 1994, AJ, 108, 1382
McMullin, J. P, Mundy, L. G., & Blake, G. A. 1993, ApJ, 405, 599
Morino, J.-I., Yamashita, T., Hasegawa, T., & Nakano, T. 1998, Nature, 393, 340
O’Dell, C. R., & Wen, Z. 1994, ApJ, 436, 194
O’Dell, C. R., Wen, Z., & Hu, X. 1993, AJ, 410, 696
O’Dell, C. R., & Wong, S. K. 1996, AJ, 111, 846
Rodríguez-Franco, A. Martín-Pintado, J., & Wilson, T. L. 1999a, A&A, 344, L57
Rodríguez-Franco, A. Martín-Pintado, J., & Wilson, T. L. 1999b, A&A, 351, 1103
Schmid-Burgk, J., Güsten, R., Mauersberger, R., Schulz, A., & Wilson, T. L. 1990, ApJ, 362, L25
Wynn-Williams, C. G., Genzel, R., Becklin, E. E., & Downes, D. 1984, ApJ, 281, 172
Ziurys, L. M., Wilson, T. L. & Mauersberger, R. 1990, ApJ, 356, L25