The Onset of Cluster Formation around Intermediate Mass Stars
Abstract
We present the results of a recent near-infrared survey of the fields surrounding a large sample of intermediate-mass pre-main-sequence (Herbig Ae/Be) stars. While late-type Be and Ae stars are never associated with conspicuous groups of young lower mass stars, early-type Be stars are usually found within rich clusters. This finding has been tested against possible biases due to different mass sensitivity of the observations or dynamical dissipation of the clusters around older stars. Our results suggest that massive stars are preferentially produced in dense stellar clusters, possibly by dynamical interaction rather than by standard gas accretion as in the case of lower mass stars. The possibility that the observed correlation between maximum stellar mass and cluster richness could be the results of random sampling the cluster size spectrum and the stellar IMF is also discussed. Future observational tests capable of discriminating between these two competitive models are outlined.
Osservatorio Astrofisico di Arcetri, Largo E. Fermi 5, Firenze, Italy
1. Introduction
It is now well established by means of direct and indirect observations that most, if not all, stars are formed in groups rather than in isolation (Clarke, Bonnell & Hillenbrand 2000; Carpenter 2000). An important result that strongly constrains theories of massive stars and stellar clusters formation is that the stellar density of young stellar clusters seems to depend on the most massive star in the cluster. Low-mass stars are usually found to form in loose groups with typical densities of a few stars per cubic parsec (Gomez et al. 1993), while high-mass stars are found in dense clusters of up to 104 stars per cubic parsec (see e.g. Hillenbrand & Hartmann 1998). The transition between these two modes of formation should occur in the intermediate-mass regime, namely 215.
Here, we present the results of an extensive near infrared (NIR) survey for young clusters around intermediate-mass stars aimed at the detection and characterization of their clustering properties (Testi et al. 1997; 1998; 1999). We were primarily motivated by the expectation that at NIR wavelengths, particularly in the K-band (2.2 m), the reduced extinction would allow the detection of embedded young stars in the vicinity of the intermediate-mass stars.
The selected sample consists of 44 intermediate-mass pre-main sequence stars (Herbig Ae/Be stars) taken from the catalogues of Finkenzeller & Mundt (1984) and Thé et al. (1994). The primary selection criterion was to cover as uniformly as possible the O9–A7 spectral type range. As an additional constraint, we required the sources to be observable from the northern hemisphere. There appear to be no particular biases in our sample selection, except for the fact that Ae stars tend to be closer to the Sun than Be stars (Testi et al. 1998). Herbig Ae/Be stars themselves are optically visible stars with relatively low extinction (typically A-10 mags), and the molecular material of the parental cloud cores has been already dissipated in many cases (Fuente et al. 1998). Thus, we expect that the star formation event that produced the Herbig star, and the possible accompaining population of lower mass stars, should be terminated in most of the regions in our sample.
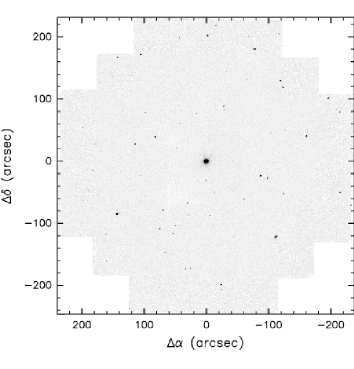
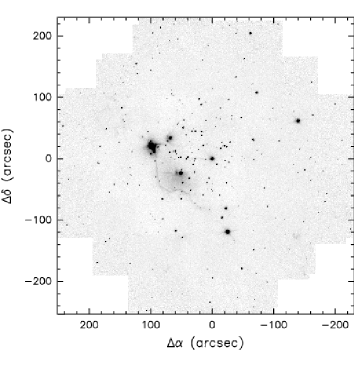


The fields surrounding the target stars were observed with the Arcetri NIR camera (ARNICA) mounted either at the TIRGO or at the NOT telescopes. The relatively large field of view and sensitivity of ARNICA allowed us to obtain wide and deep K-band images of the regions around the target stars. In Figure 1 we show two fields surrounding IP Per (spectral type A3e) and BD65∘1637 (B2e). Given the distance and expected ages of these two targets, our completeness absolute magnitudes at K-band correnspond to a minimum detectable stellar mass of less than 0.1 M⊙. The method used to convert observational magnitudes into stellar masses via pre-main sequence evolutionary tracks is described in Testi et al. (1998), together with the adopted calibrations.
2. Survey Results
Testi et al. (1997) discussed several different quantitative richness indicators to study the clustering properties of the young stellar populations around Herbig Ae/Be stars. The most effective method to detect clusters removing the field stars contamination was found to be the study of the K-band radial stellar surface density profiles centered on the Herbig stars. As an example, in Figure 1 we show the profiles for the fields surrounding IP Per and BD65∘1637. When a central density enhancement is present, the radius at which the density profile merges with the field stars surface density provides an estimate of the cluster radius. The integral, IC, of the surface density profile, subtracted of the field stars surface density determined at the edge of the images, gives an estimate of the number of “effective” stars in the cluster.
In Figure 2 we show the distribution of the observed radii for the clusters detected in the sample of Testi et al. (1998). The distribution clearly shows a peak for 0.2 pc. This result is in good agreement with the typical radii of young stellar clusters (Hillenbrand 1995; Carpenter et al. 1997). We note that this is the same size scale as the dense cores in molecular clouds, which are the likely progenitors of stellar systems and clusters.

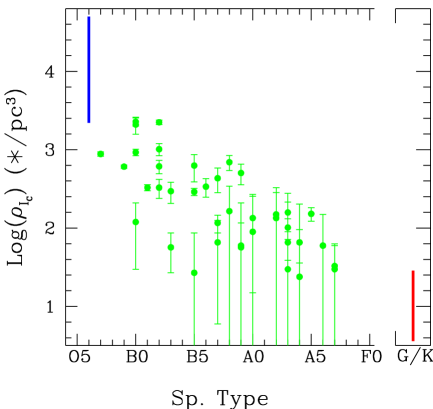
The plot of IC as a function of the spectral type of the target Herbig Ae/Be star (Figure 3) clearly shows the tendency for earlier type stars to be surrounded by rich stellar groups. The same trend is evident when a correction for the different mass sensitivities in the various fileds is applied (Figure 3 right panels, see Testi et al. 1999 for details). The lack of correlation between cluster richness and ages of the Herbig Ae/Be systems, together with the results of N-body simulations suggest that different clustering properties of the stellar populations around early-type Herbig Be stars (usually younger than 1 Myr) and late-type Ae stars (usually older than 1 Myr) cannot be due to dynamical evolution but it is an imprint of the stellar formation mode.

3. Discussion
In the previous section, we established that the observed correlation between the spectral type of the Herbig Ae/Be stars and the membership number of the stellar groups around them is not a result of observational or target sample biases. The source of this correlation is thus to be searched in the star formation process that produced the stars and the associated clusters. In particular, the results of our survey can be tested against the predictions of two competitive classes of high-mass star formation models: i) the so-called physical models, that imply a physical relationship between stellar clusters and massive stars, such as the coalescence models (Bonnell et al. 1998; Stahler et al. 2000); and ii) the random sampling model, in which stellar clusters are randomly assembled by picking stars from the IMF: thus, massive stars are preferentially found in large stellar ensembles because they are much less numerous than low-mass stars (Elmegreen 1999; 2000; Bonnell & Clarke 1999).
3.1. Physical models
The physical models imply that the mechanism of massive stars formation is linked to the formation of a stellar clusters, or, in the extreme view, the presence of a stellar cluster is a prerequisite for the formation of a massive star, such as in the coalescence models (Bonnell et al. 1998; Stahler et al. 2000). These latter models require a very high stellar density in order for (proto-)stellar merging to be efficient.
Given that all the detected clusters have approximately the same physical size (see Figure 2), using the typical radius of 0.2 pc, the number of effective stars can be converted into average stellar densities for spherical clusters. The result of this calculation (Figure 4) shows that while late-type Herbig stars are never surrounded by dense stellar groups, the clusters around early Be stars reach densities in excess of 103 stars per cubic parsec. The comparison with the typical densities of low mass stellar aggregates in Taurus-Auriga (Gomez et al. 1993) and that of the Orion Nebula Cluster (Hillenbrand & Hartmann 1998) shows that the stellar groups detected around Herbig Ae/Be stars nicely fill the gap between the two stellar density regimes.
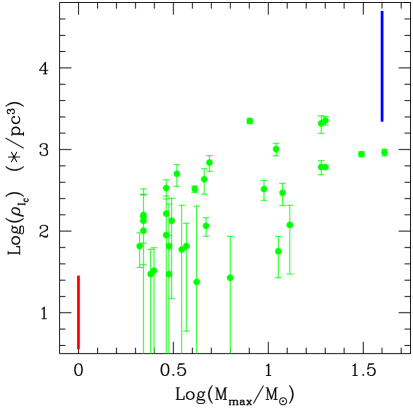
In Figure 4 (right panel) we also show the average densities plotted against the mass of the most massive star in the cluster, i.e. the target Herbig Ae/Be star. The masses of the stars have been computed from the data compiled by Testi et al. (1998) using the pre-main-sequence evolutionary tracks of Palla & Stahler (1999) for stars up to 6 M⊙, and the zero-age main-sequence mass-luminosity relation of Tout et al. (1996) for the most massive objects. The plot clearly shows that only the most massive objects are associated with cluster densities stars per cubic parsec.
This result appears to support the idea that interactions within a dense cluster may play a role in the formation of the most massive stars, even though one should be aware that the stellar densities that we derive are never as high as those advocated by the Bonnell et al. (1998) models.
3.2. The random sampling model
Bonnell & Clarke (1999) have shown that the observational data are also consistent with the statistics of clusters with a defined membership size distribution randomly assembled picking stars from the field stars initial mass function. In this view the formation of massive stars is not related to the formation (or the presence) of a dense stellar cluster, but all stars are randomly selected as in Elmegreen (1999; 2000) models. The probability of finding a cluster with N stars around a target star of a given mass, which by definition will be the most massive star of the stellar ensemble, is a function of both the stellar IMF and the clusters membership size distribution g(N). The latter is an unknown quantity since, at present, it is not observationally constrained nor predicted by star formation theories.
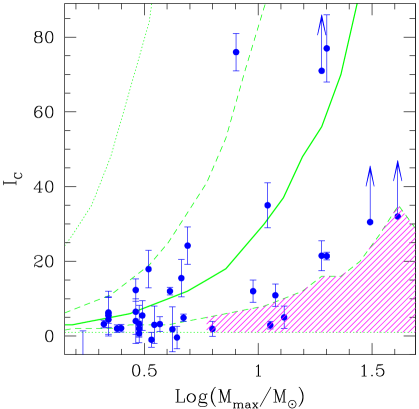
Under the assumption that the probability of finding a cluster with membership size between N and N+dN () is proportional to N-α, with 1.52.0, the random model predictions are compatible with the observed trend and scatter of the IC vs. maximum stellar mass as observed for the Herbig Ae/Be stars in the Testi et al. (1999) sample (Bonnell & Clarke 1999). In Figure 5 we show the prediction of the random model against the Herbig Ae/Be sample results: the plotted model assumes the stellar IMF of Scalo (1998), =1.7, and the observations to be complete down to 0.2 M⊙. In the Figure the solid line shows the median of the random realizations, the dashed lines show the first and third quartiles, while dotted lines include all the realizations for each target maximum mass. At the low Mmax end, the model always predicts small clusters, while high-mass targets are predicted to be found as the most massive stars of both small and large clusters. This is due to the steep power law distribution of the cluster sizes: even though among low-N clusters those with a high-mass star as the most massive star are a minority, these are very abundant with respect to the high-N clusters which have the same high-mass star as the most probable Mmax star. The probability distribution of finding a cluster of given N around a selected mass target show an increase of both the width and median values as a function of the target mass.
It is interesting to note that the power law distribution of the cluster membership sizes consistent with the observational data is very close to the power law distribution of the mass spectrum of gaseous clumps in molecular clouds (e.g. Blitz & Williams 1999). However, we believe that this correspondence is furtuitous and does not underscore any physical relationship between the quantites. First, only a minor fraction of the observed clumps within a molecular complex do form stars, the majority of them being gravitationally unbound. Second, only some of the most massive clumps are bound, but there is no indication that their mass distribution follows a power law with the expected index. Obviously, it would be extremely interesting to verify empirically the cluster membership distribution on a statistically significant sample.
3.3. How to discriminate between models
The relationship between cluster stellar density and the mass of the most massive star seems to favour the physical models, while the increase in the scatter of the cluster richness for high-mass stars and the presence of a few of these stars not surrounded by a conspicuous stellar group appears to support the random model. However, none of these two arguments is entirely convincing: average stellar densities have been derived assuming spherical clusters of radius pc, an approximation that may not be valid in all cases; on the other hand, the fact that few high-mass stars are not surrounded by a rich cluster can be explainded either in terms of observational problems (e.g. diffuse emission, localised extinction, etc.) or by dynamical dissipation of the cluster wich is much more efficient for clusters containing massive stars (see the discussion in Testi et al. 1999).
The best way to distinguish which of the two models is more appropriate requires a direct comparison with a sample of high-mass target stars larger than that presently available. While the random model predicts a relatively large fraction of massive stars in low-N clusters, the physical models posits that all massive stars are found within clusters, at birth time. More quantitatively, the random model described in the previous section predicts that 25% of the targets with mass exceeding 6 M⊙ should be located in the hatched area of Figure 5, this prediction can be tested by extending the survey of Testi et al. (1998) to all of the early-type Herbig Be stars catalogued in Thé et al. (1994). We are currently engaged in the completion of such a survey. An additional test will be the search for stellar groups around the ”field” O-stars of Gies (1987). These nearby O-stars are located away from known OB associations and do not appear to have large proper motions that would classify them as runaway stars. If these stars are really born in isolation that would be against the physical models. As for the Herbig stars, they are relatively young, and, being optically visible, the search for low-mass fainter companion is eased by the reduced extinction.

An alternative approach will be to search for clusters around younger, embedded high-mass sources. This method has the advantage of eliminating the effects of dynamical evolution of the clusters, which is very difficult to quantify properly (see Testi et al. 1999 and Bonnell & Clarke 1999). A number of NIR surveys of high-mass candidate Class 0 and Class I sources are being completed, and will be confronted with the predictions of the physical and random models. The main problems in placing these objects on the diagram of Fig. 5 are: i) the lack of a good estimate of the maximum stellar mass, which is usually estimated from the total far infrared luminosity that must be corrected for the contribution of low-mass stars; ii) the fact that the star formation process is not yet completed in these regions: thus, the clusters (if present) are expected to be deeply embedded and not yet fully populated. In any case, both effects tend to overpopulate the region of the diagram at high Mmax and low cluster richness. In Figure 6 we show the preliminary results of two of these surveys (Massi et al. 2000; Molinari et al. 2000) together with the Herbig Ae/Be sample. Although these surveys do not include objects with M M⊙ (or L5104 L⊙), these initial results indicate that the random model predicts a higher proportion of low membership clusters. However, a more firm conclusion has to wait for the completion of these surveys, especially at the high-mass end.
4. Conclusions
The results of a survey for young embedded clusters around a sample of 44 Herbig Ae/Be stars show a clear dependence of the cluster richness on the mass of the Herbig Ae/Be stars, the most massive object of the group. Stars of progressively higher mass appear to be surrounded by richer and denser clusters. These findings are in qualitative agreement with models that suggest a causal relationship between the birth of a massive star and the presence of rich stellar clusters (the physical model). The observed correlation and scatter, however, could also be explained in terms of random assembling from a standard IMF picked from a membership size distribution of the form g(N)N-α, with 1.52.0 (the random model). We have outline several ways of discriminating between these two competitive models. For the moment, the jury is still out.
References
Blitz, L., & Williams, J.P. 1999, in The Origin of Stars and Planetary Systems, C.J. Lada anf N.D. Kylafis eds., NATO-ASI C-540, p. 3
Bonnell, I.A., Bate, M.R., & Zinnecker, H. 1998, MNRAS, 298, 93
Bonnell, I.A., & Clarke, C. 1999, MNRAS, 309, 461
Carpenter, J.M. 2000, ApJ, in press
Carpenter, J.M., Meyer M.R., Dougados C., Strom S.E., Hillenbrand L.A. 1997, AJ, 114, 198
Clarke, C.J., Bonnell, I.A., & Hillenbrand, L.A. 2000, in Protostars and Planets IV, V. Mannings, A.P. Boss & S.S. Russell eds., (Tucson: University of Arizona Press), p. 151
Elmegreen, B.G. 1999, ApJ, 515, 323
Elmegreen, B.G. 2000, this volume
Finkenzeller, U. & Mundt, R. 1984, A&AS, 55, 109
Fuente, A. Martín-Pintado, J., Bachiller, R., Neri, R., Palla, F. 1998, A&A, 334, 253
Gies, D.R. 1987, ApJS, 64, 545
Gomez, M., Hartmann, L., Kenyon, S.J., Hewett, R. 1993, AJ, 105, 1927
Hillenbrand, L.A. 1995, PhD Thesis, University of Massachusetts
Hillenbrand, L.A. 1997, AJ 113, 1733
Hillenbrand, L.A. & Hartmann, L.W. 1998, ApJ, 492, 540
Massi, F., Lorenzetti, D., Giannini, T., Vitali, F. 2000, A&A, 353, 598
Molinari et al. 2000, in preparation
Palla, F. & Stahler, S.W. 1999, ApJ, 525, 772
Stahler, S.W., Palla, F., & Ho, P.T.P. 2000, in Protostars and Planets IV, V. Mannings, A.P. Boss & S.S. Russell eds., (Tucson: University of Arizona Press), p 327
Testi, L., Palla, F., Prusti, T., Natta, A., Maltagliati, S. 1997, A&A, 320, 159
Testi, L., Palla, F., & Natta, A. 1998, A&AS, 133, 81
Testi, L., Palla, F., & Natta, A. 1999, A&A, 342, 515
Tout, C.A., Pols, O.R., Eggleton, P.P., Han, Z. 1996, MNRAS, 281, 257
Thé, P.S., de Winter, D. & Pérez, M.R. 1994, A&AS, 104, 315