A broadband X-ray study of the supernova remnant 3C 397
Abstract
We present a broadband imaging and spectral study of the radio bright supernova remnant (SNR) 3C 397 with ROSAT, ASCA, & RXTE. A bright X-ray spot seen in the HRI image hints at the presence of a pulsar-powered component, and gives this SNR a composite X-ray morphology. Combined ROSAT & ASCA imaging show that the remnant is highly asymmetric, with its X-ray emission peaking at the western lobe. The hard band images obtained with the ASCA Gas Imaging Spectrometer show that much of the hard X-ray emission arises from the western lobe, associated with the SNR shell; with little hard X-ray emission associated with the central hot spot.
The spectrum of 3C 397 is heavily absorbed, and dominated by thermal emission with emission lines evident from Mg, Si, S, Ar and Fe. Single-component models fail to describe the X-ray spectrum, and at least two components are required: a soft component characterized by a low temperature and a large ionization time-scale, and a hard component required to account for the Fe-K emission line and characterized by a much lower ionization time-scale. We use a set of non-equilibrium ionization (NEI) models (Borkowski et al. in preparation), and find that the fitted parameters are robust. The temperatures from the soft and hard components are 0.2 keV and 1.6 keV respectively. The corresponding ionization time-scales ( being the pre-shock hydrogen density) are 6 1012 cm-3 s and 6 1010 cm-3 s, respectively. The large of the soft component suggests it is approaching ionization equilibrium; thus it can be fit equally well with a collisional equilibrium ionization model.
The spectrum obtained with the Proportional Counter Array (PCA) of RXTE is contaminated by emission from the Galactic ridge, with only 15% of the count rate originating from 3C 397 in the 5–15 keV range. The PCA spectrum allowed us to confirm the thermal nature of the hard X-ray emission. A third component originating from a pulsar-driven component is possible, but the contamination of the source signal by the Galactic ridge did not allow us to determine its parameters, or find pulsations from any hidden pulsar.
We discuss the X-ray spectrum in the light of two scenarios: a young ejecta-dominated remnant of a core-collapse SN, and a middle-aged SNR expanding in a dense ISM. In the first scenario, the hot component arises from the SNR shell, and the soft component from an ejecta-dominated component. 3C 397 would be a young SNR (a few thousand years old), but intermediate in dynamical age between the young historical shells (like Tycho or Kepler), and those that are well into the Sedov phase of evolution (like Vela). In the second scenario, the soft component represents the blast wave propagating in a dense medium, and the hard component is associated with hot gas encountering a fast shock, or arising from thermal conduction. In this latter scenario, the SNR would be twice as old, and transitioning into the radiative phase. The current picture we present in this paper is marginally consistent with this second scenario, but it can not be excluded. A spatially resolved spectroscopic study is needed to resolve the soft and hard components and differentiate between the two scenarios. Future CHANDRA & XMM data will also address the nature of the mysterious central (radio-quiet) X-ray spot.
Subject headings:
ISM: individual (3C 397) – stars: neutron – supernova remnants – X-rays : ISM1. Introduction
In the standard scenario of a core collapse explosion of a massive star, the bulk of the stellar envelope is ejected outward at a high velocity, shocking the surrounding medium, and forming a shell of diffuse emission, which is ultimately observed as a supernova remnant (SNR) shell. The central core collapses to form a neutron star, which may be subsequently observed as a pulsar. SNRs are classified according to their morphology as shells, plerions, or composites. While the shells have a shell-like structure, and represent the majority of SNRs (e.g. the Cygnus loop), the plerions show a centrally bright morphology in radio and X-rays (like the Crab), with no evidence of emission from a shell. The composites have both a shell plus a centrally bright component. The X-ray emission from the shell is in most cases thermal, and results from the shocked swept-up interstellar medium (ISM), with a probable contribution from reverse–shocked ejecta in young remnants. The central X-ray emission in the plerionic composites is non-thermal, and results from synchrotron radiation from highly relativistic particles injected by the pulsar. As the pulsar wind encounters the surroundings, it gets shocked and forms the synchrotron nebula, seen as a plerion.
In the thermal composites, the central emission is thermal, and arises mostly from thermal emission from the swept up ISM. Rho & Petre (1998) refer to this class as ‘mixed morphology’ SNRs, to distinguish them from the plerionic composites.
3C 397 (G41.1-0.3) is one of the brightest Galactic radio SNRs, and its classification remains ambiguous. In the radio, it is classified as a shell-type SNR, based on its steep spectral index = 0.48 and shell-like morphology. At 1 GHz, it has a flux density of 22 Jy (Green 1998), ranking the 5th brightest among 100 remnants. The distance to G41.1-0.3 has been estimated as greater than 6.4 kpc on the basis of neutral hydrogen absorption measurements (Caswell et al. 1975). No absorption is seen at negative velocities, locating the remnant closer than 12.8 kpc. An HII region lying 7′ west of the SNR is likely a foreground object, and was located between 3.6 kpc and 9.3 kpc (Cerosimo & Magnani 1990). At a distance of 10 kpc, the linear size of the radio shell would be 7 13 pc2. High-resolution radio imaging of G41.1-0.3 (Becker, Markert, & Donahue 1985; Anderson & Rudnick 1993) indicates that the remnant brightens towards the Galactic plane, and is highly asymmetric. It has the appearance of a shell edge-brightened in parts, and lacks the symmetry seen in the young historical SNRs, such as Cas A and Tycho. 3C 397 is slightly polarized with an overall polarized fraction of only 1.5%. Kassim (1989) derives an integrated spectral index = 0.4, with a turnover at a frequency less than 100 MHz. The discrepancy between the spectral indices derived by Kassim and Green is most likely due to uncertainties in measuring the total flux density of 3C 397 at centimeter wavelengths, and is attributed to confusion with the nearby HII region and the Galactic background. Anderson & Rudnick (1993) investigate the variations of the spectral index across the remnant, and find variations of the order of 0.2 ( 0.5–0.7). The variations do not coincide with variations in the total intensity. They suggest that interactions between the expanding SNR and inhomogeneities in the surrounding medium play a major role in determining the spatial variations of the index across the remnant. Dyer & Reynolds (hereafter DR 99), while finding a similar magnitude of spectral index variations, did not confirm Anderson & Rudnick’s detailed spatial results, suggesting that the variations are due to image reconstruction problems or other difficulties.
3C 397 has no optical counterpart, and is not observed in the UV probably because it lies in the Galactic plane. An IRAS survey of Galactic SNRs (Saken, Fesen & Shull 1992) did not yield a positive identification of the SNR in the far infrared.
In X-rays, 3C 397 was first detected with the EINSTEIN Imaging Proportional Counter (IPC) and High-Resolution Imager (HRI), showing two central regions of enhancement (Becker et al. 1985), neither of which correlates with any bright radio feature. The IPC data imply for a thermal model an electron temperature 0.25 keV and NH 5 1022 cm-2, implying an optical extinction, 22.5 (Gorenstein 1975). The quality of the data was however poor, and clearly other models were not ruled out.
ROSAT observations of 3C 397 with the PSPC (Rho 1995, Rho & Petre 1998, DR 99) reveal 25 45 diffuse emission, with central emission and an enhancement along the western edge. Spectrally, thermal models are favored over non-thermal models, which yield a very steep power law index (Rho 1995). The spectrum is generally described by a thermal plama with 1.7 keV. However the fit is poor, probably due to a combination of abundance effects, nonequilibrium ionization, and the unrealistic assumption of a single temperature. 3C 397 has similar characteristics to the ‘mixed-morphology’ SNRs, in that it has a centrally bright X-ray morphology characterized by a thermal X-ray spectrum; however, the quality of the ROSAT data and the narrow bandpass of ROSAT does not allow for an accurate determination of its X-ray emission mechanism. This left its classification as a ‘mixed-morphology’ candidate highly uncertain (Rho & Petre 1998).
Combined ROSAT HRI and high resolution radio images of 3C 397 (DR 99) reveal a more complicated morphology. The SNR appears brightest along the western edge of the shell, in both the radio and X-ray images. Moreover, a bright spot was found with the ROSAT HRI, at the center of the SNR shell, but not correlated with any radio enhancement (Figure 12 in DR 99). No pulsations are found to be associated with the X-ray hot spot.
In this paper, we present a broadband X-ray study of 3C 397 with the ROSAT, ASCA and RXTE satellites. While ROSAT has the highest spatial resolution, ASCA has the advantage over ROSAT in its broad bandpass and higher spectral resolution, which allowed us to detect strong emission lines typical of those seen in the spectra of young SNRs. RXTE complements the other observations with its higher energy coverage which allow us to to search for a hard non-thermal component. A preliminary analysis of the ASCA GIS data was performed by Keohane (1998) and Reynolds & Keohane (1999), in order to obtain an upper limit on a possible nonthermal component resulting from the extension of the radio spectrum including an exponential cutoff in the electron distribution. The authors found that the radio spectrum had to begin rolling off around Hz in order to avoid exceeding the continuum around 1 keV. Though they did not perform extensive self-consistent spectral fitting, they found that a very hard component was also necessary to explain the continuum beyond a few keV.
The time resolution of RXTE ( 1 s) allowed us to search for pulsations down to the millisecond range. The analysis of the data was however complicated by the contamination of the source spectrum with the emission from the Galactic ridge. The RXTE data have allowed us to: 1) confirm the presence of the hard component required to fit the ASCA data and better constrain its parameters; 2) find evidence of a third weak component, whose parameters were poorly determined due to the contamination by Galactic ridge; and 3) set an upper limit on the flux from a possibly hidden compact source.
The paper is organized as follows: Section 2 summarizes the observations. In Sections 3 & 4, we present the spatial and spectral results with ASCA and ROSAT. In Section 5, we present the RXTE results. In Section 6, we summarize the results from the timing analysis. We discuss the implications of our results in Section 7. Finally, we summarize our conclusions.
2. Observations
2.1. ASCA
3C 397 was observed using ASCA (Tanaka, Inoue, & Holt 1994) on 1995 July 4. We extracted the data from the HEASARC public database, and present the observations acquired with the Gas Imaging Spectrometer (GIS), and the Solid State Imaging Spectrometer (SIS). The ASCA detectors are sensitive to X-rays in the 0.4–10 keV range, with a spectral resolution at 6 keV of 2% for the SIS and 8% for the GIS (). The point spread function of the GIS alone is a Gaussian with a full width at half max (FWHM) of 30′′ (at 6 keV, ). The intrinsic spatial broadening of the SIS detectors is negligible compared to that of the X-ray telescope (XRT). Therefore the spatial resolution of the detectors is limited by the point spread function of the X-ray telescope, which has a relatively sharp core (FWHM of 50′′ ), but broad wings (50% encircled radius of 15).
The data were screened using the standard process. The pointing is at = 19h 07m 4320, = 07° 13′ 59 (J2000). The observations were performed using the standard time resolution: 0.5s for medium bit rate, and 62.5 millisecond for the high-bit rate. The SIS data were acquired in 1-CCD mode, and read out every 4s. For the timing analysis, we use the GIS high-bit rate data. For the spectral analysis, we use both the SIS and GIS data in high-bit rate mode. We note that Chen et al. (1999) have reported the analysis of the same ASCA SIS data. In their paper, the authors use a blank sky field for background subtraction. In our paper, we subtract the background from the same field. This method is more appropriate since 3C 397 lies in the Galactic ridge, and removing any contamination from the ridge is necessary before drawing any conclusion on the source spectrum. Furthermore, in addition to the SIS, we analyze the GIS data which are more appropriate than the SIS for studying the hard component.
2.1.1 ROSAT
In order to better understand the origin of the X-ray emission, we compare the ASCA images with the high-spatial resolution images obtained with ROSAT, sensitive in the 0.1–2.0 keV energy range. 3C 397 was observed with the High-Resolution Imager (HRI) on several occasions in 1994, and with the Position Sensitive Proportional Counter (PSPC) on 1992 October 28 for 4 ksec. The ROSAT data have been analysed and presented elsewhere (Rho 1995, DR 99). To generate the ROSAT images, we extracted the data from the HEASARC public database. For the HRI, we used the longest exposure (52.3 ksec), performed on 1994 October 14. The ROSAT pointing is at = 19h 07m 3360, = +07° 08′ 24″ (J2000).
2.2. RXTE
3C 397 was observed on six occasions between 1997 December 3, and 1997 December 8 for an effective exposure of 58.4 ks. The 1° FWHM field of view (FOV) of RXTE is pointed at = 19h 07m 3499, = 07° 07′ 149 (J2000). The Proportional Counter Array (PCA), consists of 5 collimated Xenon Proportional Counter detectors with a total area of 6,500 cm2, an effective energy range of 2–60 keV, and an energy resolution of 18% at 6 keV (Jahoda et al. 1996). The HEXTE (Gruber et al. 1996) instrument consists of two clusters of collimated NaI/CsI phoswich detectors with an effective area of 800 cm2 and an effective energy range of 15–250 keV.
In this paper, we report the observations with the PCA. The HEXTE count rates are background dominated, and were not included. For the spectral analysis, we use the data in the standard-2 mode, which provide spectral information. For the timing analysis, we use the Good Xenon modes which provide the highest time resolution (1 s).
3. Spatial analysis
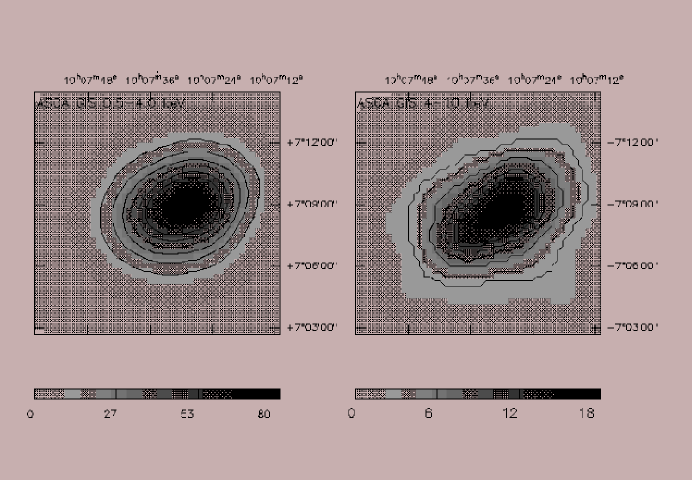
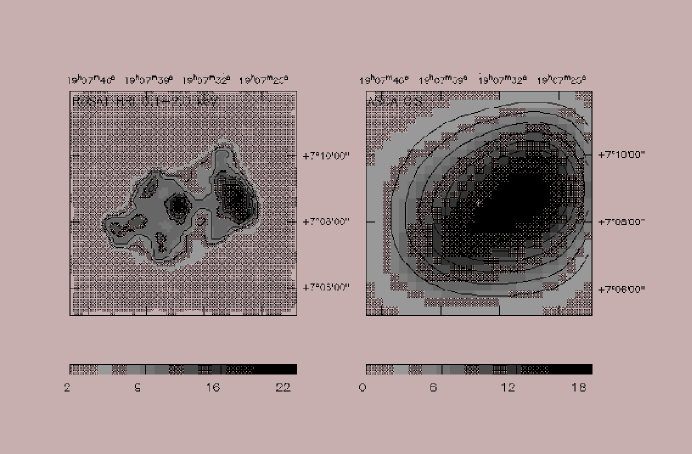
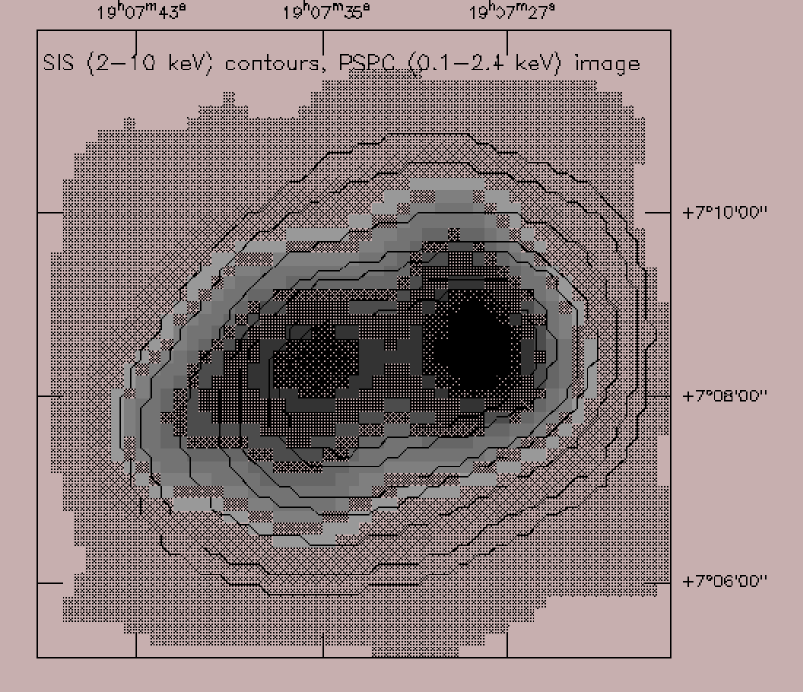
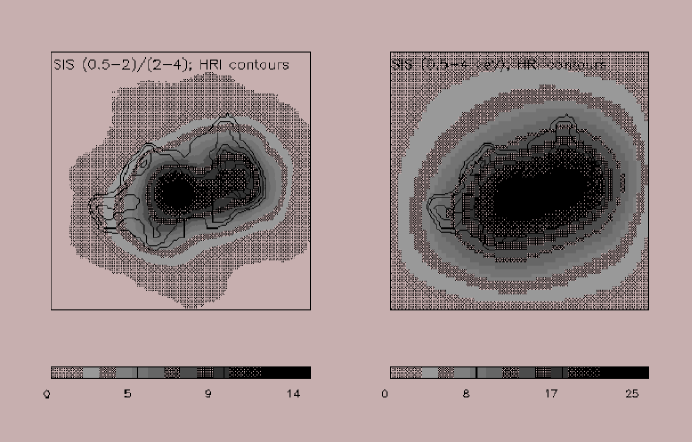
The ASCA pointing is 5′ offset from the central “hot spot” detected with the ROSAT HRI. We generate images of 3C 397 corrected for exposure and vignetting. We use the routine, , which calculates the net exposure time per sky pixel (http://heasarc.gsfc.nasa.gov/docs/asca/abc/). The total time seen by each sky pixel on the detector is computed using an instrument map (generated with ) and the reconstructed aspect. The output exposure map is subsequently used to normalize the sky image. In Figure 1, we show the generated images in the soft (0.5–4.0 keV) and hard (4–10 keV) energy bands of the GIS. The effective exposure is 50.7 ksec (both GIS detectors), and the images are smoothed with a Gaussian with = 45′′ . At the harder energies, the emission shows an elongation nearly perpendicular to the Galactic plane. In Figure 2, we compare the ROSAT HRI image (left panel) and the hard band GIS image (right panel). The brightest features in the ROSAT image, seen at 1′–2′ east and west of the central hot spot, correlate with enhancements in the radio shell (DR 99). It is clear that these small scale features seen with the HRI cannot be resolved by the GIS. However, the overall morphology of the GIS image shows an elongation along the axis joining the hot spot with the bright radio edges. The hard emission peaks at the western lobe, and is not centrally peaked at the HRI hot spot (denoted by a cross), as would be expected from a plerionic composite. In Figure 3, we overlay contours from the SIS hard band on the ROSAT PSPC image. The SIS contours are correlated with the PSPC intensity map, and again suggest that the hard emission peaks at the western lobe, with some fainter emission associated with the central spot and the eastern lobe. While the GIS is more sensitive than the SIS to the hard X-ray band ( 4 keV), the SIS has a higher efficiency at the softer energies. We subsequently examine the softness ratio, defined as , with the SIS. In Figure 4, we show the resulting image (left panel), with the total soft band (0.5–4 keV) image obtained with the SIS (right panel). The HRI contours are overlayed on both images, to show that there is an enhancement of soft emission from the central region.
4. Spectral analysis: ASCA
To study the X-ray spectrum, we have extracted events from a circular region of radius 7′ from the GIS field, encompassing the entire SNR. For the SIS which has a smaller FOV than the GIS, 3C 397 fills a large fraction of the chip, and extends to the edges of the CCD along the direction perpendicular to the Galactic plane. We have extracted the source events from a circular region of radius 4.2′ to avoid the CCD chip boundaries. Since 3C 397 lies 0.3∘ below the Galactic plane, and only 41° in longitude from the Galactic center, the source spectrum is expected to be contaminated by emission from the Galactic ridge. The large FOV of the GIS allowed us to extract a background spectrum from the same field. For the SIS, it was also possible to extract a background (of radius 1′) from the same chip, since 3C 397 does not fill the FOV along the direction parallel to the Galactic pane. This method of background subtraction has the advantage of providing the most accurate model of any spatial or temporal contamination which would affect the spectral analysis. While the extracted SIS spectrum contains most of the emission from the SNR, it is possible that we are missing part of the source flux. This was taken into account by introducing a relative normalization between the SIS and the GIS spectra. Throughout the paper, we perform the flux estimates from the different components of the SNR using the GIS. The background subtracted count rates in the 0.6–9 keV energy range are 0.524 0.005 counts s-1 and 0.613 0.005 counts s-1 from GIS2 and GIS3 respectively. The corresponding SIS0 and SIS1 count rates are 0.768 0.007 counts s-1 and 0.580 0.007 counts s-1 respectively.
In the following, we present our spectral results for both the SIS and GIS data. We fit the SIS data in the 0.6–9 keV range, and the GIS over the 0.8–9 keV band. We disregard energies above 9 keV due to the poor signal-to-noise ratio. We combine the SIS and GIS data to show a joint fit, to which we subsequently add the RXTE PCA data.
4.1. Single-component models
The SIS and GIS spectra are clearly dominated by emission lines, with strong emission from Mg, Si, S, and Ar; the most prominent feature is the Fe-K line. We have first attempted to fit the spectra with Raymond-Smith (RS, Raymond & Smith 1977) and MEKAL (Mewe, Gronenschild, & van den Oord 1985; Liedahl et al. 1990) models, which are appropriate for modeling plasma in collisional equilibrium ionization. A single-component collisional equilibrium ionization model with solar abundances does not yield an acceptable fit (reduced chi-squared = 6.7, = 735, being the number of degrees of freedom).
We subsequently used Sedov models (Hamilton, Sarazin, & Chevalier 1983, hereafter HSC 1983, Borkowski et al., in preparation) which follow the time-dependent ionization of the plasma in a supernova remnant evolving according to Sedov self-similar dynamics. These models are especially important for describing the emission from SNRs whose age is smaller than the time required to reach ionization equilibrium. They are a subclass of non-equilibrium ionization (NEI) models, and include the range of temperatures found in a Sedov remnant. They can therefore account for the hotter X-ray emission expected to originate from the inner parts of such SNRs. The modifications introduced by Borkowski et al. (in preparation) include improved atomic data (in particular, Fe L-shell line data are based on theoretical calculations by Liedahl, Osterheld, & Goldstein 1995) and the possibility of describing plasmas without electron-ion equipartition, including an incomplete heating of electrons at a blast wave. The models are characterized by three parameters: the shock temperature , the post-shock electron temperature (), and = , which characterizes the rate at which the plasma relaxes to ionization equilibrium ( is the hydrogen number density in the unshocked ambient medium, and is the explosion energy). An equivalent parameter to is the ionization time-scale = 1.24 1011 (cm-3 s), where is in units of 1051 erg cm-6, and is the shock temperature in units of 107 K. We find that the Sedov model provides a better fit, but only accounts for the X-ray emission up to about 4 keV. Even a Sedov fit with non-equipartition ( ; where and represent the electron and ion temperatures respectively) does not provide a satisfactory fit to the hard component. In Figure 5, we show the single-component Sedov fit, characterized by an interstellar absorption = 2.75 1022 cm-3, a temperature = 0.15 keV, and an ionization parameter of = 1.86 1012 s cm-3 ( = 2.89, = 734).
Varying the metal abundances within the MEKAL or the Sedov models improves the fits. However, the models still do not account for the hard X-ray emission (above 4 keV), and the fits are unacceptable ( 2.6).
4.2. Two-component models
While the single-component models account for the X-ray emission at energies below about 4 keV, they fail to fit the higher energy component (Figure 5). This result was also found by Chen et al. (1999). We note that even though the Sedov model does include higher-temperature gas from the remnant interior, this model does not account for the hard component. In particular, the most prominent emission line near 6.55 keV is not accounted for, indicating that the Fe-K line region cannot be explained by the same component responsible for the Fe-L emission, and must be characterized by different ionization parameter values. This result was also found in the young ejecta-dominated SNRs such as Tycho (Hwang, Hughes, & Petre 1998), Cas A (Borkowski et al. 1996) and Kepler (Tsunemi, Kinugasa, & Ohno 1996).
In order to characterize the hard component, we first fit the data in the 4-9 keV range with a thermal bremsstrahlung (TB) model plus a Gaussian to account for the Fe-K emission line. The centroid of the Fe-K line is at = 6.55 keV (6.51–6.60, 3), and the TB temperature is = 2.5 keV (1.6–4.2, 3). For a collisional equilibrium ionization model, such as Raymond-Smith, the centroid of the strongest Fe-K lines should be 6.7 keV (He-like) and 6.95 keV (H-like). The low fitted centroid energy indicates that the hard component has not reached ionization equilibrium (Borkowski & Szymkowiak 1997), and should be characterized by a NEI model.
We use a number of NEI models (Borkowski et al., in preparation), which are now released in XSPEC 11:
-
•
PSHOCK , which comprises a superposition of components of different ionization ages appropriate for a plane-parallel shock. This model is characterized by the constant electron temperature, , and the shock ionization age, (where is the pre-shock density, and is the age of the shock; the post-shock density is constant).
-
•
NEI , a constant-temperature, single-ionization time-scale NEI model.
-
•
SEDOV , a NEI model based on the Sedov dynamics, which includes a range of temperatures, as described above.
A proper definition of ionization time-scale is the product of postshock electron density and age , because the plasma ionization state depends on . This is the parameter which enters any NEI model, including the models just mentioned. But the quantity of most interest here is , which is equal to for cosmic abundance plasma and the strong shock Rankine-Hugoniot jump conditions; here includes only Hydrogen. For convenience, we refer to both and as the ionization time-scale throughout this work.
In the 4–9 keV energy range, ASCA data are fitted equally well with NEI and PSHOCK models with the solar Fe abundance. With the PSHOCK model, we obtain = 2.45 (1.8–4.2) keV, = 3.1 (1.5–8.3) 1010 cm-3 s, and = 1.0 (=145). As expected, the electron temperature in the PSHOCK model is equal to the TB temperature, and the plasma is underionized.
We then fit the entire energy range (0.6–9 keV) with various two-component models, using current NEI models mentioned above, and we show the results in Table 1. In fitting the data, we added a Gaussian near 3.1 keV to account for the emission line from Argon, since current NEI models do not include emission from this element. Since the soft component is characterized by a relatively long ionization time-scale ( 1012 cm-3, previous section), we can represent it using a MEKAL model. We also represented the soft component with the SEDOV model, but because these fits are significantly worse (with a reduced ) we do not include them in Table 1. The harder component is characterized by a lower ionization time-scale, and it is necessary to fit it with a NEI model. From Table 1, we find that independently of the NEI model used, the fitted temperatures, ionization time-scales, and emission measures () are in reasonable agreement. The best fit two-component NEI model, PSHOCK +PSHOCK , yields = 3.21 1022 cm-2, = 0.19 keV, = 1.52 keV, =5.6 1012 cm-3 s, and = 6.0 1010 cm-3 s; where and refer to the low-temperature and high-temperature components respectively. The fit yields a reduced of 1.37 (for 729 degrees of freedom). In Figure 6, we show the ASCA data fitted with the corresponding model.
We note that when fitting the hard component with a model (with the soft component fitted with MEKAL or PSHOCK ), we use both equipartition (=) and non-equipartition () models. We find that the non-equipartition model improves the fit, and the corresponding parameters are: =1.73 keV, =0.86 keV, =9.61010 (cm-3 s). In Figure 7, we show the confidence levels for the electron temperature, , versus the shock temperature, . For shock speeds and ionization timescales derived for the hot component, Coulomb heating is effective, and the mean electron temperature in the shocked gas is much larger than the postshock electron temperature , and equal to about 1.5 keV.
The hot component temperature in all two-component fits is lower than the temperature of 2.45 keV derived from fitting the hard (4–9 keV) component independently (using PSHOCK with solar abundances). In addition, two-component models always produce too few counts at high energies. We believe that this is caused by presence of multi-temperature plasma in 3C 397, with temperatures in the range 0.17 keV – 2.5 keV, a likely possibility in view of the complex morphology of 3C 397. Because two-component fits are apparently too simple to describe ASCA spectra, we attempted to fit a three-component model. This has not resulted in a better fit, presumably because the description of multi-temperature plasma in terms of just 3 components might still be grossly inadequate, while giving us too many parameters to be reliably determined from the spatially-integrated X-ray spectrum alone. More complex multi-component models might give a better fit, but the problem with a large number of parameters remains, so that we did not pursue multi-component fitting beyond a 3-component model.
4.3. Abundances
Varying the metal abundances improves the spectral fitting, indicating that at least part of the X-ray spectrum may be associated with an ejecta component. Using the MEKAL +PSHOCK model, we froze the abundances of the hard component at their solar values, and varied the abundances of the elements producing strong lines in the soft component. We find that the absolute value of the abundances of the individual elements are highly uncertain, while their relative values are nearly the same. Therefore, we indicate their ratio relative to Si, relative to solar (given by Anders and Grevesse 1989). Using the VMEKAL model (MEKAL with variable abundances) for the soft component, we allow for the abundances of O, Ne, Mg, Si, S, Fe and Ni to vary, with Fe and Ni tied together. We find that the fit improves by a = 324, and yields =4.0 (3.0–5.8), =5.8 (2.6–9.7), =1.3 (0.9–1.9), =22 (17–28), =1.7 (0–4.3) (2, =1.16, =728). The apparent high S abundance might be an artifact of the models used, because the S line is in the energy range where X-ray spectra from the low- and high-temperature components overlap.
We also investigated the abundances of the hard component, by fitting the soft component with a MEKAL model (with solar abundances), and using VPSHOCK for the hard component (PSHOCK with variable abundances). We fix H, He, C, N, and O to solar; we tie Ni to Fe; and allow for Mg, Si, S, and Fe to vary. We find that the fit improves by = 280, and yields = 1.39 keV, Mg=2.5, Si=0, S=1.33, Fe=Ni=1.49. While varying the abundances in this way does improve the fit, the inference of strong Mg and Fe, but no Si, suggests that other possibilities for explaining the less-than-ideal fit, such as the presence of multi-temperature plasma, should be examined. We already know that the hard component temperature is lower in the two-component fits than from fits to high energy ( keV) data alone. An underestimate of the temperature of the hard component would underestimate the continuum, which would in turn artificially boost the abundances from this component.
We also tied the abundances of the soft and hard component and allowed them to vary. We used VMEKAL and VPSHOCK to represent the soft and hard component respectively. We fix H, He, C, and N to solar; we tie Ni to Fe; and allow for O, Ne, Mg, Si, S, and Fe to vary. The fit yields a = 1.16 (=728) with the following abundance ratios: = 3.2 (2.6–4.1), = 2.3 (0.05–3.1), = 1.2 (0.8–1.4), = 2.9 (2.5–3.3), = 1.8 (1.4–2.3); the ranges are at the 90% confidence level.
In view of a possible presence of a low-temperature ejecta component in 3C 397, one might inquire about the type of the supernova (SN) progenitor, by examining in more detail the abundances determined from fitting the X-ray spectrum. Numerical models for the nucleosynthetic yield as a function of the progenitor’s mass have been calculated by Tsujimoto et al. (1995) and many others. The models predict approximately solar abundances of O and Ne with respect to Si for core-collapse SNe. For type Ia explosions, the calculations of Nomoto et al. (1984) indicate negligible O, Ne, and Mg abundances (with respect to Si), and a large Fe to Si ratio. The high interstellar absorption towards 3C 397 did not allow a direct detection of the O and Ne lines in the 0.7–1 keV range. However, since these elements also provide recombination continuum emission, a large O (and Ne) to Si ratio was shown to improve the fit to the soft component. Since the O, Ne, and Fe abundances are a good indicator for the type of the SN explosion, we have tested for their ratio relative to Si (relative to solar) by:
-
•
Allowing O, Ne, Mg, and Si to vary independently, using the VPSHOCK model. The value decreases from 1,053 to 1,003 (=729) and yields the following ratios: = 2.8, = 2.8, = 2.2.
-
•
Setting O to zero, a value consistent with a type Ia yield, keeping the Fe abundance frozen to solar. The fit does not improve (=1,078, =729), and yields = 1, = 2.
-
•
Setting O to zero and allowing Fe to vary. The fit requires no Fe (1.3, 2), with = 1.5, = 1.1; and a =1008 (=728).
-
•
Forcing a large Fe (Fe 100) as expected from a type Ia yield, and allowing O, Ne, Mg, and Si to vary. The fit gives a = 1058 (=72= 9), and necessitates very large O, Ne, and Mg abundances relative to Si.
-
•
Finally, allowing O, Ne, Mg, Si, S, and Fe to vary, and tying Mg, Si, and S, we find = 1.95, = 1.67, and = 0 (0.6, 2); = 1025, =728.
We conclude that the abundance ratios with respect to Si are certainly inconsistent with a type Ia yield, but they are consistent with an explosion of a massive progenitor. A large S/Si ratio, 4.4, obtained by varying the S abundance, is inconsistent with both SN types. We already mentioned that the large S abundance might be an artifact of the models used. Although the inferred overabundances of heavy elements are substantial (larger than in the well-known SNR Cas A), the evidence for enrichment of heavy elements is of circumstantial nature, and a more definite conclusion about the SN progenitor will probably require the kind of spatially resolved spectral data that the new generation of X-ray telescopes will provide.
5. RXTE results
5.1. Background
The RXTE PCA instrumental background consists of internal background as well as the background due to cosmic ray flux and charged particle events. We use the latest background model developed for the analysis of faint sources with the PCA. This model (L7/240) accounts for activation in the PCA (http://lheawww.gsfc.nasa.gov/stark/pca/pcabackest.html). In Table 2, we list the background-subtracted count rates in the 2.5–20 keV range for the various observation intervals. We use the XTE/PCA internal background estimator script in order to estimate the PCA background. We disregard energies below 5 keV, in order to avoid the instrumental Xenon-L edge seen in the 4.5–5 keV range. To avoid uncertainties in the background subtraction at the higher energies and to maximize the signal-to-noise ratio, we analyze the PCA data up to 15 keV only.
In addition to the instrumental background, we have to account for the emission from the Galactic ridge. Following Valinia & Marshall (1998, hereafter VM 98), we approximate the ridge emission with a two-component model consisting of a power law with a photon index, , plus a Raymond-Smith thermal plasma with a temperature, kTGR. We allow these parameters to vary within the range determined by VM 98. In order to determine the normalization, we examine the scans of the Galactic ridge for a latitude of -0.25°, and within longitudes 30° and 50° (after removing the bright sources). We also examine the background region selected from the ASCA GIS field of view, and fit its spectrum combined with the RXTE spectrum using the two-component model described above. The corresponding flux is subsequently used in modeling the overall spectrum of 3C 397. We find that only 15% of the total PCA count rate originates from 3C 397 in the 5–15 keV range. The flux is dominated by the emission from the ridge, since RXTE has a large FOV and lacks the spatial resolution needed to resolve the emission from 3C 397.
5.2. 3C 397
In fitting 3C 397, we freeze the power law index and the RS temperature of the Galactic ridge, and allow its normalization to span the 3 range determined with the method described above. The spectral fitting with the PCA is insensitive to the soft component (which dominates up to 2 keV), therefore we represent it by the MEKAL model. For the hard component, we use the PSHOCK model and find that its parameters are consistent with the ASCA fit. We find that a broad Gaussian line is needed to account for the Fe-line feature seen in the PCA spectrum. It is possible that this line is associated with the background in the field of 3C 397. The lack of spatial resolution, and the uncertainties in the ridge model, leave its origin uncertain. The PSHOCK model describing 3C 397 hard component yields = 1.50 (1.46–1.54, 3) keV, and = 7.1 (5.3–9.6)1010 (cm-3 s). The corresponding observed flux from 3C 397 (5–15 keV) = 3.22 10-12 erg cm-2 s-1; which corresponds to a luminosity (5–15 keV) = 4.0 1034 erg s-1. The fit yields a =1.68 (=769). In Table 3, we summarize the results of this fit, and in Figure 8 we show the corresponding fit to the combined SIS, GIS, & RXTE spectra, using the MEKAL +PSHOCK model in the 0.6–15 keV band, and allowing the relative normalization to be a free parameter.
We have further tested for the parameters of the hard component, independently of the soft component, by fitting the ASCA hard band only (4–9 keV) and the PCA spectrum (5–15 keV band), using a PSHOCK model. A broad Gaussian line was again needed to account for the Fe-line seen in the PCA spectrum. The PSHOCK model describing the hard emission from 3C 397 yields = 2.3 (2.1–3.1) keV, and = 3.1 (1.5–6.3) 1010 (cm-3 s), with a =1.08 (=170). These parameters are consistent with the fit to the ASCA hard (4–9 keV) band described previously, and better constrained.
5.3. Non-thermal emission?
The emission from 3C 397 is more complicated than can be simply described by a two-component thermal model, partly because the emission from the central region appears at both energy bands. This might be an indication of the presence of an additional unresolved component, possibly non-thermal, hinting at the presence of a plerion. In addition, the GIS image in the hard energy band (4–9 keV) shows that the overall morphology of the remnant follows the radio and X-ray enhancements seen in the radio and HRI image (see Figure 2), indicating that part of the flux could be non-thermal and associated with highly energetic electrons accelerated at the SN shock.
While the Fe-K emission line at 6.55 keV indicates that the hard component is dominated by thermal X-ray emission, a non-thermal component might be hidden underneath. To determine an upper limit on this component, we fit the hard band (4–9 keV) with a power law model, plus a Gaussian line to account for Fe. The fit yields a photon index, = 3.4 (2.5–4.5, 3) and a reduced =1.0 (=143).
We also fitted the entire 0.6–9 keV range of the ASCA data with a two-component model: MEKAL to account for the soft component, and a power law or a synchrotron model, SRCUT , to represent the hard component. A Gaussian line was also added near 6.55 keV to account for Fe-K emission. The synchrotron model, SRCUT , is more appropriate for describing synchrotron X-ray emission from SNRs than a power law. It models the particle spectrum cutting off exponentially, and is parameterized by the radio spectral index and flux density, and a characteristic roll-off frequency, (Reynolds 1998; Reynolds and Keohane 1999). This gives the sharpest plausible roll-off in a synchrotron spectrum, while the power-law model has no roll-off at all. A true synchrotron description should lie between these extremes. In Table 4, we summarize the parameters of these fits. The MEKAL + POWER law and MEKAL +SRCUT models yield poorer fits than the MEKAL +PSHOCK model ( = 1.75–1.95), as they do not account for the line emission from Sulfur or Iron.
We subsequently added the PCA spectrum to test for non-thermal emission in the 5–15 keV band. Fitting the ASCA and the PCA data in the 0.6-15 keV with a MEKAL + POWER law model, plus Gaussian lines to account for the emission from Argon and Fe-K, yields a power law index =4.23 (4.15–4.31, 3), and a reduced chi-squared =1.79 (=763). This model is again worse than the MEKAL +PSHOCK model (with solar abundances), implying that the data favor the thermal model.
Adding a power law component to the MEKAL +PSHOCK model (shown in Table 3) improves the fit (an F-test yields a probability of 5 10-4). The MEKAL +PSHOCK +POWER law model yields =1.44 keV and =8.61010 (cm-3 s) for the hard component. The power law component is characterized by a photon index 1.5, and a flux, (5–15 keV) 1.2 10-12 erg cm-2 s. However, the complexity of the model used and the high contamination by the Galactic ridge leave its parameters highly uncertain. We note that fits to the ASCA hard band (4-9 keV) plus the PCA spectrum (5–15 keV) with a PSHOCK model (as described in the previous section) do not require an additional power law, as the derived shock temperature =2.3 (2.1–3.1) keV is higher than the temperature derived above (=1.44 keV). In summary, the RXTE data favor a thermal model for the hard component, and do not allow us to constrain the parameters of an additional power law component, due to the complexity of the model used, the large number of fitted parameters, and the uncertainties in modeling the background.
6. Timing results
To search for pulsations in the ASCA data, we extract the source events using the GIS detectors in the high-bit rate mode, with the standard time resolution of 62.5 milliseconds. We perform power spectral density (PSD) analysis on the barycenter corrected photon arrival times and search for pulsations in the 0.01–8 Hz frequency range. The upper frequency is dictated by the time resolution of the data. No pulsations were found at a significant level ( 3).
We computed PSD analyses at two energy bands: soft (0.5–2.4 keV) and hard (2.5–10 keV). We bin the data into 0.5 s bins, and perform a long FFT on the background-subtracted, binned light curves. This allowed us to search for pulsations up to 1 Hz. For the higher frequency range (up to 8 Hz), we use the 62.5 millisecond time resolution and performed average FFT’s with 512 s length each.
We find some interesting peaks, but no detection was found with a high confidence level. We subsequently fold the data at the peaks determined from the PSD’s using a Z test. At the soft energies, no pulsations were found at a level 3, and the pulsed fraction is 7% in the 0.01–8 Hz range. At the higher energies (2.5–10 keV) range, no pulsations were found with a confidence level 1, and the pulsed fraction was 12%.
We use the RXTE data to search for higher frequency pulsations. The PCA data observed with Good Xenon modes provide a s time resolution. We select the events in the 5–20 keV energy range and from the top layer in order to maximize the signal to noise ratio. We apply the barycentric correction, and compute average FFT’s to search for any coherent pulsations up to 128 Hz. No pulsations were found. The upper limit on the pulsed fraction is 15% in the 5–20 keV range (where we have estimated that 10% of the source count rate originates from a plerion).
7. Discussion
7.1. The diffuse emission
In the following, we discuss the origin of the diffuse X-ray emission in the light of the interaction between the SNR material and the surroundings. In the standard picture of the X-ray emission from young SNRs, the soft component arises from shocked ejecta and the hard component is usually attributed to the blast wave. For this remnant, we find that high metal abundances improve the spectral fitting, suggesting that at least part of its X-ray spectrum may be associated with the ejecta. While the absolute values of the abundances are model dependent, we find that the hard component (4–9 keV) could be fitted with a NEI model (PSHOCK ) with solar abundances, and does not require large metal abundances. It is therefore reasonable to assume that the hard component is associated with the blast wave, and the soft component with the ejecta, most likely of a core-collapse SN as derived from the observed abundance pattern. It is also possible that the hard component is not due to material shocked by the blast wave, but results from the shock entering very low-density regions, and that we should interpret the soft component as a Sedov blast wave. We discuss both these possibilities below.
7.1.1 Young, Ejecta-Dominated Remnant of a Core-Collapse SN
If 3C 397 is an ejecta-dominated SNR and the hard component associated with the blast wave, then we may estimate the parameters of the SN explosion using the Sedov model (Table 1). We use a distance of 10 kpc to 3C 397, and estimate the physical parameters in units of . From the equation in HSC 83 below Equation (10), we can convert the measured emission measure () into an upstream density . From the ROSAT HRI image (DR 99), the mean angular radius is about , implying pc. From Table 1 (PSHOCK + SEDOV non-equipartition fit, last row), we determine cm-3; then from HSC 83: This implies a swept-up mass of 29 (assuming a mean mass per particle of 1.4), consistent with a massive progenitor and an evolutionary stage between ejecta-dominated and Sedov. The parameters of the SN derived using the Sedov non-equipartition fit to the hard component are summarized in Table 5.
The Sedov spectral fit actually overdetermines the SNR parameters, since from the observed shock temperature and ionization time-scale alone we can find the remnant age and upstream density. Equations (4a – 4f) in HSC 83, with our measured values of K and cm-3 s, give km s-1, erg, yr, and cm-3.
This value of is, within the various uncertainties, consistent with that determined from the measured . The swept-up mass from is 40 ; in either case, we find a large mass, indicating massive progenitor, since if the ejected mass were only 1.4 , the remnant should show little or no evidence of ejecta by this time. In general, the morphology of the remnant, its location in the Galactic plane, and the suggestion that the soft component dominating the X-ray spectrum is due to ejecta, favor a core-collapse explosion.
We note that using the fit to the hard component only (4-9 keV), the PSHOCK model yields a higher temperature =2.45 keV (1.8–4.2 keV), and a slightly lower ionization time-scale == 3.1 (1.5–8.3) 1010 cm-3 s. The observed emission measure of =0.0224 corresponds to cm-3. If the emission volume , with the filling factor, we find an upstream density cm-3 implying a shock age yr. For a reasonable filling factor of 0.25, these estimates are quite comparable to those from the Sedov fits above and strengthen our confidence in them.
We have thus accounted satisfactorily for the gross remnant properties using only the high-temperature component of the X-ray emission. What, then, of the low-temperature component (Table 1) with an emission measure larger by about 600. If that component represents shocked ejecta, its mass cannot greatly exceed that of shocked ISM. The only way the emission measure can be greatly increased is if that material is very highly concentrated in small regions, since for a given total mass , with the ejecta filling factor. Our fits then suggest that the ejected material, which is unlikely to comprise more than half the swept-up mass of order 30 , is concentrated in very small regions. The ROSAT HRI image (Figure 12, DR 99), sensitive to the energy range from 0.4 to 2 keV, should illustrate the spatial location of the soft component material. That material appears to be distributed more or less like the radio emission, largely concentrated near the edges (especially the western edge), with a small, bright region in the interior. However, if that material is concentrated into knots, the image might resemble what is observed. A good example of such clumpy ejecta is provided by optically-emitting O-rich knots in Cas A, which are the most dense, undecelerated ejecta fragments plowing through the ambient circumstellar medium. Because of their high velocities, pressures in these knots are much higher than in the bulk of the shocked ejecta. We envision a similar situation in 3C 397, where the soft X-rays with a large emission measure are produced by dense, fast-moving ejecta clumps, while emission from the large-scale reverse shock should be harder and much fainter. The ram-pressure compressed clumps of ejecta must be at pressures at least an order of magnitude higher than the pressure of the ambient, much more tenuous X-ray emitting gas, because of the factor of 600 larger for the soft X-ray component (we expect at most a factor of larger for the X-ray emission from a large-scale reverse shock). Future high spatial resolution observations with CHANDRA and XMM should provide enough information to confirm or refute this picture.
7.1.2 A Medium-Aged SNR in a Dense ISM
The soft X-ray component may alternatively be identified with the blast wave. While we obtained poor fits with the SEDOV model, this component is well fit by the MEKAL model with temperature keV (Table 1). If this temperature is identified with the post-shock temperature, we obtain 375 km s-1 for the blast wave velocity. The preshock density may be estimated by noting (for comparable filling factors for the two components) that and that the emission measure ratio between the low- and high-temperature component is equal to . This gives cm -3, or a mean postshock electron density of about 160 cm-3, implying that the SN progenitor exploded in a particularly dense environment. When combined with the remnant’s angular size, we obtain the total swept mass . Assuming that the remnant’s dynamics can be well described by a Sedov dynamics, we estimate the total SN kinetic energy at ergs, parameter ergs cm-6, ionization timescale cm-3 s, and the SNR age . At this stage of its evolution, the remnant may be at the transition from the Sedov stage to the radiative stage, because this transition should occur at yr, an age equal to the estimated SNR age.
The high-temperature component in this picture of a middle-aged SNR must come from the hot interior of 3C 397, occupied by gas shocked by a high velocity shock earlier in the evolution of the remnant. It is likely that this gas completely fills the remnant’s interior, i. e., its volume filling fraction is equal to . With this filling fraction, we deduce that its electron density is approximately equal to 2.5 cm-3. Because ionization timescale of this hot component is equal to cm-3 s (or cm-3 s) in the NEI model (Table 1), the hot gas was shocked about yr ago, certainly a reasonable timescale for a 5000 yr old remnant. The mass of the hot gas is equal to 30 , and its pressure appears to be 6–8 times lower than pressure in the low-temperature component. This is somewhat lower than a ratio of 3 expected in a Sedov model. It is possible that the volume filling fraction of the high-temperature component is 2–3 lower than we assumed, and then its pressure would be higher than derived above. If this is the case, then most of the SNR volume would have to be occupied by a very tenuous hot gas with a negligible emission measure.
The origin of the high-temperature component is not clear in the framework of the middle-aged SNR. Its presence may indicate significant departures from a uniform ambient medium, because Sedov models cannot produce such a strong high-temperature component. Because mass of the hot interior gas is nearly 20 times smaller than the mass of the swept shell, this material was shocked early in the evolution of the remnant, and originated relatively close to the SN progenitor. We expect the SN progenitor to be a massive star, which is likely to be found near the place of its birth and associated with dense ISM. But massive SN progenitors modify the distribution of the ambient medium in its vicinity, blowing stellar winds and creating dense gaseous shells. We then would naturally expect deviations from the Sedov dynamics early in the evolution of the remnant. Perhaps the hot-temperature component is the relic from earlier stages of the SNR evolution, when the blast wave encountered an ambient medium strongly modified by the SN progenitor.
Another possibility is that the overall dynamics of 3C 397 are poorly described by the Sedov solution. We have already concluded that radiative cooling is likely to be important in the 3C 397 shell, which could decrease the shell temperature and enhance soft X-ray emission. The ambient ISM may also be clumpy, a likely possibility in view of a generally inhomogeneous nature of dense ISM, which could also affect the remnant’s dynamics and its X-ray emission. Finally, neglected physical processes such as electron thermal conduction may have caused significant departures from the Sedov solution. For example, Cox et al. (1999) estimate that the central density at the time of transition from the Sedov stage to the radiative stage is approximately 10 times lower than the preshock density in SNR models with thermal conduction. Because the density ratio between the preshock gas and the high-temperature component in 3C 397 is also of this order, we attempted to fit ASCA spectra with the thermal conduction models kindly provided to us by Randall Smith (these models were used by Shelton et al. 1999 to model SNR W44). While the resulting fits have not produced better results that our one-component fit with the SEDOV model, models with thermal conduction are still a viable alternative because the existing set of models was designed for SNRs with much lower preshock densities, such as W44. A more serious problem might be the lack of evidence for elemental enrichment in the hot component, as we would expect a moderate enhancement of Fe in the remnant’s interior. A detailed study of the 3C 397 dynamics, clearly outside the scope of our present work, is required in order to understand the nature of the high-temperature component in the framework of a middle-aged SNR.
7.2. A hard non-thermal tail?
In the following, we discuss the possibility that the hard component is synchrotron emission from highly relativistic particles accelerated at the SNR shock. We show that a power-law description results in reasonable parameter values, while a somewhat better motivated cutoff synchrotron model (Reynolds 1998) describes the data as well, giving results consistent with Reynolds and Keohane (1999) which involved highly simplified spectral fits. For power-law models, the index, , is highly dependent on fitting the soft component, being steep ( 3.4) when the soft component is fitted with a MEKAL or PSHOCK model, and harder for a Sedov fit ( 2). In the following, we estimate the equipartition magnetic field and the non-thermal energies, whose values are not too sensitive to the power law photon index. Using the power law fit parameters to the hard component only (4–9 keV), the photon index is 3.4, and the flux (4–9 keV) is 3.8 10-12 erg cm-2 s-1, corresponding to a luminosity (4–9 keV) of 4.5 1034 erg s-1 (unabsorbed). We use the ASCA hard band only since the PCA spectral fitting is highly dependent on the emission from the Galactic ridge. Assuming equipartition between energy in the relativistic electrons and magnetic fields, we estimate a magnetic field 1.210-5 ( G, where is the fraction of the flux that is synchrotron radiation. The total energy in the electron distribution out to X-ray emitting energies is 0.7 1045 erg; being the magnetic field in units of 10-5 G. This represents a small fraction of the SN explosion energy. The synchrotron lifetime of an electron emitting 9 keV X-rays is 650 years. The typical electron energies producing the synchrotron photons of energy can be estimated to be TeV.
A power-law spectrum is not expected to arise naturally in the high-energy part of the electron spectrum; rather, one expects a slow rolloff from the low-frequency synchrotron power-law. The simplest description of this rolloff is the synchrotron spectrum from an exponentially cut off power-law electron distribution , the “cutoff” synchrotron model (Reynolds 1998), called in XSPEC. In , the fitted roll-off frequency, , is related to the cutoff electron energy, , via the relation: 0.5 1016 Hz. Using the fitted value of = 2.89 1016 Hz, and an equipartition magnetic field of 10G, we estimate a cutoff electron energy of 24 TeV. This value is in agreement with the upper limit derived by Keohane (1998) and Reynolds and Keohane (1999). A synchrotron explanation for the hard component results in reasonable parameters whether it is described by a power law or by the cutoff model; better observations will be needed to see if such a component is demanded by the data.
7.3. A hidden plerion?
The presence of a pulsar-powered component (plerion) is suggested by the HRI image showing the hot spot at the center of the remnant. We subsequently estimate the intrinsic parameters from a hidden pulsar taking the hard component luminosity as an upper limit on a plerionic contribution. We assume a Crab-like plerion, and use the empirical formula derived by Seward & Wang (1988), (erg s-1) = 1.39 -16.6; where represents the X-ray luminosity of the plerion in the 0.2–4 keV band. The power law model for the hard component implies an observed flux (0.2–4 keV) = 6.2 10-12 erg cm-2 s-1; which translates to a luminosity (0.2–4 keV) = 4.7 1036 erg s-1 (after correction for absorption). This implies a spin-down luminosity of 2 1038 erg s-1, and a period of 0.08(s) ( )-1/2; where is the spin-down luminosity in units of 1038 erg s-1, and is the pulsar’s age in units of 103 years. We stress that these parameters are derived assuming that the hard component arises entirely from a plerion. These are extreme limits since the hard band GIS image indicates that the hard X-ray emission peaks at the western lobe, with some emission from the central spot (Figure 2). Assuming that only 10% of the hard component arises from the central hot spot, then the spin-down luminosity would be 41037 erg s-1, and the period 0.12 -1/2 s.
A synchrotron component in the X-ray spectrum of 3C 397 could be also associated with a central engine injecting relativistic particles, which as they encounter a strong shock, would produce the high-energy non-thermal tail (up to 9 keV). Such a process is known to occur in the SNR W50 powered by the jet source SS433 (Safi-Harb & Petre 1999 and references therein). The axial ratio of 2:1 in 3C 397 is similar to that in W50, in which the bloating results from the interaction between the jets in SS433 and the SNR shell.
8. Summary and Conclusions:
We have presented ROSAT, ASCA, and RXTE observations of 3C 397. The ROSAT high-resolution HRI image shows a central hot spot, possibly associated with a compact object whose nature remains a mystery, as no X-ray pulsations nor a radio counterpart have been found. The ASCA and ROSAT images show that the remnant is highly asymmetric, having a double-lobed morphology similar to the radio shell. The hard band image obtained with the ASCA GIS overlayed on the ROSAT HRI image shows that the hard emission peaks at the western lobe, with little hard X-ray emission originating from the central spot.
The spectrum is heavily absorbed, and dominated by thermal emission with emission lines evident from Mg, Si, S, Ar and Fe. Single-component models fail to fit the ASCA spectra (0.6-9 keV). Even a SEDOV model (a NEI model including a range of temperatures) does not account for the emission above 4 keV. Two components, at least, are required to fit the data: a soft component, characterized by a large ionization time-scale, and a hard component, required to account for the Fe-K emission line and characterized by a much lower ionization time-scale. We use a set of NEI models, and find that the fitted parameters are robust. The temperatures from the soft and hard component are 0.2 keV and 1.6 keV respectively. The corresponding ionization time-scales are 6 1012 cm-3 s and 6 1010 cm-3 s respectively. The large of the soft component indicates that it is approaching ionization equilibrium, and it can be fitted equally well with a collisional equilibrium ionization model. The 5–15 keV PCA spectrum, though contaminated by the emission from the Galactic ridge, allowed us to confirm the thermal nature of the hard X-ray emission. Fitting the hard component (5–15 keV band) yields, however, a higher shock temperature ( 2.3 keV) than the one derived from fitting the entire band with two-component models (Table 1). A third component originating from a pulsar-driven component is possible, but the contamination of the source signal by the Galactic ridge did not allow us to determine its parameters, or find pulsations from any hidden pulsar.
We discuss the two-component model in the light of two scenarios: a
young ejecta-dominated remnant of a core-collapse SN, and a medium-aged
SNR in a dense ISM.
In the first scenario, the hot component would
arise from the blast wave and the soft component from the ejecta.
The derived age (a few thousand years) and the presence
of a central X-ray source makes 3C 397 similar to the
young SNRs G11.2–0.3 (Vasisht
et al. 1996), Kes 73 (Gotthelf & Vasisht 1997), and RCW 103 (Petre &
Gotthelf 1998). G11.2–0.3 harbors a hard X-ray plerion powered by a fast
millisecond pulsar (Torii et al. 1997). Kes 73 and RCW 103 harbor
radio-quiet X-ray sources:
an anomalous X-ray pulsar in Kes 73 (Vasisht & Gotthelf 1997), and a
low-mass X-ray binary candidate in RCW 103 (Garmire et al. 2000,
IAU Circ 7350).
If a central neutron star exists in 3C 397, as suggested by the ROSAT HRI image, then it must be radio quiet.
The absence of both a radio
spot and X-ray pulsations could be then attributed to a
cooling neutron star, an anomalous or binary X-ray pulsar,
or a weak X-ray plerion buried underneath the SNR.
ROSAT did not allow an accurate measurement
of its spectrum due to the heavy
interstellar absorption towards 3C 397,
and the narrow energy band of ROSAT.
Future CHANDRA observations will unveil its nature.
We note that recently, CHANDRA observations of CasA SNR
revealed a central radio-quiet X-ray source
(Pavlov et al. 2000),
and that a new 424 ms (radio-quiet) X-ray pulsar
has been discovered with CHANDRA observations of
the SNR PKS 1209-52 (Zavlin et al. 2000).
The hybrid X-ray morphology of 3C 397, with both shell and central emission, combined
with its age, makes it a unique SNR–perhaps a transition object from a
shell (like the historical SNRs) into a composite that is well into the
Sedov phase of evolution (like Vela).
In the second scenario (a middle-aged SNR), the soft component would represent the emission from the SNR expanding in a dense medium. The hard component would arise from the hot interior shocked by a fast shock earlier in the evolution of the remnant. Alternatively, a Sedov model invoking thermal conduction would modify the Sedov dynamics, and produce a hot inner component (as was proposed for the SNR W44; Cox et al. 1999). In this scenario, the SNR would be entering its radiative phase, and would emit in the infrared. A 1ks exposure obtained with the two-micron All-Sky Survey (2MASS) Infrared telescope at IPAC reveals, in the J band, faint diffuse emission in the northern part of the SNR (J. Rho, private communication). The extent of the diffuse emission to the west is, however, confused with bright stars in the field. No emission was detected from 3C 397 in the far infra-red. Furthermore, HI and CO observations should reveal the presence of a radiative shell and its interaction with a dense medium (as found for W44, IC 443, and 3C391: Chevalier 1999). To our knowledge, no evidence of an HI shell or CO emission is found to be associated with 3C 397. The current picture we present here is therefore marginally consistent with this scenario, but it can not be excluded.
Differentiating between the two scenarios requires a spatially resolved spectroscopy as well as more detailed modeling (which is outside the scope of this paper). In particular, high spatial resolution X-ray data combined with broadband energy coverage is required to resolve the central component from the outer shell, and unveil the nature of the mysterious X-ray spot. This could be achieved with CHANDRA and XMM. Furthermore, future gamma-ray observations with high-spatial resolution (such as ) will help look for a high-energy tail and test for models with a radiative shell. Since 3C 397 is heavily absorbed, infra-red observations will be crucial to trace the presence of radiative shocks. In particular, searching for [OI] 63m line emission will be a powerful probe to test for the radiative model. Finally, observations with millimeter telescopes will enable us to get a better estimate of the kinematic distance to 3C 397, and measure the density profile of the medium into which it is propagating. We have observed 3C 397 with the SEST telescope (Chile), and the data are in the process of being analyzed (Durouchoux et al. in preparation).
Acknowledgments
We greatly acknowledge useful
discussions with A. Valinia on the X-ray emission from the Galactic
ridge, and thank her for providing us with the RXTE scans of the
ridge. We particularly thank E. Gotthelf for his help in using the
ftool ; U. Hwang & G. Allen for scientific
discussions. We are grateful to R. Smith for providing us
with his thermal conduction code,
and J. Rho for her input on the 2MASS images,
prior to their publication.
We thank the referee, Don Cox, for his careful reading and
invaluable comments and suggestions.
This research made use of data obtained with the High
Energy Astrophysics Science Archive Research Center (HEASARC) Online
Service and the NASA’s Astrophysics Data System Abstract Service
(ADS), provided by the NASA/Goddard Space Flight Center.
S.S.H. acknowledges support from the National Research Council.
References
- (1) Anders, E., & Grevesse, N. 1989, GeCoA, 53, 197
- (2) Anderson, M. C., & Rudnick, L. 1993, ApJ, 408, 514
- (3) Becker, R. H., Markert, T., & Donahue, M. 1985, ApJ, 296, 461
- (4) Borkowski, K. J. & Szymkowiak, A. E. 1997, ApJ, 477, L49
- (5) Borkowski, K. J., Szymkowiak, A. E., Blondin, J. M., & Sarazin, C. L. 1996, ApJ, 466, 866
- (6) Caswell, J. L., Murray, J. D., Roger, R. S., Cole, D. J., Cooke, D. J. 1975, A&A, 45, 239
- (7) Cerosimo, J. C. & Magnani, L. 1990, A&A, 239, 287
- (8) Chen, Y., Sun, M., Wang, Z-R, & Yin, Q. F. 1999, ApJ. 520, 737
- (9) Cox, D. P., Shelton, R. L., Maciejewski, W., Smith, R. K., Plewa, T., Pawl, A., & Różyczka, M. 1999, ApJ, 524, 179
- (10) Chevalier, R. A. 1999, ApJ, 511, 798
- (11) Dyer, K. K., & Reynolds, S. P. 1999, ApJ, 526, 365
- (12) Gorenstein, P. 1975, ApJ, 198, 95
- (13) Gotthelf, E. V., Petre, R., & Hwang, U. 1997, ApJ, 487, L175
- (14) Green D.A., 1998, ‘A Catalogue of Galactic Supernova Remnants (1998 September version)’, Mullard Radio Astronomy Observatory, Cambridge, United Kingdom (available on the World-Wide-Web at ”http://www.mrao.cam.ac.uk/surveys/snrs/”)
- (15) Gruber, D. E. et al. 1996, A&AS, 120, 641
- (16) Hamilton, A. J. S., Sarazin, C. L., & Chevalier, R. A. 1983, ApJS, 51, 115 (HSC 83)
- (17) Jahoda, K., Swank, J., Giles, A. B., Stark, M. J., Strohmayer, T., Zhang, W. 1996, SPIE, 2808, 59
- (18) Keohane, J.W. 1998, PH.D. thesis, University of Minnesota
- (19) Kassim, N. 1989, ApJS, 71, 799
- (20) Liedahl, D. A., Kahn, S. M., Osterheld, A. L., & Goldstein, W. H. 1990, ApJ, 350, L37
- (21) Liedahl, D. A., Osterheld, A. L., & Goldstein, W. H. 1995, ApJ, 438, L115
- (22) Mewe, R., Gronenschild, E. H. B. M., & van den Oord, G. H. J. 1985, A&AS, 62, 197
- (23) Nomoto, K., Thielemann, F.-K., & Yokoi, K. 1984, ApJ, 286, 644
- (24) Pavlov, G. G., Zavlin, V. E., Aschenbach, B., Trümper, J., & Sanwal, D. 2000, astro-ph/9912024
- (25) Petre, R., & Gotthelf, E.V. 1998, Mem. Soc. Astron. Ital., 69, 837
- (26) Raymond, J. C., & Smith, B. W., 1977 ApJS, 35, 419
- (27) Reynolds, S. P. 1998, ApJ, 493, 375
- (28) Reynolds, S. P. & Keohane, J. W. 1999, ApJ, 525, 368
- (29) Rho., J. 1995, Ph.D. thesis, University of Maryland
- (30) Rho, J., & Petre, R. 1998, ApJ, 503, L167
- (31) Safi-Harb, S., & Petre, R. 1999, ApJ, 512, 784
- (32) Saken, J. M., Fesen, R. A., & Shull, J. M. 1992, ApJS, 81, 715
- (33) Seward, F. D., & Wang, Z.-R. 1988, ApJ, 332, 199
- (34) Shelton, R.L., Cox, D. P., Maciejewski, W., Smith, R. K., Plewa, T., Pawl, A., & Różyczka, M. 1999, ApJ, 524, 192
- (35) Spitzer, L. 1978, New York Wiley-Interscience, 1978, p.333
- (36) Tanaka, Y., Inoue, H., & Holt, S. S. 1994, PASJ, 46, L37
- (37) Torii, K., Tsunemi, H., Dotani, T., Mitsuda, K. 1997, ApJ, 489, L145
- (38) Tsujimoto, T., Nomoto, K., Yoshii, Y. et al. 1995, MNRAS, 277, 945
- (39) Tsunemi, H., Kinugasa, K., Ohno, Y. 1996, in Proceedings ‘Röntgenstrahlung from the Universe’, Eds. Zimmermann, H.U.; Trümper, J.; and Yorke, H.; MPE Report 263, p. 229-232
- (40) Valinia, A., & Marshall, F. 1998, ApJ, 505, 134 (VM 98)
- (41) Vasisht, G. & Gotthelf, E. V. 1997, ApJ, 486, L129
- (42) Vasisht, G., Aoki, T.; Dotani, T.; Kulkarni, S. R.; Nagase, F., 1996 ApJ, 456, L59
- (43) Zavlin, V. E., Pavlov, G. G., Sanwal, D., & Trümper, J. 2000, astro-ph/0005548
- (44)
| Modela | Soft | Hard | () |
|---|---|---|---|
| PSHOCK + PSHOCK | = 0.19 (0.185–0.2) keV | = 1.52 (1.4–1.62) keV | 1.37 (729) |
| b (cm-3 s) | = 5.5 1012 | = 5.9 (4.1–9.8) 1010 | – |
| c | 31.5 (24–42) | 0.053 (0.048–0.057) | – |
| d | 4.81038 | 2.651036 | – |
| MEKAL + NEI | = 0.175 (0.17–0.18) keV | = 1.5 (1.34–1.60) keV | 1.57 (730) |
| (cm-3 s) | – | = 3.9 (3.1–5.5) 1010 | – |
| 43.5 (33–57) | 0.057 (0.050–0.068) | – | |
| 5.51038 | 1.581036 | – | |
| MEKAL + PSHOCK | = 0.175 (0.172–0.18) keV | = 1.5 (1.39–1.61) keV | 1.6 (730) |
| (cm-3 s) | – | = 8.5 (5.7–16) 1010 | – |
| 43.5 (33–56)b | 0.057 (0.048-0.068) | – | |
| 5.51038 | 2.21036 | – | |
| MEKAL + SEDOV ( = ) | = 0.174 (0.17–0.18) keV | = 1.14 (1.0–1.29) keV | 1.66 (730) |
| (cm-3 s) | – | = 1.1 (0.8–2.0) 1011 | – |
| 43.5 (30–56) | 0.063 (0.053–0.083) | – | |
| 5.51038 | 1.211037 | – | |
| MEKAL + SEDOV ( ) | = 0.177 keV | = 1.735 (1.65–1.9) keV | 1.65 (730) |
| = 0.87 (0.8–0.9) keV | – | ||
| (cm-3 s) | – | = 1.17 (0.8–1.85) 1011 | – |
| 39 | 0.065 (0.058–0.068) | – | |
| 4.91038 | 5.91036 | – | |
| PSHOCK + SEDOV ( ) | = 0.187 keV | = 1.73 (1.54–1.91) keV | 1.39 (729) |
| = 0.86 (0.79–0.93) keV | – | ||
| (cm-3 s) | = 11013 | = 9.6 (7.4–11.8) 1010 | – |
| 39 | 0.070 (0.066–0.076) | – | |
| 4.81038 | 9.81036 | – |
a The NEI models used are NEI (constant-temperature single-ionization timescale NEI model),
PSHOCK (plane-parallel NEI shock model), and the SEDOV models (Borkowski et al., in preparation).
The subscripts and refer to the
low-energy and high-energy components respectively.
b Ionization time-scale; is the preshock hydrogen density
c The emission measure in units of
.
d The X-ray luminosity in the 0.5–9 keV range (at a distance of 10 kpc).
| Observation Number | Date | Time (104 s) | PCAL7 ( counts s-1 )a |
|---|---|---|---|
| 01-00 | 1997-12-03 | 1.034 | 12.90 0.07 |
| 01-01 | 1997-12-04 | 1.216 | 13.74 0.06 |
| 01-02 | 1997-12-06 | 0.488 | 14.97 0.10 |
| 01-03 | 1997-12-07 | 1.240 | 13.27 0.06 |
| 01-04 | 1997-12-08 | 0.952 | 12.70 0.07 |
| 01-05 | 1997-12-08 | 0.910 | 12.85 0.07 |
a Background-subtracted count rates in the 5–15 keV range, using the L7/240
background model. The uncertainties reflect the statistical errors
only, and do not include any systematic errors associated with the
background subtraction.
| Model | Soft | Hard |
|---|---|---|
| MEKAL +PSHOCK | = 0.175 | = (1.46-1.54) keV |
| Ionization time-scale | – | = (5.3–9.6) 1010 (cm-3 s) |
| EMa | 43 | 0.058 (0.054–0.061) |
| Galactic ridge | =3.2 keV | =1.7 |
| = 1.31510-2 | = 7.227 10-3 |
a in units of
b Frozen
c in units of ph cm-2 s-1 keV-1 at 1keV
| (MEKAL ) | Non-thermal Model | () |
|---|---|---|
| 0.18 keV | =4.3 | 1.75 (729) |
| 0.21 keV | =2.91016 (Hz) | 1.95 (730) |
a Power-law photon index
b Roll-off frequency using the SRCUT model
| Shock temperature, (keV) | 1.54–1.91 |
|---|---|
| Ionization time-scale, (cm-3 s) | (1.5 – 2.4) 1010 |
| Shock velocity, (km s-1) | 1,140–1,270 |
| Age, (yrs) | 1,800 – 2,800 |
| Ambient density, | 1.29 – 1.38 |
| Explosion energy, (ergs) | 1051 |