The cluster environments of the 3CR radio galaxies
Abstract
An analysis of the environments around a sample of 28 3CR radio galaxies with redshifts is presented, based primarily upon K–band images down to taken using the UK Infrared Telescope (UKIRT). A net overdensity of K–band galaxies is found in the fields of the radio galaxies, with the mean excess counts being comparable to that expected for clusters of Abell Class 0 richness. A sharp peak is found in the angular cross–correlation amplitude centred on the radio galaxies, which, for reasonable assumptions about the luminosity function of the galaxies, corresponds to a spatial cross–correlation amplitude between those determined for low redshift Abell Class 0 and Abell Class 1 clusters.
These data are complimented by J–band images also from UKIRT, and by optical images from the Hubble Space Telescope. The fields of the lower redshift () radio galaxies in the sample generally show well–defined near–infrared colour–magnitude relations with little scatter, indicating a significant number of galaxies at the redshift of the radio galaxy; the relations involving colours shortward of the 4000Å break show considerably greater scatter, suggesting that many of the cluster galaxies have low levels of recent or on–going star formation. At higher redshifts the colour–magnitude sequences are less prominent due to the increased field galaxy contribution at faint magnitudes, but there is a statistical excess of galaxies with the very red infrared colours () expected of old cluster galaxies at these redshifts.
Although these results are appropriate for the mean of all of the radio galaxy fields, there exist large field–to–field variations in the richness of the environments. Many, but certainly not all, powerful radio galaxies lie in (proto–)cluster environments.
keywords:
Galaxies: clustering — Galaxies: active1 Introduction
Clusters of galaxies are the largest, most massive, collapsed structures in the Universe, and as such are of fundamental importance for many cosmological studies. They provide a unique probe of large–scale structure in the early Universe and, as the systems which separated from the Hubble flow at the earliest epochs, they contain the oldest galaxies known. These can strongly constrain the first epoch of the formation of ellipticals, and hence set a lower limit to the age of the Universe; the effectiveness of using such old galaxies at high redshifts towards this goal has been well demonstrated by Dunlop et al. [Dunlop et al. 1996]. Further, because clusters contain large numbers of galaxies at the same distance, they are important testbeds for models of galaxy evolution.
The cores of optically–selected clusters are dominated by a population of luminous early–type red galaxies which occupy a narrow locus in colour–magnitude relations. Stanford, Eisenhardt and Dickinson [Stanford et al. 1998] showed that, out to redshifts , the evolution of the colours of early–type cluster galaxies on these relations is completely consistent with passive evolution of an old stellar population formed at high redshift. The small intrinsic scatter of the galaxy colours, and particularly the fact that it remains small at redshifts [Stanford et al. 1998], implies that the star formation of the ellipticals comprising a cluster must have been well synchronized, and sets tight limits on the amount of recent star formation that might have occurred (e.g. Bower, Kodama and Terlevich 1998).
Cluster ellipticals also show a tight relationship between their effective radius, effective surface brightness, and central velocity dispersion (the ‘fundamental plane’; c.f Dressler et al. 1987, Djorgovski and Davies 1987). The location of these ellipticals within the fundamental plane has been shown to evolve with redshift out to , in a manner which implies that the mass–to–light ratio of the galaxies evolves as , roughly in accordance with passive evolution predictions (e.g. van Dokkum et al 1998 and references therein).
These results are in qualitative agreement with ‘monolithic collapse’ models of galaxy formation, in which an elliptical galaxy forms the majority of its stars in a single short burst of star formation at an early cosmic epoch. On the other hand, the hierarchical galaxy formation models favoured by cold dark matter cosmologies (e.g. White and Frenk 1991) predict a later formation of galaxies with star formation on–going to lower redshifts. These are supported by the appearance of a population of bluer galaxies in many clusters at redshifts (the Butcher–Oemler effect; Butcher and Oemler 1978) and by the high fraction of merging galaxies seen in the cluster MS105403 [van Dokkum et al. 1999]. Since finding clusters at high redshift is strongly biased towards the very richest environments, in which early–type galaxies will have formed at the very highest redshifts, hierarchical models can still explain the apparent passive evolution and small scatter of the colour–magnitude relation out to redshifts .
It is clearly important to extend cluster studies out to still higher redshifts, but the difficulty lies in the detection of clusters. At optical wavelengths, the contrast of a cluster above the background counts is minimal at these redshifts: the deep wide–area ESO Imaging Survey (EIS) has found 12 ‘good’ cluster candidates above redshift 0.8, but none above [Scodeggio et al. 1999]. Addition of near–infrared wavebands helps (e.g. Stanford et al. 1997), but is still a relatively inefficient method. Selection using X–ray techniques is more reliable, but X–ray surveys are currently sensitivity limited: the ROSAT Deep Cluster Survey found about 30 clusters with , but none above redshift 0.9 [Rosati et al. 1998]. Chandra and XMM will make a big improvement here. An alternative approach is to use powerful radio galaxies as probes of distant clusters: these can be easily observed out to the highest redshifts, and there is growing evidence that at high redshifts they lie in rich environments.
At low redshifts powerful double radio sources (FR II’s; Fanaroff & Riley 1974) are associated with giant elliptical galaxies that are typically the dominant members of galaxy groups; the only nearby radio source of comparable radio luminosity to the powerful high redshift radio galaxies is Cygnus A, and this source lies in a rich cluster [Owen et al. 1997]. At a redshift , analysis of the galaxy cross–correlation function around FR II radio galaxies (Yates, Miller and Peacock 1989) and an Abell clustering classification [Hill & Lilly 1991] have shown that about 40% of radio sources are located in clusters of Abell richness class 0 or greater. At , the circumstantial evidence that at least some powerful radio sources are located at the centres of clusters is overwhelming and includes the following:
-
•
Detections of luminous X–ray emission from the fields of the radio galaxies (e.g. Crawford and Fabian 1996), sometimes observed to be extended, indicating the presence of a relatively dense intracluster medium.
-
•
Large over-densities of galaxies in the fields of some distant radio sources, selected by infrared colour [Dickinson 1997].
-
•
Direct detections of companion galaxies with narrow–band imaging (McCarthy, Spinrad and van Breugel 1995) and spectroscopic studies [Dickinson 1997].
-
•
The observation that powerful radio galaxies are as luminous as brightest cluster galaxies at , and have radial light profiles which are well–matched by de Vaucouleurs law with large (10 to 15 kpc) characteristic radii (Best, Longair and Röttgering 1998b).
-
•
The radio sources display large Faraday depolarisation and rotation measures (e.g. Best et al. [Best et al. 1998a]; see also Carilli et al. [Carilli et al. 1997] for redshift radio sources), requiring a dense, ionised surrounding medium.
-
•
Theoretical arguments that to produce such luminous radio sources requires not only a high AGN power, due to a very massive central black hole being fueled at close to the Eddington limit [Rawlings & Saunders 1991], but also a dense environment to confine the radio lobes and convert the jet kinetic energy efficiently into radiation (e.g. see Barthel and Arnoud 1996).
At still higher redshifts, radio sources have been detected out to redshift [van Breugel et al. 1999], and some well–studied sources are known to lie in cluster environments. For example, towards the radio galaxy 1138215 () extended X–ray emission has been detected (Carilli et al. 1998) and narrow–band imaging reveals over 30 nearby Ly- emitters [Kurk et al. 2000]. Radio sources may therefore offer a unique opportunity to study dense environments back to the earliest cosmic epochs. As yet, however, there have been no systematic studies of radio galaxy environments much beyond , and so it is important to investigate in detail the nature of the environments of the general population: do all powerful distant radio galaxies lie in cluster environments, or do only a minority but these have ‘grabbed the headlines’?; what are the properties of any clustering environments (richness, radius, shape, etc.) surrounding these objects?; what is the nature of the constituent galaxies (morphological composition, segregation, etc.) of any detected cluster?
In this paper, deep near–infrared observations of the fields of a sample of 28 powerful radio galaxies with are analysed, in conjunction with Hubble Space Telescope (HST) images of the same fields, to investigate the ubiquity and richness of the environments of the radio galaxies. The observations, data reduction, and source extraction are described in Section 2. In Section 3 the integrated galaxy counts are considered, in Section 4 the angular and spatial cross–correlation amplitudes are derived, and in Section 5 an investigation of the colour–magnitude and colour–colour relations is carried out. The implications of the results are discussed in Section 6. Throughout the paper values for the cosmological parameters of and km s-1Mpc-1 are assumed.
2 Observations and Data Reduction
2.1 The dataset
The data used for this research was presented and described by Best, Longair and Röttgering [Best et al. 1997]. In short, the sample consists of 28 radio galaxies with redshifts drawn from the revised 3CR sample of Laing, Riley and Longair [Laing et al. 1983]. The fields of these radio galaxies were observed at optical wavelengths using the Wide-Field Planetary Camera II (WFPC2) on the HST generally for one orbit in each of two different wavebands. They were also observed at near–infrared wavelengths using IRCAM3 on the UK Infrared Telescope (UKIRT) in the K–band for approximately 54 minutes, and in 20 of the 28 cases also in the J–band.
For 5 sources (3C13, 3C41, 3C49, 3C65, 3C340) a further 3 to 4 hours of K–band observations have subsequently been taken using IRCAM3 in September 1998 (Best et al., in preparation), and these were combined with the original data to provide much deeper images. These further data were taken in the same manner as the original IRCAM3 data except for the use of the tip-tilt system that was available on UKIRT then, but wasn’t available for the original runs; use of this system provided a significant reduction in the effective seeing.
The HST data were reduced according to the standard Space Telescope Science Institute (STScI) calibration pipeline [Lauer 1989], following the description of Best et al. [Best et al. 1997]. The UKIRT data were reduced using IRAF and mosaicked using the dimsum111dimsum is the ‘Deep Infrared Mosaicking Software’ package developed by Eisenhardt, Dickinson, Stanford and Ward. package, again following the general procedure outlined by Best et al. [Best et al. 1997]. During the mosaicking process, the individual galaxy frames were block replicated by a factor of 4 in each dimension to allow more accurate alignment. The final images were then block–averaged in 2 by 2 pixels, resulting in frames with a pixel size of 0.142 arcseconds. The seeing varied from image to image, from about 0.7 to 1.2 arcsec. dimsum also produces an output exposure map indicating the exposure for each pixel on the combined image; this is useful for weighting the different regions of the images, which reach different limiting sensitivities owing to the dithering process used in taking the data (see Best et al. 1997).
This dataset has a number of advantages and disadvantages for use in studies of clustering around distant radio galaxies. On the negative side, since these data were originally taken with the goal of studying the host galaxies of the radio sources, no comparison fields were taken with which the data can be compared to statistically remove background counts. Further, IRCAM3 is only a 256 by 256 array with a field of view per frame of just over 70 by 70 arcseconds. After mosaicking this provided a final image of nearly 100 by 100 arcsec, which corresponds to a little over 800 kpc at a redshift of one for the adopted cosmology, but the highest sensitivity is only obtained in the central 50 by 50 arcsec region. This is a significantly smaller size than a cluster would be expected to have at this redshift, and so only those galaxies in the central regions of any prospective clusters will be investigated (cf. the much larger extent of the structure around the radio galaxy 3C324 at redshift 1.206, as demonstrated in Figure 2 of Dickinson [Dickinson 1997], although just over half of the associated cluster members found there would lie within the IRCAM3 field of view).
Although these two factors limit the usefulness of the dataset, they are far outweighed by the benefits. First, the large size and essentially complete nature of the sample make it ideal for surveying the average environments of these sources. Second, the multi–colour nature of the dataset provides important information on any cluster membership through the creation of colour–magnitude diagrams and the determination of photometric redshifts. Third, the availability of near–infrared data is essential for such studies at these high redshifts since it continues to sample the old stellar populations longwards of the 4000Å break; in the K–waveband the K and evolutionary corrections are small and relatively independent of morphological type, even at redshifts , in contrast to the situation at optical wavelengths. Fourth, the availability of the high resolution HST data allows accurate star–galaxy separation down to the faintest magnitudes studied. For these reasons, this dataset is well–suited to investigating the environments of radio galaxies.
2.2 K–band image detection and photometry
Throughout these analyses, the K–band data were used as the primary dataset. Image detection and photometry on the K–band frames was carried out using sextractor version 2.1 [Bertin & Arnouts 1996]. As a result of the dithering technique used to obtain near–infrared data, the exposure time varies with position across the image meaning that the rms background noise level also varies. sextractor allows the supply of an input weight map by which the local detection threshold is adjusted as a function of position across the image to compensate the varying noise levels, thus avoiding missing objects in the most sensitive regions of the image or detecting large numbers of spurious features in the noisiest regions. The output exposure map of each field produced by dimsum was used as the weight map for sextractor. The source extraction parameters were set such that, to be detected, an object must have a flux in excess of 1.5 times the local background noise level over at least connected pixels, where was varied a little according to the seeing conditions, but in general was about 20 (equivalent to 5 pixels prior to the block replication and averaging during the mosaicking procedure).
To test the validity of this extraction method, a search for negative holes was carried out using the same extraction parameters, and resulted in a total of only 43 negative detections throughout the 28 images, that is, about 1.5 negative detections per frame. The fluxes associated with these negative detections all correspond to positive features below the 50% completeness limit and so it is expected that there are essentially no false positive detections above that limit.
The output from sextractor was examined carefully, with minor (typically 1–2 per field) modifications being made to the catalogue if necessary: objects coinciding with the spikes of bright stars were removed, the data for occasional entries that had been separated into two objects by sextractor but were clearly (on comparison with data at other wavebands) a single object were combined, and very occasionally it was necessary to add to the catalogue an obvious object which had been missed due to its proximity to a brighter object. Further, all objects that lay within 21 pixels (3 arcsec) of the edge of an image were removed from the catalogue in case their magnitudes were corrupted by aperture truncation. sextractor provides a flag parameter to indicate the reliability of its measured magnitudes. After this trimming of objects close to the edges of the fields, less than 2% of all objects had high flag values indicative of truncated apertures, saturated pixels, or corrupted data. These objects were also removed from the catalogue.
sextractor’s mag_best estimator was used to determine the magnitudes of the sources; this yields an estimate for the ‘total’ magnitude using Kron’s [Kron 1980] first–moment algorithm, except if there is a nearby companion which may bias the total magnitude estimate by more than 10% in which case a corrected isophotal magnitude is used instead. The determined magnitudes were also corrected for galactic extinction, using the extinction maps of Burstein and Heiles [Burstein & Heiles 1982].
To investigate the accuracy of these total magnitudes, and the completeness level of the source extraction as a function of position on the image, Monte–Carlo simulations were carried out using the following 4–step process.
Step 1: The point–spread function (PSF) of each K–band image was determined using objects which were unsaturated and which were unresolved on the HST images.
Step 2: A series of model galaxies was made. 30% of the galaxies were assumed to be ellipticals, with radial light profiles governed by de Vaucouleurs’ law, , where and are the distances along the projected major and minor axes, and and are the characteristic scale lengths in those directions. Lambas, Maddox and Loveday [Lambas et al. 1992] provide a parameterization for the ellipticities of elliptical galaxies in the APM Bright Galaxy Survey in terms of the parameter . An ellipticity was drawn from each galaxy at random from this distribution, and the position angle of the major axis was also chosen randomly. Songaila et al. [Songaila et al. 1994] found that for galaxies with the median redshift is about 0.6, which means that for (where detection and completeness are being tested) the majority of the galaxies will be distant enough that their angular sizes are relatively insensitive to redshift. High redshift ellipticals have typical characteristic sizes ranging from 2 to 10 kpc (e.g. Dickinson 1997), and so the apparent characteristic size, (), of each elliptical was chosen randomly from the range 0.2 to 1.2 arcsec.
The remaining 70% of the galaxies were built using a single exponential profile appropriate for galaxy disks, , where is the characteristic scale length of the disk. Mao, Mo and White [Mao et al. 1998] show that the characteristic scale lengths of disks decreases with redshift approximately as , but Simard et al. [Simard et al. 1999] shows that a magnitude–size correlation somewhat counter–balances this: at a given apparent magnitude, higher redshift objects must be intrinsically brighter and so are larger. From their data, the typical scale length of galaxy disks at around our completeness limit will be 1–4 kpc. The disk scale length of each galaxy was therefore chosen at random from the range 0.1 to 0.5 arcsec. The disk inclination was chosen at random from 0 to 90 degrees, with inclinations greater than 75 degrees being replaced by 75 degrees to account for the non–zero thickness of the disk. The projected orientation of the galaxy was also chosen randomly.
The model galaxies were then convolved with the stellar PSF derived in step 1.
Step 3: Five stellar or galactic objects were added to each frame with a random position and scaled to a random magnitude in the range . sextractor was then run on the new image using the same input parameters as for the original source extraction, to see if the added objects were detected, and if so to determine the difference between the total magnitude measured by sextractor and the true total magnitude.
Step 4: Step 3 was repeated until 25000 stellar objects and 25000 model galaxies had been added to each image.
From these results, the mean completeness fraction was determined as a function of magnitude for both stars and galaxies over the entire set of images. The results are shown in Figure 1. The 50% completeness limits are for galaxies and for stars. As discussed in Section 2.1, new deeper observations are available for five fields, and considering these deeper fields alone, the 50% completeness limits are 20.2 and 20.9 for galaxies and stars respectively.

The input and measured magnitudes of each detected object can also be compared. Typical results for an individual field are shown in Figure 2. Note the generally low scatter, particularly at bright magnitudes, but the occasional source with a large deviation. These are caused by the proximity of the model object to a bright source in the field; large errors such as this are avoided in the observed data by careful examination of the output sextractor catalogues, as discussed above. The mean difference between the input and measured magnitudes, and the scatter of the measured magnitudes around this mean, are shown as functions of input magnitude for both model stars and galaxies in Figure 3.


2.3 Multi–colour source extraction
The J–band frames were aligned with the K–band frames by using a number of objects that appeared unresolved on the HST images. This alignment often involved a small shift in position of the frames, but generally much less than a degree of frame rotation. sextractor was then run in its double image mode using the J and K–band images. In double image mode sextractor uses one image to detect objects and define the apertures to be used for flux determination, and then the fluxes and magnitudes are measured from the second image. In this way J–band magnitudes or upper limits were determined for the sources detected in the K–band, through exactly the same apertures.
For the HST data, sextractor was first run on the HST frames obtained at the end of the calibration procedure. Then, the four separate WFPC2 frames were overlaid individually with the K–band data, using between 3 and 15 unresolved objects visible at both wavelengths. In this process the HST data was re-pixelated to match the UKIRT data, essential for a combined running of sextractor on the K–band and HST images; the re-pixelated and aligned HST images were then convolved to the angular resolution of the K–band data using a Gaussian convolving function. sextractor was run in double image mode on the convolved HST data, thus measuring accurate fluxes and magnitudes for the objects through the same apertures as the K–band data. The HST fluxes were corrected for the small differences in gain ratios between the different WFPC2 chips and using a 4% linear correction ramp for the charge transfer efficiency effects [Holtzman et al. 1995]. They were also corrected for galactic extinction using the extinction maps of Burstein and Heiles [Burstein & Heiles 1982]. Finally, for each object the ‘stellaricity index’ (see Section 2.4), used for the separation of stars and galaxies, was replaced by that calculated in the run of sextractor on the original HST frame: using the highest angular resolution data provides a much more accurate determination of this parameter.
For both the J–band and HST frames, only objects which were detected with fluxes of at least 3 were considered, where is the uncertainty on the flux measurement provided by sextractor; this flux error estimate includes the uncertainty due to the Poisson nature of the detected counts and that from the standard deviation of the background counts. An additional source of flux error arises from the uncertainty in the subtraction of the background count level as a function of position across the image. This value was estimated as the product of the area of the extraction aperture and the rms variation of the subtracted background flux across the image. This background subtraction error estimate was combined in quadrature with the flux error given by sextractor to determine the uncertainties on the magnitudes of the extracted objects.
2.4 Star–galaxy separation
sextractor provides a ‘stellaricity index’ for each object, which is an indication of the likelihood of an object being a galaxy or a star, based on a neural network technique [Bertin & Arnouts 1996]. In the ideal cases a galaxy has a stellaricity index of 0.0 and a star has 1.0. In practice, at faint magnitudes, low signal–to–noise and galaxy sizes smaller than the seeing lead to an overlap in the calculated stellaricity indices for the two types of object.
For sources which were present on the HST frames (typically only about 80% of objects, the precise percentage depending upon the sky rotation angle at which the HST frame was taken), the stellaricity index for each object determined from the un-convolved HST data was adopted: the high resolution of these images meant that, apart from the very reddest objects, star–galaxy separation222Of course, star–galaxy separation using the resolved or unresolved nature of sources means that any quasars will be placed into the star category, but their contribution is negligible. was relatively unambiguous right down to the completeness limit of the K–band frames. For the objects for which no HST data was available, stellaricity indices were taken from the K–band data. At magnitudes , star–galaxy separation could be carried out directly from these stellaricity values. At fainter magnitudes it was still possible to provide a fairly accurate segregation of galaxies from stars by combining the stellaricity index with the (or F814W) colour of the object, as shown in Figure 4: the bluer average colour of stars can be used to separate out the stars and galaxies in the ambiguous range of stellaricity indices from about 0.5 to 0.9.
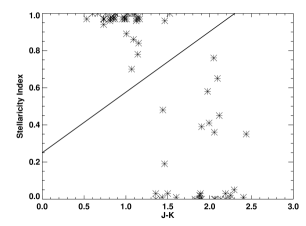
Figure 5 shows the total star counts as a function of magnitude derived from all of the frames, fit with the function . This good fit to the differential star counts using a single power–law distribution clearly demonstrates that the star–galaxy separation is working well.

3 Galaxy Counts
Using the differences between true and measured magnitudes determined for the simulated galaxies in Section 2.2 (and Figure 3), the measured ‘total’ magnitudes of the galaxies were converted to true ‘total’ magnitudes, and these were binned in 0.5 magnitude bins over the magnitude range to determine the raw galaxy counts, . These were corrected for completeness using the observed mean completeness fraction as a function of magnitude from the simulations (Figure 1). A possible source of systematic error in the number counts at faint magnitudes must also be taken into account: the increased scatter in the photometric measurements at faint magnitudes, and the fact that there are more faint galaxies than bright galaxies, mean that it is more likely for faint galaxies to be brightened above the limit (or be brightened and move up one magnitude bin) than for brighter galaxies to appear erroneously in a fainter bin or fall out of the catalogue completely. This leads to an apparent increase in the number counts at the faintest magnitudes. The results from the model galaxy simulations were used to correct for this effect: the required corrections were smaller than 10% in all cases. Combining these effects produced corrected galaxy counts (), and scaling by the observed sky area, produced final counts per magnitude per square degree, .
Number counts were also derived using the same technique considering just the five fields with deeper images (see Section 2.1). This provided determinations of galaxy counts for which may be more reliable at the fainter magnitudes due to smaller completeness corrections.
| ∗ | ∗ | ∗ | |||
| All fields | |||||
| 14.0 – 14.5 | 1 | 1.0 | 101 | 101 | 48 |
| 14.5 – 15.0 | 2 | 2.0 | 202 | 143 | 85 |
| 15.0 – 15.5 | 3 | 3.0 | 304 | 175 | 218 |
| 15.5 – 16.0 | 10 | 10.1 | 1021 | 320 | 620 |
| 16.0 – 16.5 | 18 | 18.2 | 1840 | 430 | 960 |
| 16.5 – 17.0 | 36 | 36.4 | 3680 | 610 | 1530 |
| 17.0 – 17.5 | 63 | 64.3 | 6500 | 830 | 2530 |
| 17.5 – 18.0 | 93 | 90.8 | 9180 | 1010 | 5540 |
| 18.0 – 18.5 | 125 | 123.7 | 12500 | 1240 | 9470 |
| 18.5 – 19.0 | 189 | 203.0 | 20500 | 1770 | 10500 |
| 19.0 – 19.5 | 174 | 208.9 | 21100 | 2450 | 11600 |
| 19.5 – 20.0 | 168 | 306.7 | 31000 | 4700 | 17200 |
| Deep fields only | |||||
| 17.5 – 18.0 | 18 | 18.4 | 9340 | 2190 | 5540 |
| 18.0 – 18.5 | 23 | 21.6 | 10980 | 2510 | 9470 |
| 18.5 – 19.0 | 43 | 44.6 | 22700 | 3610 | 10500 |
| 19.0 – 19.5 | 46 | 47.9 | 24300 | 4080 | 11600 |
| 19.5 – 20.0 | 59 | 83.1 | 42200 | 6600 | 17200 |
| 20.0 – 20.5 | 54 | 114.6 | 58200 | 10900 | 22700 |
| ∗: counts per magnitude per square degree. | |||||

These galaxy counts are tabulated in Table 1 and plotted in Figure 6. The error on the number counts in each bin was calculated from two factors: the Poissonian error on the raw galaxy counts, and an error in the completeness correction which is generously assumed to be 30% of the number of counts added in the correction. The number counts are compared on the plot with counts from various K–band field surveys in the literature. The final column in Table 1 shows the mean galaxy counts per magnitude bin determined from these literature field surveys.
The galaxy counts derived in this paper show an excess of counts relative to the literature counts, which for magnitudes is at greater than the significance level. For comparison, the K–magnitudes of the radio galaxies themselves span the range . The integrated excess counts over the magnitude range corresponds to, on average, 11 galaxies per field. Unfortunately, as described in Section 2.1, the original goals of these observations was to carry out detailed studies of the radio source host galaxies, and so no blank sky frames were taken. Therefore no comparison can be made between radio galaxy and blank sky frames to determine whether the excess counts found here are associated with structures surrounding the radio galaxies or whether there is some systematic offset between the counts calculated here and the literature counts.
We believe that the majority of the excess counts are associated with the presence of the radio galaxies, for a number of reasons. First, Roche, Eales and Hippelein [Roche et al. 1998] found a similar excess in the K–band galaxy counts in a study of the fields surrounding 6C radio galaxies at similar redshifts. Second, as reviewed in the introduction, there are numerous lines of evidence suggesting that there are clusters around at least some of these objects. Third, later in this paper it will be shown that cross–correlation analyses and colour–magnitude relations indicate an overdensity of galaxies comparable to that observed.
4 Cross–correlation analyses
4.1 Angular cross-correlation estimators
The clustering of galaxies around the radio galaxies can be investigated using the angular cross–correlation function , which is defined from the probability of finding two sources in areas and separated by a distance :
where is the mean surface density of sources on the sky. From this, it follows that for a given survey:
| (1) |
where is the number of data–data pairs with angular separation of between and , is the total number of sources in data catalogue, is the total angular area of sky sampled and is the mean angular area of sky accessible at a distance to around the data points. Clearly is extremely difficult to calculate due to boundary effects; various estimators for have therefore been derived using comparisons between the data points and catalogues of randomly distributed points (e.g. see Cress et al. 1996 for a discussion). For the estimator adopted in this paper, it is considered that if random points are added to the image (where to minimise errors introduced by the random catalogue) then the number of data–random pairs between and will be given by:
| (2) |
| (3) |
In addition, it is possible to consider the angular cross–correlation function just around an individual source, in this case the radio galaxy. For this, the parameters become and , where and are respectively the number of radio galaxy–data and radio galaxy–random pairs between and , is the angular cross–correlation function for galaxies around the radio galaxy, and is the angular area of sky accessible at a distance to from the radio galaxy. These equations combine to give:
| (4) |
4.2 Calculating and
One problem with estimating and from the current data is that, due to the K–band dithering technique, the detection limit is a function of position across each image. More objects are detected in the central regions of the image, which would produce a spurious peak in the angular cross–correlation statistics. This non-uniform noise level can be accounted for using the simulations which were discussed in Section 2.2. From these simulations, for each field the completeness fraction can be calculated as a function of both magnitude and position, and then applied to the random catalogue in the following way.
Step 1: Excluding those objects determined to be stars, , , and were determined for each frame down to a chosen limiting magnitude , for a set of bins in .
Step 2: 25000 random objects were each assigned a random position on the image, and a magnitude drawn at random from a distribution matching the observed number counts (Figure 6).
Step 3: For each random object, the completeness fraction of objects of that magnitude and position (averaged in 50 by 50 pixel bins) was determined from the simulations. The object was accepted or rejected at random with a likelihood of acceptance based upon the derived completeness fraction.
Step 4: For those objects which remained in the catalogue, , , and were calculated. Hence and were derived.
This process was repeated for all images and for two different limiting magnitudes, and . corresponds to the limit at which the data are still almost 100% complete, whilst requires a significant completeness correction but provides improved statistics for the galaxy counts. The results were averaged over all 28 fields; investigating the values for individual fields was not attempted since for these small fields of view the measured amplitudes of single images are too strongly affected by variations in the background (and foreground) counts to provide results with a high statistical significance; only by combining the data of the 28 fields is a sufficiently robust measurement obtained. An estimation for the uncertainty in the value of the combined in each bin was provided by the scatter in the values between the different fields. The results are shown in Figure 7.
is usually assumed to have a power–law form; . If so, the observed will follow a form , where is known as the integral constraint and arises from the finite size of the field of view. Its value can be estimated by integrating over the area of each field, and for our data corresponds to and for, respectively, all galaxy-galaxy pairs and just radio galaxy-galaxy pairs. It is not possible to determine both the amplitude and the slope of the fit from the current data, and so the canonical value of (which also seems to be appropriate at high redshifts; Giavalisco et al. 1998) has been adopted. The observed data in Figure 7 has been fit with functions of this form, and the resulting angular cross–correlation amplitudes are provided in Table 2.

| Sources | |||||
|---|---|---|---|---|---|
| All g-g pairs | 0.0031 | 0.0012 | |||
| 0.0015 | 0.0004 | ||||
| Only rg-g pairs | 0.0092 | 0.0037 | 600 | 240 | |
| 0.0093 | 0.0021 | 510 | 120 |
The results at and are in approximate agreement. For the galaxy–galaxy pairs there may be a decrease of as fainter magnitude limits are used (as expected, e.g. see Roche et al. 1998), but the errors are too large to determine this with any degree of confidence. The galaxy–galaxy amplitudes are similar to those derived by Roche et al. to the same magnitude limits in the fields of radio galaxies at . A more obvious feature is that at both magnitude limits the cross–correlation amplitude around the radio galaxy is significantly larger (). Figure 7 shows that much signal originates at small angular separations () and so this cannot be related to any problems with completeness in the outer regions of the frames; the similarity of the results for and also demonstrates this.
4.3 The spatial cross–correlation amplitude
As has been described by many authors (e.g. Longair & Seldner 1979, Prestage and Peacock 1988) it is possible to convert from an angular cross–correlation amplitude to a spatial cross–correlation amplitude if the galaxy luminosity function is known. The spatial cross–correlation function is usually assumed to have a power–law form:
where the power–law slope is related to the slope of the angular cross–correlation function by (1.8 for the adopted here). The spatial cross–correlation amplitude, , is then related to that of the angular cross-correlation by (see Longair & Seldner [Longair & Seldner 1979] for a full derivation) where:
| (5) |
Here, is a definite integral which for has a value of 3.8, is the measured sky density of objects above the magnitude limit (per steradian), is the proper distance to a source at redshift , is the number of galaxies per unit comoving volume which at redshift are more luminous than apparent magnitude , and the factor is required to convert from degrees to radians. The value of is only a very weak function of provided is of order 2 [Prestage & Peacock 1988], and so the fixing of at 1.8 will introduce no significant errors.
requires assumptions for both the K–correction of galaxies and the local luminosity function, as well as being cosmology dependent, and so this conversion will always be somewhat uncertain. In this paper a Schechter [Schechter 1976] form is adopted for the local luminosity function, that is:
where is the number of galaxies per comoving cubic Mpc with luminosity to , is the density normalization factor, is the characteristic luminosity and is the faint–end slope. A pure luminosity evolution model is also adopted; that is, values for , and are taken, and the only evolution of this function is then evolution of the value of with redshift in accordance with passive evolution predictions. As discussed in the introduction, passive evolution models provide a good description of cluster galaxy properties back to , and they can also provide a reasonable fit to the observed K–band field number counts (see below). These models are, however, undoubtedly a simplification in view of hierarchical galaxy formation theories. In hierarchical models, fewer luminous galaxies are predicted to exist at high redshifts (e.g. see Figure 4 of Kauffmann and Charlot 1998), resulting in the values of and consequently being lower, and hence will be increased. The pure passive luminosity approach therefore provides a conservative lower estimate for the spatial cross–correlation amplitude around high redshift radio galaxies.
For the passive evolutionary models, the galaxy population was split into four different galaxy types: ellipticals and S0’s (E’s), Sa and Sb types (Sab’s), Sc types (Sc’s) and Sd types and irregulars (Sdm’s). Galaxies of these types were built up using the Bruzual and Charlot [Bruzual & Charlot 1993] stellar synthesis codes (1996 version), assuming a Scalo initial mass function, solar metallicity, a formation redshift , and four different star formation histories (cf. Guiderdoni and Rocca–Volmerange 1990). The E’s were assumed to form their stars in a rapid early burst with the star formation decreasing exponentially on a Gyr timescale. The Sab’s had 50% of their stars in a bulge component formed in the same manner as the E’s, and the remaining 50% in a disk–like component with a much longer star formation timescale ( Gyr). The Sc’s were modelled using just a single long star formation timescale ( Gyr), and the Sdm’s using a still longer timescale ( Gyr) to produce significant star formation at the current epoch. These star formation histories approximately reproduce the colours of the various morphological types at the current epoch. It was assumed that all of these four morphological types displayed the same luminosity function (that is, and ), with the weightings of the different types (ie. the relative contributions to ) being 30%, 30%, 30% and 10% respectively. In fact, at wavelengths as long as the K–band, the K and evolutionary corrections are small and relatively independent of morphological type, and so the results are not strongly dependent upon any of these assumptions. Changing the values adopted above by a sufficiently large amount that they produce unacceptable distributions of galaxy colours at the current epoch produces only 10-20% changes in the final K–band luminosity function.
Local K–band luminosity functions have been derived by Gardner et al. [Gardner et al. 1993], by Mobasher, Sharples and Ellis [Mobasher et al. 1993] and by Loveday [Loveday 2000]. All three of these datasets are approximately consistent with a characteristic absolute magnitude and a slope . To investigate whether the combination of this luminosity function and the assumption of passive evolution models produces acceptable results, and to calculate the appropriate value of , the K–band number counts as a function of apparent magnitude that would be expected in this model were derived. The value of was adjusted to provide a good fit to the observed data points. The resulting fit, for a value , is shown as the solid line in Figure 6, and demonstrates that this simple model can provide a reasonable fit to the observed number counts.
With this model luminosity function, it is possible to calculate and, using the values of from Table 1 ( for and for ), hence to determine . For , ranges from to over the redshift range 0.6 to 1.8. The mean value of averaged over all 28 radio source redshifts is , and using this value to convert from to gives . For the corresponding range of is from to , with a mean value of , corresponding to .
These values can be interpreted physically by comparing with the equivalent values for Abell clusters calculated between the central galaxy and the surrounding galaxies (). This has been calculated independently as a function of Abell cluster richness by a number of authors [Prestage & Peacock 1988, Hill & Lilly 1991, Andersen & Owen 1994, Yee & López–Cruz 1999]. Converting their values to km s-1 Mpc-1 and they are all approximately consistent with each other, and average to for Abell class 0 and for Abell class 1. The environments surrounding the redshift one radio galaxies are therefore comparable, on average, to those of clusters of between Abell Classes 0 and 1 richness.
Hill and Lilly [Hill & Lilly 1991] further showed that there is a correlation between the value of and the parameter , where is an Abell–type measurement defined as the net excess number of galaxies within a radius of 0.5 Mpc of the central galaxy with magnitudes between and , being the magnitude of the central galaxy. Using a larger dataset, Wold et al. [Wold et al. 2000] calibrated this relation as . The average value for then implies that an average net excess of 13.5 galaxies should be found around each radio galaxy within a radius of 0.5 Mpc and with a magnitude down to three magnitudes fainter than the radio galaxy. The data presented in this paper cover about 80% of this sky area and, since the radio galaxies have typical magnitudes of , the galaxy counts to do sample approximately 3 magnitudes below the radio galaxy. Therefore, the net excess counts of 11 galaxies per field down to (see Section 3) is fully consistent with the determined value of .
5 Colour–magnitude and colour–colour relations
5.1 Near–infrared colour–magnitude relations
For each field the magnitudes of all galaxies were determined through all of the different filters, as described in Section 2.3. After correction for galactic reddening, these were used to construct colour–magnitude relations for each field. The near–infrared vs relation for each field (if –band data were not taken, the longest wavelength HST filter available was used instead) are shown in Figure 9 in order of ascending redshift. The stars (open diamonds) and galaxies (asterisks) have been separated on these diagrams using the technique described in Section 2.4, and the radio galaxy is plotted using a large symbol. The uncertainties on the measured colours are not shown to avoid cluttering up the diagrams; at bright magnitudes () they are dominated by calibration uncertainties ( mags), but increase to about 0.3 magnitudes by .


The colour–magnitude relation for the Coma cluster has been redshifted and evolved according to the passive evolutionary models for elliptical galaxies described in the previous section; this redshifted relation is over-plotted on the figures. Note that the radio galaxies generally have near–infrared colours similar to this theoretical line, indicating that these are old elliptical galaxies (e.g. Best et al. 1998b), but not in all cases: some of the radio galaxies appear redder because a heavily reddened nuclear component contributes to the K–band emission (e.g. 3C22, 3C41; Economou et al. 1995, Rawlings et al. 1995, Best et al. 1998), whilst for others the bluer filter is significantly contaminated by excess optical–UV emission induced by the radio source (the ‘alignment effect’, e.g. McCarthy et al. 1987).
A number of features are apparent from these near–infrared colour–magnitude diagrams. Considering initially those radio galaxies with redshifts , many of the sample show reasonably convincing evidence for associated clusters; here it should be born in mind that for an Abell Class 1 cluster only 10 to 15 associated cluster galaxies are expected in the observed region of sky down to three magnitudes below the magnitude of the radio galaxy (see Section 4.3). Some fields (e.g. 3C34, 3C337) clearly show at least this number (the ‘background’ counts at these K–magnitudes and colours are small, as can be seen by a comparison with the colour–magnitude relations of the higher redshift sources), whilst other fields (e.g. 3C217) show few if any associated galaxies. There are clearly large source–to–source variations in environmental richness.
Where a clear colour–magnitude relation is observed, the mean colour of this relation lies close to that calculated theoretically by just passively evolving the Coma colour–magnitude relations back in redshift, and the scatter around the colour–magnitude sequence is small. These results have been shown before for optical and X–ray selected clusters at redshifts out to (e.g. Stanford et al. 1998). There are some small deviations in the colour of the observed sequence from the passive evolution relation (e.g. see 3C265), but none much larger than a couple of tenths of a magnitude. The near–infrared colours of the galaxies in the radio galaxy fields are therefore consistent with those observed in other clusters at the same redshift, implying that the excess galaxy counts are associated with a structure at the radio galaxy redshift. This is important because of previous suggestions that powerful distant radio galaxies may be systematically amplified by foreground lensing structures (Le Fèvre et al. 1987; Benítez, Martínez–Gonzáles and Martin–Mirones 1997); were such structures to be present, they could account for both the excess K–band counts and the peak in the cross–correlation statistics, but the colour–magnitude relations argue against this.
At higher redshifts the evidence for clear colour–magnitude relations is much poorer. This is mainly because the combination of the greatly increased contribution from field galaxies at these fainter magnitudes and the increased scatter in the colours due to photometric uncertainties, results in any colour–magnitude sequence appearing much less prominent. The difficulty of selecting cluster candidates at these redshifts on the basis of a single colour can be gauged by examining 3C324; for this field, Dickinson [Dickinson 1997] has confirmed the presence of a poor cluster of galaxies, but this is barely apparent from its colour–magnitude relation.
Although no prominent colour–magnitude sequences are seen in the higher redshift fields, there remains a net excess of K–band counts: if the fields of the radio galaxies are divided into two redshift bins, no significant differences in the faint galaxy counts are seen between the high and low redshift fields. A simple analysis also shows that the excess in the fields of the higher redshift radio galaxies is comprised of red () galaxies. In Table 3 are given the mean number of galaxies per field with magnitudes and colours or , in the low and high redshift bins. There are more galaxies with bluer colours in the fields of the lower redshift radio galaxies than in those at higher redshifts, due to the associated cluster galaxies in the lower redshift fields which have colours (cf. Figure 8). On the other hand, there are more galaxies with colours in the high redshift than low redshift fields. The excess K–band galaxy counts in the high redshift field appear to be predominantly associated with red galaxies, with colours similar to those expected for old cluster galaxies at these redshifts. This again indicates that the excess number counts are associated with a structure at the redshift of the radio galaxy rather than a foreground structure.
| No. fields | Mean number of galaxies | ||
|---|---|---|---|
| 9 | |||
| 11 | |||
5.2 Multi–colour relations


In Figure 9 are plotted a complete set of colour–magnitude relations for six galaxies in the sample, chosen to be those which show amongst the best examples of near–infrared colour–magnitude relations for their redshift333Equivalent plots for the other fields are available from the author on request, but are not reproduced here to save space.. From these it is apparent that, although the scatter around the near–infrared colour–magnitude sequence remains small even at these high redshifts, colours that reach shortward of the rest–frame 4000Å break show a dramatic increase in the scatter of the relation. (e.g. compare the various relations for 3C34); these colours can be strongly influenced by small amounts of recent or on–going star formation, indicating that this may be common in these high redshift clusters. Whether such star formation is in some way connected with the presence of a powerful radio source in these clusters cannot be distinguished from these data.
To properly investigate the nature of the galaxies in these fields, all of the colour information must be used simultaneously to derive photometric redshifts and investigate star formation activity. This is beyond the scope of the current paper but will be addressed later (Kodama & Best, in preparation). Here, the use of the all multi–colour information simulataneously is merely demonstrated in Figure 10 through colour–colour plots for these six fields. For each field, the near–infrared colour of each galaxy is plotted against its optical-infrared colour. These data are then compared against theoretical evolutionary tracks for the four different passively evolving galaxy models considered in Section 4.3 (E’s, Sab’s, Sc’s, Sdm’s).
For the lower redshift radio galaxies there is clearly a large concentration of galaxies with colours very close to those of the model elliptical galaxy at the redshift of the radio source. Further, there is a distribution of galaxies with colours between this and the colours of the model spiral galaxies at that redshift. In contrast, for the higher redshift radio galaxies, no strong concentration of galaxies is seen close to the elliptical galaxy prediction, and the number of cluster candidates lying between the locations of the elliptical and spiral model galaxies is smaller than that found in the lower redshift cases. Clearly, despite the excess –counts and red galaxies in the fields of these high redshift radio sources, to accurately investigate cluster membership requires the construction of photometric redshifts using several colours measured with high photometric accuracy.

6 Discussion
In this paper a number of pieces of evidence for clustering around distant 3CR radio galaxies have been presented. These can be summarised as follows:
-
•
The K–band number counts show an overdensity of faint galaxies in the fields of the radio galaxies, with a mean value of 11 excess galaxies per field.
-
•
This excess is comparable to the galaxy overdensity expected for a field of view of this size centred on a cluster of approximately Abell Class 0 richness.
-
•
Cross–correlation analyses show a pronounced peak in the angular cross–correlation function around the radio galaxies.
-
•
Assuming that the galaxy luminosity function undergoes pure passive luminosity evolution with redshift, the corresponding spatial cross–correlation amplitude lies between those determined for Abell Class 0 and Abell Class 1 clusters.
-
•
The galaxies in the fields of most of the lower redshift radio galaxies in the sample show clear near–infrared colour–magnitude relations with only small scatter. The colours of these sequences are in agreement with those of other clusters at these redshifts, indicating that the excess number counts and cross–correlation peak are both associated with a structure at the redshift of the radio galaxy.
-
•
There is considerably more scatter in the relations involving shorter wavelength colours, suggesting low levels of recent or on–going star formation in many of the galaxies.
-
•
At higher redshifts the colour–magnitude relations are less prominent due to increased background contributions, but there is a clear excess of galaxies with very red infrared colours.
These features all provide strong evidence that distant radio galaxies tend to reside in rich environments. The number counts, the cross–correlation statistics, and the colour–magnitude relations all complement the previous results from X–ray imaging, narrow–band imaging, spectroscopic studies and radio polarisation studies discussed in Section 1. A coherent picture that most, but not all, high redshift radio sources live in poor to medium richness clusters has now been built.
Taking the results at face value, the environmental richness around these radio galaxies is higher than that around powerful radio galaxies at calculated by Yates et al. [Yates et al. 1989] and by Hill and Lilly [Hill & Lilly 1991]. This suggests that the increase between and in the mean richness of the environments surrounding FR II radio galaxies, found by those authors, continues to higher redshifts.
Some notes of caution must be added to this conclusion. First, from the variations in richness of the colour–magnitude relation at any given redshift, (e.g. compare 3C217 and 3C226), it is apparent that there is a wide spread in the density of the environments in these fields. Although most show some evidence of living in at least group environments, not all powerful distant radio galaxies lie in clusters. Second, a simple visual comparison with the extremely rich high redshift cluster MS105403 (, van Dokkum 1999) is sufficient to demonstrate that even at high redshifts, powerful radio galaxies still avoid the most extreme richness clusters.
Further, although the galaxy count excesses and the cross–correlation amplitudes have been compared with those of Abell clusters at low redshifts, in hierarchical galaxy formation models such comparisons will always be somewhat ambiguous. On–going mergers between galaxies mean that more sub–clumps are seen at higher redshifts, whilst the general galaxy cross–correlation length also evolves with redshift in a manner dependent upon both cosmological parameters and the method of selecting the galaxy populations [Kauffmann et al. 1999]. Therefore, quantitative interpretations of either of these parameters at high redshift must be considered with some care. On the other hand, in hierarchical growth models, the structures in which the radio galaxies reside will also continue to grow and evolve into much richer structures by a redshift of zero, meaning that the qualitative result that the high redshift radio galaxies lie in rich environments for their redshift is secure.
Finally, it is important to consider the consequences for our understanding of the onset and nature of powerful radio sources of a change in the environments of FR II radio galaxies from groups at low redshifts to clusters at high redshift. As discussed by Best et al. [Best et al. 1998b], if this result holds then the standard interpretation of the tightness and slope of the Hubble relation, that of ‘closed–box passive evolution’ of radio galaxies at into radio galaxies at , is no longer valid. It is not possible that the environments can become less rich with progressing cosmic time. Instead, Best et al. propose that powerful radio galaxies selected at high and low redshift have different evolutionary histories but must contain a similar mass of stars, a few times , so conspiring to produce the observed ‘passively evolving’ K relation. In their model, powerful FR II radio sources are seldom formed in more massive galaxies (that is, in central cluster galaxies at low redshifts) because of the difficulties in supplying sufficient fueling gas to the black hole: in rich low redshift clusters the galaxies and gas have been virialised and take up equilibrium distributions within the cluster gravitational potential, the galaxies have high velocity dispersions greatly reducing the merger efficiency, and there is a dearth of gas–rich galaxies close to the centre of the clusters which might merge with, and fuel, the central galaxy. Thus, the formation of a powerful radio source in these environments is a rare event (but can still happen, e.g. Cygnus A).
At high redshifts, radio galaxies can be found in (proto) cluster environments because these are not yet virialised, have frequent galaxy mergers, and have a plentiful supply of disturbed intracluster gas to fuel the central engine and confine the radio lobes. The central cluster galaxies will be amongst the most massive galaxies at these redshifts and so, from the correlation between black hole mass and bulge mass (e.g. Kormendy and Richstone 1995), will have the most massive black holes. The kinetic energy of the relativistic radio jets of distant 3CR radio galaxies corresponds to the Eddington luminosity of a black hole with [Rawlings & Saunders 1991], implying that these sources are fueled close to the Eddington limit. Therefore the most powerful radio sources will tend to be powered by the most massive central engines and hence be hosted by the most massive galaxies, which tend to be found at the centres of forming rich clusters. The significant scatter in the black hole versus bulge mass correlation [Kormendy & Richstone 1995] would, however, result in some scatter in the richness of the environments of the radio galaxies. The data presented in this paper are in full agreement with this model.
Acknowledgements
This work was supported in part by the Formation and Evolution of Galaxies network set up by the European Commission under contract ERB FMRX– CT96–086 of its TMR programme. The United Kingdom Infrared Telescope is operated by the Joint Astronomy Centre on behalf of the U.K. Particle Physics and Astronomy Research Council. This work is, in part, based on observations made with the NASA/ESA Hubble Space Telescope, obtained at the Space Telescope Science Institute, which is operated by AURA Inc., under contract from NASA. I thank Huub Röttgering for useful discussions, and the referee for helpful comments.
References
- [Andersen & Owen 1994] Andersen V., Owen F. N., 1994, AJ, 108, 361
- [Barthel & Arnaud 1996] Barthel P. D., Arnaud K. A., 1996, MNRAS, 283, L45
- [Benítez et al. 1997] Benítez N., Martínez-Gonzáles E., Martin-Mirones J. M., 1997, A&A, 321, L1
- [Bershady et al. 1998] Bershady M. A., Lowenthal J. D., Koo D. C., 1998, ApJ, 505, 50
- [Bertin & Arnouts 1996] Bertin E., Arnouts S., 1996, A&A Supp., 117, 393
- [Best et al. 1998a] Best P. N., Carilli C. L., Garrington S. T., Longair M. S., Röttgering H. J. A., 1998a, MNRAS, 299, 357
- [Best et al. 1997] Best P. N., Longair M. S., Röttgering H. J. A., 1997, MNRAS, 292, 758
- [Best et al. 1998b] Best P. N., Longair M. S., Röttgering H. J. A., 1998b, MNRAS, 295, 549
- [Bower et al. 1998] Bower R. G., Kodama T., Terlevich A., 1998, MNRAS, 299, 1193
- [Bruzual & Charlot 1993] Bruzual G., Charlot S., 1993, ApJ, 405, 538
- [Burstein & Heiles 1982] Burstein D., Heiles C., 1982, AJ, 87, 1165
- [Butcher & Oemler 1978] Butcher H. R., Oemler A., 1978, ApJ, 219, 18
- [Carilli et al. 1997] Carilli C. L., Röttgering H. J. A., van Ojik R., Miley G. K., van Breugel W. J. M., 1997, ApJ Supp., 109, 1
- [Crawford & Fabian 1996] Crawford C. S., Fabian A. C., 1996, MNRAS, 282, 1483
- [Dickinson 1997] Dickinson M., 1997, in Tanvir N. R., Aragón-Salamanca A., Wall J. V., eds, HST and the high redshift Universe. Singapore: World Scientific, p. 207
- [Djorgovski & Davies 1987] Djorgovski S., Davies M., 1987, ApJ, 313, 59
- [Djorgovski et al. 1995] Djorgovski S., Soifer B. T., Pahre M. A., Larkin J. E., Smith J. D., Neugebauer G., Smail I., Matthews K., Hogg D. W., Blandford R. D., Cohen J., Harrison W., Nelson J., 1995, ApJ, 438, L13
- [Dressler et al. 1987] Dressler A., Lyndon-Bell D., Burstein D., Davies R. L., Faber S. M., Terlevich R., Wegner G., 1987, ApJ, 313, 42
- [Dunlop et al. 1996] Dunlop J. S., Peacock J., Spinrad H., Dey A., Jimenez R., Stern D., Windhorst R., 1996, Nat, 381, 581
- [Economou et al. 1995] Economou F., Lawrence A., Ward M. J., Blanco P. R., 1995, MNRAS, 272, L5
- [Fanaroff & Riley 1974] Fanaroff B. L., Riley J. M., 1974, MNRAS, 167, 31P
- [Gardner et al. 1993] Gardner J. P., Cowie L. L., Wainscoat R. J., 1993, ApJ, 415, L9
- [Giavalisco et al. 1998] Giavalisco M., Steidel C. C., Adelberger K. L., Dickinson M. E., Pettini M., Kellogg M., 1998, ApJ, 503, 543
- [Guiderdoni & Rocca–Volmerange 1990] Guiderdoni B., Rocca–Volmerange B., 1990, A&A, 227, 362
- [Hill & Lilly 1991] Hill G. J., Lilly S. J., 1991, ApJ, 367, 1
- [Holtzman et al. 1995] Holtzman J. A., Burrows C. J., Casertano S., Hester J. J., Trauger J. T., Watson A. M., Worthey G., 1995, PASP, 107, 1065
- [Kauffmann & Charlot 1998] Kauffmann G., Charlot S., 1998, MNRAS, 297, L23
- [Kauffmann et al. 1999] Kauffmann G., Colberg J. M., Diaferio A., White S. D. M., 1999, MNRAS, 307, 529
- [Kormendy & Richstone 1995] Kormendy J., Richstone D., 1995, ARA&A, 33, 581
- [Kron 1980] Kron R. G., 1980, ApJ Supp., 43, 305
- [Kurk et al. 2000] Kurk J. D., Röttgering H. J. A., Pentericci L., Miley G. K., 2000, A&A: submitted.
- [Laing et al. 1983] Laing R. A., Riley J. M., Longair M. S., 1983, MNRAS, 204, 151
- [Lambas et al. 1992] Lambas D. G., Maddox S. J., Loveday J., 1992, MNRAS, 258, 404
- [Lauer 1989] Lauer T. R., 1989, PASP, 101, 445
- [Le Fèvre et al. 1987] Le Fèvre O., Hammer F., Nottale L., Mathez G., 1987, Nat, 326, 268
- [Longair & Seldner 1979] Longair M. S., Seldner M., 1979, MNRAS, 189, 433
- [Loveday 2000] Loveday J., 2000, MNRAS: in press.
- [Mao et al. 1998] Mao S., Mo H. J., White S. D., 1998, MNRAS, 297, L71
- [McCarthy et al. 1995] McCarthy P. J., Spinrad H., van Breugel W. J. M., 1995, ApJ Supp., 99, 27
- [McCarthy et al. 1987] McCarthy P. J., van Breugel W. J. M., Spinrad H., Djorgovski S., 1987, ApJ, 321, L29
- [Mcleod et al. 1995] Mcleod B. A., Bernstein G. M., Rieke M. J., Tollestrup E. V., Fazio G. G., 1995, ApJ Supp., 96, 117
- [Minezaki et al. 198] Minezaki T., Kobayashi Y., Yoshii Y., Peterson B. A., 198, ApJ, 494, 111
- [Mobasher et al. 1993] Mobasher B., Sharples R. M., Ellis R. S., 1993, MNRAS, 263, 560
- [Moustakas et al. 1997] Moustakas L. A., Davis M., Graham J. R., Silk J., Peterson B. A., Yoshii Y. L. M., Coles P., Lucchin F., Matarrese S., 1997, ApJ, 475, 445
- [Owen et al. 1997] Owen F. N., Ledlow M. J., Morrison G. E., Hill J. M., 1997, ApJ, 488, L15
- [Prestage & Peacock 1988] Prestage R. M., Peacock J. A., 1988, MNRAS, 230, 131
- [Rawlings et al. 1995] Rawlings S., Lacy M., Sivia D. S., Eales S. A., 1995, MNRAS, 274, 428
- [Rawlings & Saunders 1991] Rawlings S., Saunders R., 1991, Nat, 349, 138
- [Roche et al. 1998] Roche N., Eales S., Hippelein H., 1998, MNRAS, 295, 946
- [Rosati et al. 1998] Rosati P., Della Ceca R., Norman C., Giacconi R., 1998, ApJ, 492, L21
- [Schechter 1976] Schechter P. L., 1976, ApJ, 203, 297
- [Scodeggio et al. 1999] Scodeggio M., Olsen L. F., da Costa L., Slijkhuis R., Deul E., Erben T., Hook R., Nonino M., Wicenec A., Zaggia S., 1999, A&A Supp., 137, 83
- [Simard et al. 1999] Simard L., Koo D. C., Faber S. M., Sarajedini V. L., Vogt N. P., Phillips A. C., Gebhardt K., Illingworth G. D., Wu K. L., 1999, ApJ, 519, 563
- [Songaila et al. 1994] Songaila A., Cowie L. L., Hu E. M., Gardner J. P., 1994, ApJ Supp., 94, 461
- [Stanford et al. 1998] Stanford S. A., Eisenhardt P. R., Dickinson M., 1998, ApJ, 492, 461
- [Stanford et al. 1997] Stanford S. A., Elston R., Eisenhardt P. R., Spinrad H., Stern D., Dey A., 1997, AJ, 114, 2232
- [Szokoly et al. 1998] Szokoly G. P., Subbarao M. U., Connolly A. J., Mobasher B., 1998, ApJ, 492, 452
- [van Breugel et al. 1999] van Breugel W. J. M., De Breuck C., Stanford S. A., Stern D., Röttgering H. J. A., Miley G. K., 1999, ApJ, 518, L61
- [van Dokkum 1999] van Dokkum P. G., 1999, Ph.D. thesis, University of Groningen
- [van Dokkum et al. 1999] van Dokkum P. G., Franx M., Fabricant D., Kelson D. D., Illingworth G. D., 1999, ApJ, 520, L95
- [White & Frenk 1991] White S. D. M., Frenk C. S., 1991, ApJ, 379, 52
- [Wold et al. 2000] Wold M., Lacy M., Lilje P. B., Serjeant S., 2000, MNRAS: submitted., astro-ph/9912070
- [Yates et al. 1989] Yates M. G., Miller L., Peacock J. A., 1989, MNRAS, 240, 129
- [Yee & López–Cruz 1999] Yee H. K. C., López–Cruz O., 1999, AJ, 117, 1985