The environments of FRII radio sources
Abstract
Using ROSAT observations, we estimate gas pressures in the X-ray-emitting medium surrounding 63 FRII radio galaxies and quasars. We compare these pressures with the internal pressures of the radio-emitting plasma estimated by assuming minimum energy or equipartition. In the majority of cases (including 12/13 sources with modelled, spatially resolved X-ray emission) radio sources appear to be underpressured with respect to the external medium, suggesting that simple minimum-energy arguments underestimate the sources’ internal energy density. We discuss possible departures from the minimum energy condition and the consequences of our result for models of the dynamics of radio galaxies, in particular self-similar models (Kaiser & Alexander 1997).
keywords:
galaxies: active – X-rays: galaxies – galaxies: clusters: general1 Introduction
Are classical double radio sources (FRIIs; Fanaroff & Riley 1974) strongly overpressured with respect to the external medium, or are they approximately in pressure equilibrium with it? This question is crucial to our understanding of the dynamics and evolution of radio sources. It seems clear that FRIIs expand with time along their jet axis, with the momentum flux supplied by the jet being balanced (on average) by the ram pressure of the external medium. But, as pointed out by Scheuer (1974), their lateral expansion, perpendicular to the jet axis, depends on the difference between the internal (lobe) pressure and the external (gas) pressure. If the internal pressure is always much greater than the external pressure (both at all times in the source’s lifetime and at all points along its length), then the source will expand laterally, at a speed controlled by the pressure difference; in the limit of strong overpressuring of the lobe the expansion will be supersonic and an elliptical bow shock will surround the source [model A of Scheuer (1974)]. On the other hand, if the internal pressure becomes similar to the pressure in the hot plasma of the external medium, then the transverse expansion will be subsonic or will cease entirely, although the supersonic linear expansion will continue (Scheuer’s model C). Scheuer pointed out that the variation of the external pressure along a source’s length could lead to a situation where the inner parts only are underpressured and contract, so that eventually buoyancy forces would push the radio lobes away from the galaxy. (We will discuss this ‘cocoon crushing’ process further in section 1.)
Scheuer (1974) preferred model C, since at that time observations of radio sources did not show the strong lobe emission that model A predicts as a result of requiring high internal pressure. Since better data now show that the lobes are the dominant radio-emitting components at low frequencies, the objection to model A vanishes, and many authors take model A to be a good first-order picture of the evolution of a radio source. But despite the numerous observational advances of the last 25 years, the question of whether all classical doubles are in fact strongly overpressured with respect to their environments – that is, whether all classical doubles can be described by Scheuer’s model A – is still open.
The observation that axial ratios (i.e. the ratio of the length of the source to its width, by some suitable definition) are similar for sources of very different lengths (and hence ages) is often taken to be compelling evidence that the lobes of radio galaxies expand transversely throughout their lives. If radio sources were confined transversely throughout their lives, or if they came into pressure equilibrium with the external medium at a relatively early stage in their existence, there would be a strong trend for longer sources to be relatively thinner, which is not observed (Miller et al. 1985). Recent self-similar models for classical double radio galaxies (e.g. Kaiser & Alexander 1997) depend on this transverse expansion, which in turn depends on the internal pressure of the lobes being much greater than any external pressure from the radio galaxy’s environment.
X-ray observations provide insight into this problem by allowing us to measure properties of the hot, high-pressure phase of the external medium. Early investigations based on Einstein data found insufficient external pressure to balance the minimum-energy pressure in a few FRII sources, in support of model A. For example, Arnaud et al. (1984) found that the archetypal classical double 3C 405 (Cygnus A) had a minimum lobe pressure slightly higher than the external pressure, and Miller et al. (1985) argued that upper limits on the X-ray emission from a small sample of lower-power FRII sources implied that they were unconfined by an external atmosphere. However, lower-power FRI sources inhabit a range of environments, from poor groups to rich clusters, and it is now well established that the minimum pressures in their kpc-scale radio structures are almost always lower, by an order of magnitude or more, than those in the X-ray-emitting gas (Morganti et al. 1988; Killeen, Bicknell & Ekers 1988; Feretti et al. 1990; Taylor et al. 1990; Feretti, Perola & Fanti 1992; Böhringer et al. 1993; Worrall, Birkinshaw & Cameron 1995; Hardcastle, Birkinshaw & Worrall 1998b; Worrall & Birkinshaw 2000a). Subsequent observations with ROSAT have suggested that the minimum pressures in some FRIIs are also in fact lower than those in the X-ray emitting gas (Carilli, Perley & Harris 1994; Leahy & Gizani 1999). This makes it worthwhile to assess the present observational information on pressures in the external media of a large sample of FRII sources, and to see what support there is for the ‘model A’ description of these objects.
We have recently made a study of those sources in the 3CRR sample (Laing, Riley & Longair 1983) with pointed ROSAT observations (Hardcastle & Worrall 1999, hereafter paper I). Slightly over half of the sample was observed with ROSAT, and 80 per cent of the observed sources were detected, giving us a large sample of observations with good spatial resolution. The FRIIs in the observed sample span the redshift range from 0.03 to 1.5 and are a good cross-section of those in 3CRR as a whole. In this paper we discuss the environments of FRII sources taken from this sample, and the implications for radio-source models.
Throughout the paper we use a cosmology with km s-1 Mpc-1 and .
2 Data
2.1 Sources with modelled atmospheres
61 FRII 3CRR sources were observed with ROSAT, as described in paper I. Of these, 26 FRII radio galaxies (including 6 broad-line radio galaxies) and 19 FRII quasars were detected. However, the majority of the detections were not good enough to allow us to characterise the spatial distribution of extended emission, either because of poor statistics or because the X-ray emission was dominated by a nuclear point source. The FRII objects for which we were able to fit spatially resolved models to the X-ray data in paper I are listed in Table 1, together with the details of the ROSAT observation. In addition to the objects described by Laing et al. (1983) as FRIIs, we have included the ‘jetted double’ source 3C 346 (which though formally an FRI has weak hotspots), and Cygnus A (3C 405) which is not a 3CRR object because of its low galactic latitude.
We have used models to describe the radial distribution of gas, using the method described by Birkinshaw & Worrall (1993). In paper I we fitted only a few, physically reasonable values of to the X-ray data for each source, and quoted the best-fitting combination of and core radius. Since here we are interested in determining the full range of uncertainty in the derived pressures, we adopt the method applied by Worrall & Birkinshaw (2000b) to 3C 346 and allow a wide range of values of and core radius in our fits. For each source we find the best-fit values of the pressure at the projected inner and outer radii of the radio lobe of interest. Uncertainties in pressure correspond to ( for one interesting parameter), where , core radius, -model normalization and normalization of a central point source are all free parameters. In several cases the errors in pressure are highly asymmetrical, allowing pressures much larger than the best-fit values. These are sources where the data are centrally peaked, and thought to contain a strong AGN-related nuclear component, but where the fitting procedure allows, within the errors, a large fraction of the central peak to be in high-pressure gas.
An estimate of the hot-gas temperature is necessary to determine the pressure and its uncertainty. A direct measurement from X-ray data is used if available. Otherwise, we assume keV [based on our observations of the environments of low-redshift FRI objects; Worrall & Birkinshaw (1994, 2000a)] for sources which inhabit low-luminosity X-ray environments, and a temperature derived from the temperature-luminosity relation (as discussed in paper I) for the high-luminosity objects. Where we estimate the temperature, we assume that the X-ray emission can be described with a Raymond-Smith model with 0.5 cosmic abundance.
2.2 Limits on external pressure
The results discussed above are for sources in which an extended environment was detected and separated from the nuclear point source, where present. There is a risk of bias (in the sense of selecting the most X-ray luminous environments) if we do not also consider upper limits from sources without well-characterized environments, which make up the majority of the ROSAT-observed sample. Because we do not have radial-profile information for these objects, we must adopt a model for the gas distribution and temperature of the undetected group or cluster. In paper I we assumed that high-redshift sources without detected extended emission have environments similar to those of the detected clusters, with keV, and core radius 150 kpc. This model seems unlikely to be appropriate for low-redshift FRIIs which, as we know both from X-ray work (paper I) and optical studies (e.g. Prestage & Peacock 1988), do not typically lie in rich environments. For nearby FRIIs we have used a model of a typical group-scale atmosphere [based on our observations of nearby FRIs; Canosa et al. (1999), Worrall & Birkinshaw (2000a)] which has keV, and core radius 40 kpc. We adopt a redshift of 0.3 as the boundary between the two types of FRII atmosphere. The choice of model parameters does not affect the derived upper limits on central gas pressure by more than a factor 3 for typical sources around the boundary redshift.
Of the total of 63 sources, 16 were not detected in the observations discussed in paper I, and we have determined upper limits on the central count density by using the upper limits derived for point-source components in that paper, which were obtained by applying Poisson statistics to a suitably chosen detection cell. We obtain limits on the central normalization of a -model by considering how many counts it would contribute to a detection cell, taking the size of the cell and the PSF of the instrument into account.
For the 14 sources which were detected, but which had too few counts to allow a convincing radial-profile fit to be carried out, we assume that the total counts in the source region constitute an upper limit on the contribution from an extended component in that region, taking into account the fact that the -model will also contribute some counts to the background region. Choices of source region and background region are discussed in paper I, but typically for HRI data an on-source circle of 1 arcmin radius and a background annulus extending to 2 arcmin were used, while for PSPC data the corresponding radii were normally 2 and 3 arcmin respectively.
Finally, for the 20 sources which were detected and found to have radial profiles consistent with the point-spread function (mostly high- quasars), we use the technique described in paper I to put an upper limit on the count rate from an extended component. This involves simulating observations of a point source and extended component and finding the count rate at which the extended component would reliably be detected in the radial profile. For the broad-line radio galaxy 3C 390.3 we use the archival PSPC image, rather than the large number of short HRI observations of Harris, Leighly & Leahy (1998) which we discussed in paper I.
These procedures give us limits on central count density, which we translate into central proton number density and pressure using the relations given by Birkinshaw & Worrall (1993). These limits are tabulated in Table 2.
2.3 Minimum pressures
For each of the observed sources we have used existing radio data to determine a minimum pressure in one of the radio lobes; we choose the one which better matches a cylindrical geometry and which is less affected by compact structure such as jets and hotspots. Minimum pressures are calculated on the assumption that the radio emission is synchrotron, and that the only contributions to the internal energy density come from synchrotron-emitting electrons (and possibly positrons) and the magnetic field. The minimum energy density which allows us to obtain the observed synchrotron emissivity can then be calculated, and the minimum pressure is derived from this.
There are several different possible approaches to calculating this minimum energy density. Using a number of simple assumptions, including a power-law distribution of electron energies with between and and zero elsewhere, the total minimum energy density in a synchrotron source with cylindrical geometry is proportional to
| (1) |
where is the observed radio flux, and are the observed angular length and radius respectively, is the luminosity distance to the source, and is the ratio between the energy densities in non-radiating and radiating particles; is a function of the energy range of the electron power law, defined as
There is a relatively weak dependence of the minimum energy on parameters such the source dimensions and , and an extremely weak dependence on the energy range used.
To perform minimum-energy calculations for our sources we use computer code which performs the synchrotron emissivity and electron energy integrals numerically, thus allowing us to use more complex electron energy spectra. Normally we assume that the electron energy spectrum is a power law with energy index of 2 between eV () and eV (); this is the standard energy index derived for first-order Fermi acceleration at strong shocks. For our flux measurements we have used the lowest-frequency available radio data of good quality, so as to minimise the effect of any age-related steepening in the electron spectrum (which is most marked at high electron energies and so high radio frequencies) and to reduce the contribution of hotspots, which have flat spectra. Where two or more radio frequencies are available, we have allowed the electron energy index to steepen to 3 at a best-fit energy, to account roughly for the effects of synchrotron ageing. We set to zero and approximate the lobes as uniform cylinders to derive an average ‘lobe pressure’. [We expect that the pressure is reasonably constant throughout the lobes of an FRII radio source, except at or close to the hotspot, because of the high expected sound speed in the radio-emitting plasma, as argued by Kaiser & Alexander (1997).] We assume that the sources are in the plane of the sky; this means (equation 1) that we overestimate the minimum pressure by a factor of , where is the angle to the line of sight, but this factor is small compared to the other uncertainties in the calculation unless is very small (see section 3.3).
For some of the sources without well-characterised X-ray environments, radio maps were not available to us in digital form, and we used total 178-MHz flux densities from Laing et al. (1983), corrected to the Baars et al. (1977) flux scale, and total source size from published maps to estimate an average minimum pressure. Where the published maps were not good enough to give us an estimate of the width of the source we assumed an axial ratio (ratio of total length to total width) of 4.5.
| Source | Livetime | used | |||||
|---|---|---|---|---|---|---|---|
| (s) | (keV) | (arcsec) | (arcsec) | (Pa) | (Pa) | ||
| 3C 98 | 0.0306 | 41047 (H) | 1.0 | 14 | 160 | ||
| 3C 123 | 0.2177 | 28801 (H) | 3.6 | 7 | 18 | ||
| 3C 215 | 0.411 | 86442 (H) | 4.0 | 0 | 25 | ||
| 3C 219 | 0.1744 | 4206 (P) | 1.0 | 0 | 92 | ||
| 3C 220.1 | 0.61 | 36226 (H) | 5.6 | 6 | 18 | ||
| 3C 254 | 0.734 | 15570 (P) | 7.7 | 0 | 10 | ||
| 3C 275.1 | 0.557 | 25158 (H) | 4.8 | 0 | 12 | ||
| 3C 280 | 0.996 | 46619 (P) | 5.0 | 0 | 12 | ||
| 3C 295 | 0.4614 | 29292 (H) | 4.4 | 0 | 2 | ||
| 3C 334 | 0.555 | 27909 (H) | 5.4 | 13 | 34 | ||
| 3C 346 | 0.162 | 16981 (P) | 1.9 | 0 | 10 | ||
| 3C 388 | 0.0908 | 52674 (H) | 3.1 | 0 | 28 | ||
| 3C 405 | 0.0565 | 9127 (P) | 7.3 | 0 | 70 |
Redshifts are taken from Laing et al. (1983). An H in column 3 indicates that the data come from the ROSAT HRI; a P indicates the PSPC. Pressures are calculated at the radii and , which correspond to the (projected) minimum and maximum radii sampled by the radio lobes. Errors on the pressures are computed as described in the text. Temperatures are estimated from the temperature-luminosity relation or set to 1 keV (see the text) except for those sources where temperature measurements exist: these are 3C 220.1 (Ota et al. 2000), 3C 295 (Harris et al. 2000), 3C 346 (Worrall & Birkinshaw, 2000b) and 3C 405 (Ueno et al. 1994).
| Source | Lobe | Flux | Freq. | Length | Width | Ref. | |||
|---|---|---|---|---|---|---|---|---|---|
| (Jy) | (GHz) | (arcsec) | (arcsec) | (Pa) | (Pa) | ||||
| 3C 13 | Whole | 13.08 | 0.178 | 25 | – | 1.351 | 1 | ||
| 3C 20* | E | 5.2 | 1.41 | 29 | 26 | 0.174 | 2,3 | ||
| 3C 33 | N (part) | 0.72 | 1.4 | 68 | 101 | 0.0595 | 4 | ||
| 3C 33.1 | E | 1.69 | 1.53 | 88 | 60 | 0.181 | 5 | ||
| 3C 47* | N | 1.26 | 1.65 | 27 | 20 | 0.425 | 6,7 | ||
| 3C 61.1 | S (part) | 1.24 | 1.48 | 35 | 50 | 0.186 | 4 | ||
| 3C 67 | N | 0.79 | 1.67 | 1.7 | 1.0 | 0.3102 | 8 | ||
| 3C 79* | E (part) | 1.20 | 1.45 | 36 | 14 | 0.2559 | 9,3 | ||
| 3C 171* | E | 1.75 | 1.44 | 20 | 7.4 | 0.2384 | 2,3 | ||
| 3C 181 | Whole | 15.81 | 0.178 | 6.7 | 1.3 | 1.382 | 10 | ||
| 3C 192* | E | 2.7 | 1.41 | 89 | 55 | 0.0598 | 11,12 | ||
| 3C 196 | N | 0.52 | 14.96 | 4.9 | 2.3 | 0.871 | 2,13 | ||
| 3C 204 | E | 0.122 | 4.9 | 7.3 | 2.7 | 1.112 | 7 | ||
| 3C 207 | Whole | 14.82 | 0.178 | 18 | 12 | 0.684 | 14 | ||
| 3C 208 | E | 0.400 | 4.9 | 5.5 | 2 | 1.109 | 7 | ||
| 3C 212 | Whole | 16.46 | 0.178 | 11 | – | 1.049 | 15 | ||
| 3C 220.3 | Whole | 17.11 | 0.178 | 11 | 4 | 0.685 | 16 | ||
| 3C 223 | S | 1.53 | 1.50 | 145 | 55 | 0.1368 | 4 | ||
| 4C 73.08 | E | 4.56 | 0.61 | 410 | 298 | 0.0581 | 5 | ||
| 3C 236 | N | 1.95 | 0.61 | 781 | 229 | 0.0989 | 17 | ||
| 3C 241 | Whole | 12.64 | 0.178 | 0.9 | – | 1.617 | 18 | ||
| 3C 245 | E | 0.134 | 4.89 | 2.9 | 1.9 | 1.029 | 19 | ||
| 3C 247* | S | 1.76 | 1.46 | 8.6 | 3.5 | 0.7489 | 19 | ||
| 3C 249.1 | W | 1.45 | 1.42 | 15 | 11 | 0.311 | 5 | ||
| 3C 263 | E | 0.739 | 4.9 | 12 | 8 | 0.6563 | 7 | ||
| 3C 263.1 | N | 0.326 | 4.89 | 3.1 | 1.6 | 0.824 | 19 | ||
| 3C 266 | Whole | 12.19 | 0.178 | 5.4 | 0.8 | 1.2750 | 1 | ||
| 3C 268.3 | S | 0.381 | 4.99 | 0.7 | 0.4 | 0.371 | 20 | ||
| 3C 268.4* | N | 0.386 | 1.47 | 3.0 | 1.6 | 1.400 | 19 | ||
| 3C 270.1* | S | 1.96 | 1.46 | 4 | 2 | 1.519 | 15,19 | ||
| 3C 277.2 | W | 1.54 | 1.41 | 16 | 6.1 | 0.766 | 21,22 | ||
| 3C 284* | W | 0.803 | 1.53 | 105 | 23 | 0.2394 | 23,3 | ||
| 3C 289 | E | 1.43 | 1.46 | 5.5 | 2.7 | 0.9674 | 19 | ||
| 3C 294* | S | 0.478 | 1.46 | 9.5 | 4.2 | 1.78 | 19 | ||
| 3C 299 | E | 2.69 | 1.53 | 2.6 | 0.6 | 0.367 | 5 | ||
| 3C 303 | E | 0.39 | 1.45 | 20 | 18 | 0.141 | 4 | ||
| 3C 318 | Whole | 13.41 | 0.178 | 0.93 | 0.13 | 1.574 | 24 | ||
| 3C 324 | Whole | 17.22 | 0.178 | 9.4 | 2 | 1.2063 | 25 | ||
| 3C 326 | N | 1.85 | 1.40 | 374 | 289 | 0.0895 | 5 | ||
| 3C 325 | Whole | 17.00 | 0.178 | 16.8 | 2.2 | 0.86 | 26 | ||
| 3C 330 | Whole | 30.30 | 0.178 | 63 | – | 0.5490 | 26 | ||
| 3C 343.1 | Whole | 12.54 | 0.178 | 0.4 | 0.12 | 0.750 | 18 | ||
| 3C 351 | S | 0.33 | 1.42 | 27 | 7 | 0.371 | 4 | ||
| 3C 356 | Whole | 12.32 | 0.178 | 76 | 12 | 1.079 | 27 | ||
| 4C 16.49 | Whole | 11.45 | 0.178 | 18 | 2 | 1.296 | 28 | ||
| 3C 368 | Whole | 15.04 | 0.178 | 8.8 | 1.6 | 1.132 | 25 | ||
| 3C 382 | S | 2.22 | 1.45 | 143 | 67 | 0.0578 | 4 | ||
| 3C 390.3 | N (part) | 1.62 | 1.45 | 88 | 71 | 0.0569 | 5 | ||
| 3C 433 | S | 1.83 | 8.47 | 32 | 14 | 0.1016 | 29 | ||
| 3C 455 | Whole | 13.95 | 0.178 | 4.3 | 1.2 | 0.5427 | 14 |
The radial profile and temperature models used are determined by the redshift (see the text). For sources marked with an asterisk we have multi-frequency radio data and have fit a model spectrum to the source, as described in section 2.3. References for radio maps and size measurements are: (1) Best, Longair & Röttgering (1997); (2) Laing (unpublished) (3) Hardcastle et al. (1997); (4) Leahy & Perley (1991); (5) Leahy, Bridle & Strom (1998); (6) Leahy (1996); (7) Bridle et al. (1994); (8) Katz-Stone & Rudnick (1997); (9) Spangler, Myers & Pogge (1984); (10) Mantovani et al. (1994); (11) Laing, published in Baum et al. (1988); (12) Leahy et al. (1997); (13) Brown (1990); (14) Bogers et al. (1994); (15) Akujor et al. (1991); (16) Jenkins, Pooley & Riley (1977); (17) Mack et al. (1997); (18) Fanti et al. (1985); (19) Liu, Pooley & Riley (1992); (20) Lüdke et al. (1998); (21) Alexander & Leahy (1987) (22) Pedelty et al. (1989); (23) Leahy, Pooley & Riley (1986); (24) Spencer et al. (1991); (25) Best et al. (1998); (26) Fernini, Burns & Perley (1997); (27) Fernini et al. (1993); (28) Lonsdale, Barthel & Miley (1993); (29) Black et al. (1992). Maps of objects were mostly obtained from Leahy et al. (1998). Redshifts are taken from Laing et al. (1983) except for that of 3C 318, which is taken from Willott, Rawlings & Jarvis (1999).
| Source | Lobe | Flux | Freq. | Length | Width | ||
|---|---|---|---|---|---|---|---|
| (Jy) | (GHz) | (arcsec) | (arcsec) | (Pa) | |||
| 3C 98 | S | 1.42 | 8.35 | 145 | 60 | ||
| 3C 123* | N | 11.3 | 1.43 | 14 | 5 | ||
| 3C 215* | N | 0.203 | 4.84 | 25 | 18 | ||
| 3C 219* | S | 3.70 | 1.52 | 92 | 46 | ||
| 3C 220.1 | W | 1.20 | 1.40 | 12 | 7 | ||
| 3C 254 | W | 1.08 | 1.40 | 10 | 4 | ||
| 3C 275.1 | N | 0.205 | 8.46 | 12 | 6 | ||
| 3C 280 | W | 0.448 | 14.96 | 11 | 6 | ||
| 3C 295* | N | 1.48 | 8.56 | 2.3 | 1.2 | ||
| 3C 334* | N | 0.276 | 4.84 | 26 | 13 | ||
| 3C 346 | S | 1.19 | 1.53 | 7 | 9 | ||
| 3C 388 | N | 2.93 | 1.39 | 28 | 18 | ||
| 3C 405* | S | 205.6 | 4.53 | 48 | 25 |
Sources of radio maps and size/flux measurements are as follows: 3C 98, Leahy et al. (1997); 3C 123, Laing (unpublished) and Hardcastle et al. (1997); 3C 215, Bridle et al. (1994); 3C 219, Clarke et al. (1992); 3C220.1, Harvanek & Hardcastle (1998) and Burns et al. (1984); 3C 254, Liu et al. (1992) and FIRST survey data; 3C 275.1, Gilbert et al. (in prep.); 3C 280, Laing (unpublished) and Liu et al. (1992); 3C 295, Perley & Taylor (1991) and Cotton (unpublished); 3C 334, Bridle et al. (1994); 3C 346, Leahy, Bridle & Strom (1998); 3C 388, Roettiger et al. (1994); 3C 405, Carilli et al. (1991). Electronic images for objects were mostly obtained from Leahy et al. (1998). For sources marked with an asterisk we have multi-frequency radio data and have fit a model spectrum to the source, as described in section 2.3. The minimum-energy fit to 3C 123’s N lobe is taken from Looney & Hardcastle (2000).
3 Why do radio sources appear underpressured?
Tables 1, 2 and 3 and Fig. 1 show that, with very few exceptions, the minimum pressures of the radio lobes are well below the measured pressures or upper limits on pressure in the central part of the hot-gas component of the environment. In the majority of the detected sources in Tables 1 and 3 the cluster pressure is higher than the lobe pressure even at the far ends of the sources, where the cluster pressure is lowest.
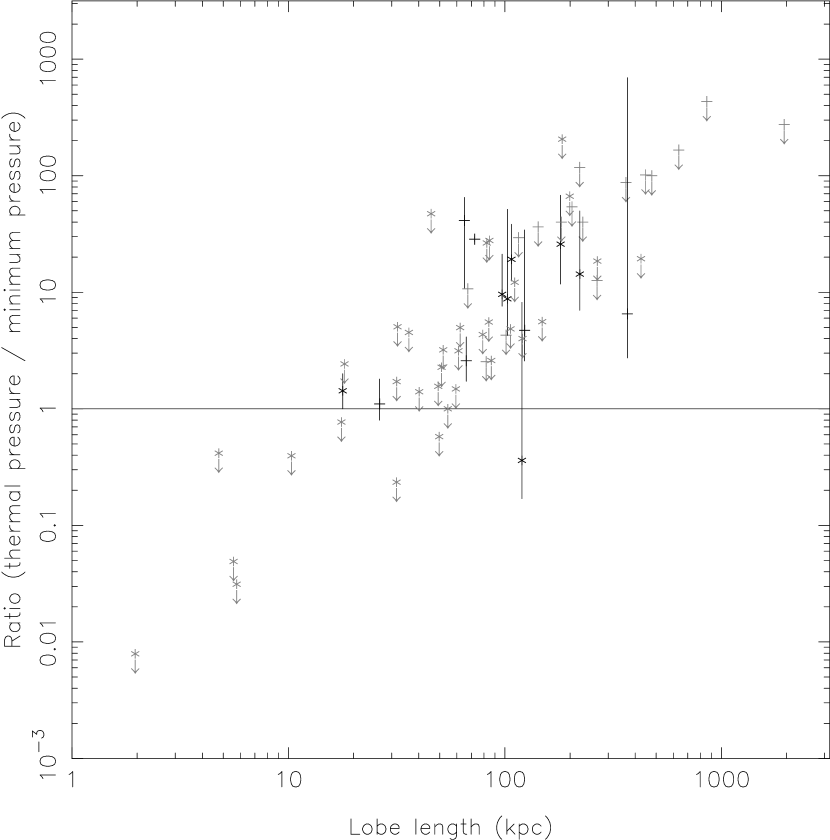
As shown in Fig. 2, the few sources with minimum pressures higher than the limits on their central thermal pressures are all small objects, with lobe lengths less than the (assumed) core radii. This seems to be mainly because of a strong anticorrelation between minimum pressure and source size; sources which are small ( kpc) and luminous enough to be in the 3CRR catalogue naturally have very high minimum pressures. This overpressuring with respect to the external medium is what we would expect to find if the small sources are young, a point we return to briefly in section 4. In this section we shall concentrate on the more typical sources with linear sizes kpc.
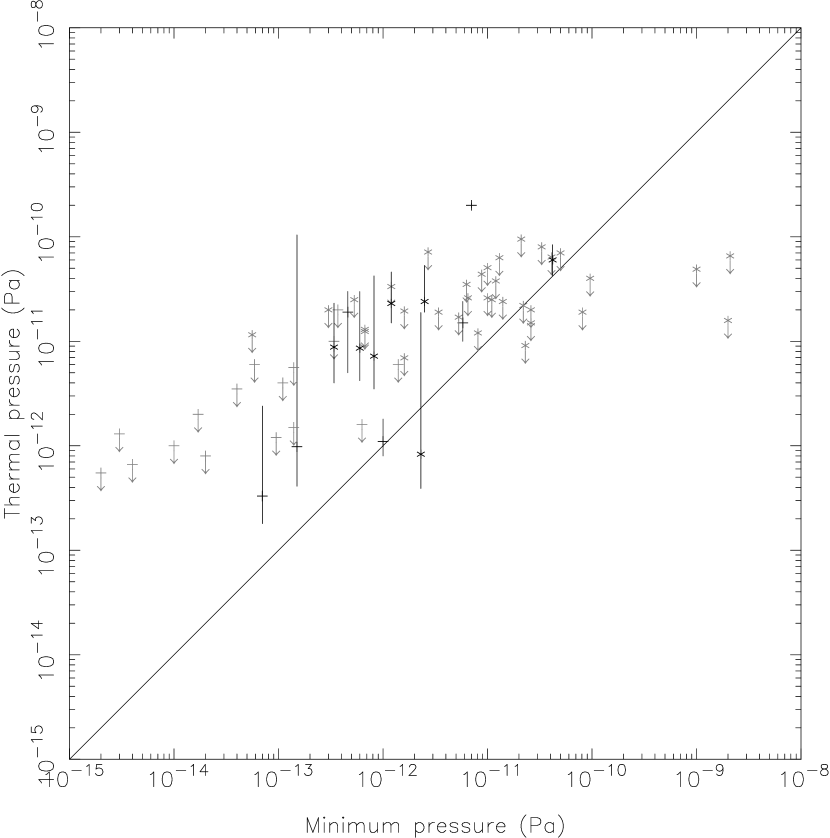
There are several reasons why the true radio-lobe pressure may be closer to the thermal pressure than implied by Fig. 1. In this section of the paper we consider them in turn. Our choice of determines the index that appears in many of the approximate relations we quote (see equation 1).
3.1 X-ray uncertainties
The thermal pressures depend directly on the X-ray emission. The accuracy of our pressure estimates thus depends on the quality of our data, and in particular on whether the source has spatially resolved, modelled structure, whether it is detected, and whether it is dominated by a non-thermal point source, as follows.
- •
-
•
Detected sources with too few counts to model. 14 of the upper limits on pressure are based on X-ray detections which had too few counts to allow modelling of the sources’ spatial structure. These are upper limits only in the sense that there is an unknown contribution from non-thermal emission. All of these sources (except 3C 236) have weak radio cores, so that from the observed correlation between radio and X-ray nuclear emission (paper I) we would not expect a strong contribution to the X-ray emission from the active nucleus; the detected X-ray emission will come almost entirely from hot gas. The estimated limits on pressure should then be very close to the true values for these sources.
-
•
Non-detections. The majority of the 16 non-detected sources have short or off-axis observations. Since we are aware of no bias in the ROSAT observations in the sense that more sensitive observations were made for sources with suspected richer cluster environments, the non-detections are consistent with having been drawn from the same population as the detections. It is nevertheless possible that the true values for the thermal pressures in these sources lie a long way below our limits.
-
•
Detections with dominant point source. Our ability to detect atmospheres in these 20 sources is limited by the strength of the central component (and by uncertainties in the HRI PSF) rather than by sensitivity. Obviously here, as for the non-detections, we cannot rule out the possibility that in some or all cases the true pressures lie a long way below the upper limits.
3.2 Cosmology
Our choice of cosmology does not significantly affect the relationship between radio and thermal pressures. If the Hubble parameter is km s-1 Mpc-1, then the minimum pressure in the radio lobes goes approximately as (equation 1), while the thermal pressure goes as for a detected X-ray environment whose angular scale we know; no sensible change in can eliminate the pressure differences. For upper limits, we have chosen a fixed linear size, and so it might seem that the estimated upper limit on thermal pressure is independent of . However, since the linear size we choose is taken from observations on the assumption of , the upper limits on thermal pressure go as in this case too.
3.3 Effects of projection
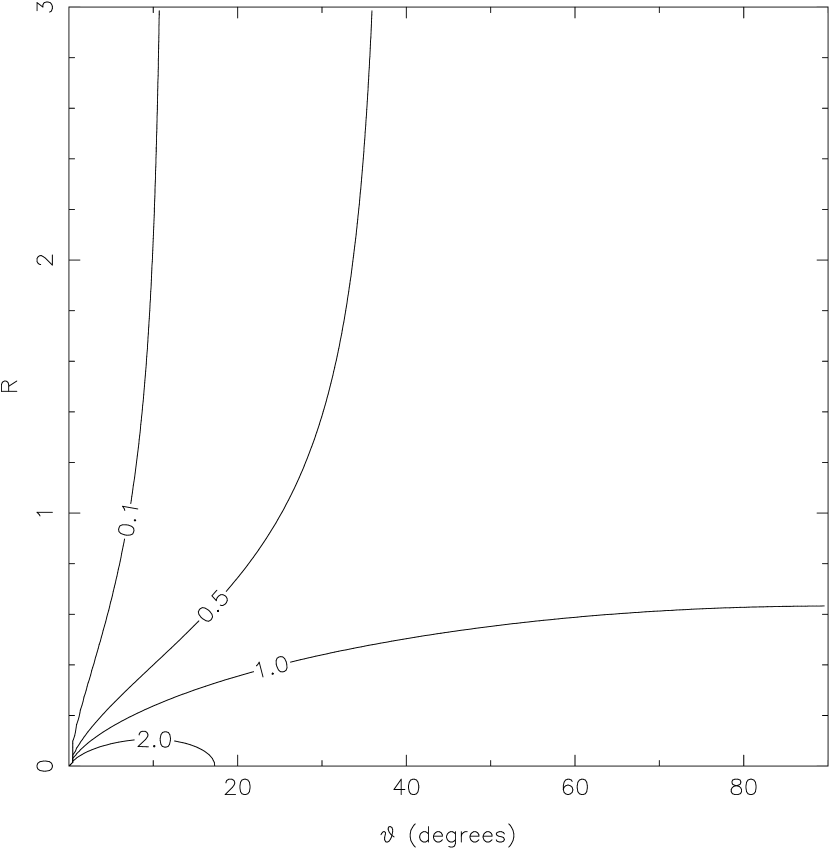
Projection affects the ratio of radio to thermal pressure according to the approximate relation
where and are the originally inferred thermal and radio pressures, is the angle of the radio structure to the line of sight and is the ratio between the apparent (projected) distance along the radio galaxy and the core radius of the cluster (Birkinshaw & Worrall 1993). Depending on the values of and , projection can either decrease or increase the pressure ratio. Fig. 3 shows contours of values of this relation as a function of and . It will be seen that for small the assumption of no projection causes us to underestimate the ratio of thermal to minimum pressure (). This may be important, for example, in the case of 3C 346, which appears to have similar X-ray and radio pressures, but whose radio structure (prominent core, bright one-sided jet, small linear size) is suggestive of projection effects, and which lies in a cluster with a large core radius, so that is small even at the end of the source (see also Worrall & Birkinshaw 2000b). It may also be important for some of the small sources in Table 2 whose inferred minimum lobe pressures are close to or exceed the upper limits on central pressure. For most sources in our sample is zero for the inner pressure measurement, and therefore projection can only cause the corrected minimum pressure to be smaller than the estimated minimum pressure. For larger and small Fig. 3 shows that we overestimate the ratio of thermal pressure to minimum pressure, but this effect only becomes large () for very small angles to the line of sight (); few, if any, of the observed sources are likely to be this strongly projected. Therefore it is unlikely that projection alone can be responsible for the discrepancy between radio and thermal pressures.
3.4 Radio-related contributions to the X-ray emission
We have assumed that all the extended X-ray emission in the detected sources can be attributed to the hot intra-cluster medium. Brunetti, Setti & Comastri (1997) argue that there may be a significant contribution to the extended X-ray emission of radio sources from inverse-Compton scattering of the IR–optical photons from a central quasar by the low-energy electron population in the radio lobes. In addition, there is necessarily inverse-Compton emission from scattering of cosmic microwave-background (CMB) photons. If these processes are important in our objects, then they will cause us to overestimate the thermal pressures in the cluster environment. For some well-studied, low-redshift objects in our sample, it is clear from the observations that the X-ray emission is dominated by cluster emission, since it is approximately radially symmetrical and extends further than the radio lobes. This is true, for example, of 3C 123, 3C 295, 3C 346, 3C 388 and 3C 405 in Table 1. For the distant object 3C 220.1, the ASCA observations of Ota et al. (2000), in which an iron line is detected, seem to confirm the conclusion of Hardcastle, Lawrence & Worrall (1998) that the extended emission is cluster-related. On the other hand, Brunetti et al. (1999) suggest in the case of 3C 219 that a large fraction of the extended emission in an HRI image is inverse-Compton in origin, which, if true, would mean that the pressures we estimate for the thermal emission in this source are too high by up to an order of magnitude. For the other sources, most of which are at high redshift, the spatial resolution and sensitivity of existing X-ray data is inadequate to distinguish between the two models, and we must await planned Chandra observations. But on the balance of the evidence so far, and given the optical evidence pointing to the existence of clusters around high-redshift objects, we feel justified in our assumption that the extended emission is dominated by a thermal intra-cluster component.
3.5 Temperature assumptions
In many cases, including all the upper limits, we have no adequate measurement of the temperature of the hot X-ray emitting gas. The estimates for about half the detected sources are based on the temperature-luminosity relationship of David et al. (1993), which appears to hold out to redshifts or even greater (Mushotzky & Scharf 1997, Donahue et al. 1998), comparable with the highest redshifts where we have been able to separate nuclear and extended emission. There is a good deal of scatter in the temperature-luminosity relation and so these results are uncertain by perhaps a factor of 2. As shown in Figure 4, inferred pressure is approximately linearly dependent on assumed temperature for keV, and so to account for the discrepancy between thermal and minimum radio pressures the estimated temperatures would need to be systematically high by a factor 5–10, which seems unlikely.
Some of the sources we have considered may well contain cooling flows, so that the whole idea of a uniform ‘cluster temperature’ may be misleading. In general, cooling flows will only affect the innermost regions of the cluster and are not relevant on scales comparable to the linear size of the radio source, but they may cause us to overestimate central cluster pressures; for example, the pressure in the central bin of the deprojection analysis by Reynolds & Fabian (1996) of the cooling flow in the Cygnus A cluster is a factor 3 lower than the central pressure quoted in Table 3 (though still much higher than the minimum pressure in the lobes) while the pressure at 70 arcsec from the core is similar to our value. More observations are required to measure the influence of possible cooling flows in the cluster environments of these sources.

3.6 Electron spectrum assumptions
In calculating minimum energies we have assumed a fixed value () for the power-law index of the electron energy distribution at low energies, corresponding to a low-frequency spectral index (the ‘injection index’) of 0.5 (). This should be realistic if the electrons in the lobes were accelerated at non-relativistic strong shocks. The energy density in electrons, and therefore the radio-related pressure, depends strongly on our choice of (equation 1). For sources which are described by a simple power law (i.e. with no spectral break) we obtain minimum pressures which are a factor – higher for and – higher for (the exact value depends on the frequency of flux measurement). If we were to adopt for all sources we would obtain minimum pressures close to or exceeding the thermal values in many cases. However, such a high value of is inconsistent with particle acceleration models and with observations of the low-energy spectral indices of radio sources, where is generally significantly less than 1.
At frequencies GHz, corresponding to the majority of the radio observations we have used, is typically greater than 0.5 in the lobes. The steeper spectral index is conventionally attributed to spectral ageing effects. Where possible we have made a rough correction for these steeper values of by using more than one frequency and fitting a high-energy break in the electron spectrum. (Sources where this has been done are marked with an asterisk in Tables 2 and 3.) For sources with insufficient spectral information we have neglected spectral ageing, and so our synchrotron flux may underestimate the normalization of the low-energy electron spectrum, causing us to underestimate the minimum pressure. However, the underestimation is at most a factor 2 in a typical source.
We discuss the effects of varying the low-energy cutoff of the electron spectrum in section 3.9.
3.7 The minimum energy/equipartition assumption
There is little strong justification for the assumption that the radio lobes are near to their minimum pressures, or, roughly equivalently, that there is equal energy density in radiating electrons and magnetic fields. To provide an order of magnitude increase in radio pressure the magnetic field strength in a typical object must be roughly three times greater than, or five times less than the minimum-energy value.
Observations of inverse-Compton emission in the X-ray have suggested in a few well-studied cases that the field strengths are at or close to equipartition with the radio-emitting electrons, both in the lobes (e.g. Feigelson et al. 1995, Tsakiris et al. 1996) and hotspots (3C 405, Harris, Carilli & Perley 1994; 3C 295, Harris et al. 2000; 3C 123, Hardcastle et al. in prep.) of radio galaxies. Field strengths much lower than the equipartition value would give rise to substantial inverse-Compton X-ray emission from the lobes in many sources, but there are few detections to date. Having said this, there are several sources (e.g. 3C 120, Harris et al. 1999; Pictor A, Röser & Meisenheimer 1987) with X-ray hotspots which are too bright to be consistent either with an X-ray synchrotron model (without invoking a separate population of electrons) or with inverse-Compton emission at equipartition, which may be evidence that field strengths are far below equipartition in the hotspots of some sources. The X-ray jet in the quasar PKS 0637-752 is a particularly dramatic case of radio-related X-ray emission which cannot easily be explained using the equipartition assumption (Chartas et al. 2000).
3.8 Filling factors
If the synchrotron-emitting plasma has a volume filling factor less than unity, then synchrotron volume emissivities are underestimated, and the corresponding minimum pressures and energy densities in the plasma increase by a factor (equation 1). But the dynamically interesting quantity is the energy density averaged over the volume of the lobe, which is proportional to , so a filling factor cannot on its own account for the discrepancy between internal and external pressures. If we assume (as is often implicitly done in discussions of low filling factor) that a non-radiating ‘fluid’ with an energy density roughly equal to fills the gaps between emitting regions, then the total energy density increases as , and filling factors of are required to make the lobe pressures similar to the pressures in the X-ray-emitting gas.
For a given synchrotron flux level, the observed X-ray flux from inverse-Compton scattering of CMB photons is proportional to the mean number density of electrons of appropriate energies in the lobes, which is proportional to , so lower filling factors would mean lower inverse-Compton fluxes from the lobes. But if the space-filling ‘fluid’ is relativistic electrons, so that we have a uniform electron population with strong field-strength variations, the CMB inverse-Compton flux from the lobes should vary as , since the number density of electrons outside the emitting regions is roughly the same as that inside the emitting regions. On the other hand, the flux from synchrotron-self-Compton emission (e.g. from hotspots) is dependent on the number density of electrons in the emitting regions, which is proportional to , so that we would in general expect higher X-ray fluxes from synchroton-self-Compton emission if the filling factor were low, although the actual flux is strongly influenced by the geometry of the emitting region, which affects the number density of photons available for scattering. If the space-filling fluid is electrons, the geometry dependence of this process is weaker.
For throughout the source, we would thus expect X-ray emission from inverse-Compton scattering of CMB photons in the lobes to be roughly a factor of 5 less than, or a factor of 10 greater than the equipartition predictions, while synchrotron-self-Compton emission from hotspots should be higher than predicted by a factor of 10; although there are few existing observations, the data (section 3.7) suggest that the filling factor is not this low. But because the dependences on are so weak, we cannot rule out a contribution from low filling factors to the pressure discrepancy.
3.9 Non-radiating particles
A large contribution to the energy density in the lobes may be made by protons and other particles, such as low-energy electrons, which do not emit synchrotron radiation in observable wavebands. Firstly, the lobes may contain thermal protons. The lack of internal Faraday depolarization of radio lobes places some limits on the internal thermal particle content given simple models for the magnetic field structure (e.g. Dreher et al. 1987), but large amounts of thermal material can be hidden by field reversals (Laing 1984) so these limits are not generally very useful. In FRI radio galaxies there is almost certainly some contribution to the energy density from thermal protons entrained by the trans-sonic jets, but this cannot account for the whole of the pressure discrepancy even in those objects, because some well-studied sources (e.g. Böhringer et al. 1993; Hardcastle, Worrall & Birkinshaw 1998) show X-ray deficits in the lobes which would not be observed if a large amount of thermal gas at a temperature comparable to that of the external medium was present in them. (Cooler gas could be present but proportionally higher densities would be needed to provide a useful contribution to the internal pressure; it is hard to see where very hot thermal protons would come from, as there is no obvious efficient heating process.) Deficits of X-ray emission associated with the lobes are also reported in the FRII Cygnus A (Carilli, Perley & Harris 1994), which suggests that thermal material cannot account for the pressure discrepancy in this source either. In any case, the supersonic jets of FRIIs have less opportunity to entrain thermal material, though they may pick up some mass from stellar winds as they pass through the galaxy (Bowman, Leahy & Komissarov 1996).
Alternatively, FRII jets may be electron-proton from the start, with relativistic protons providing the additional pressure required. From equation 1, the minimum pressure is proportional to , where is the ratio between the numbers of non-emitting and synchrotron-emitting particles and the two populations of particles are assumed to have the same energy distribution. Values of are thus required to increase the pressure by a factor 10. However, equation 1 applies for equal energy densities in particles and magnetic field. If (as the measurements of inverse-Compton emission would indicate) the equality is between magnetic field energy density and energy density in radiating particles only, the energy density in relativistic protons need only be times that in electrons or magnetic field to bring the lobes back into pressure balance with the external medium. As discussed by Leahy & Gizani (1999), this still has a large effect on the energy requirements for the source. Arguments for a proton-dominated jet are presented by e.g. Celotti & Fabian (1993).
Finally, it is possible to hide some energy density in electrons and positrons with low energies (Lorentz factors ) which, for magnetic field strengths around equipartition, do not radiate in observable wavebands in the lobes. For our standard low-energy electron energy index of 2, extending our assumed low-energy cutoff of down to does not help a great deal, increasing the equipartition energy density by only per cent; the effects would be greater (equation 1) if the energy index were steeper. But if there is a large sub-relativistic population of particles which do not follow the power-law distribution in energy, it is possible to make a substantial difference to the energy density. It has been argued that is required in the bases of AGN jets to reproduce the observed levels of synchrotron self-Compton emission (Ghisellini et al. 1992), though this argument is somewhat sensitive to the details of energy transport close to the nucleus. If in the jets then we do not expect to see a substantial population of electrons in the lobes (the timescales for synchrotron/IC loss seem too long for these processes to produce a significant low- population of electrons). If Wardle et al. (1998) are correct, however, low-energy () electrons are required to provide the Faraday conversion giving rise to circular polarization in the radio jets of quasars, and so there is some scope remaining for accounting for some of the missing pressure in this way.
4 Consequences for models
FRII radio sources cannot be underpressured with respect to the external medium for the whole of their length, as the minimum pressures would suggest, or we would not observe lobes at all. The data force us, like Leahy & Gizani (1999), to the conclusion that there is some additional contribution to the internal pressure in at least some, and maybe all FRIIs. The most likely candidates, from the discussion above, are internal protons, magnetic field strengths a factor of a few away from the minimum-energy values, or low filling factors. All of these require coincidences to explain the similarity of the magnetic field strengths derived from observations of inverse-Compton emission to the minimum-energy values in a few sources, but are otherwise consistent with observation. As yet there are few measurements of inverse-Compton emission from the lobes of powerful FRIIs due to the difficulty of detecting low-surface-brightness extended X-ray features and distinguishing them from the X-ray-emitting atmospheres; but see Tsakiris et al. (1996) for observations of a few low- giant objects which suggest field strengths close to, but slightly below, the equipartition value with no proton contribution. If further observations confirm that field strengths are normally close to the levels predicted by equipartition arguments, then the internal-proton model seems the best contender, since it can most easily accommodate such a result.
However, our observations provide no support for the common assumption that radio sources are highly overpressured over their whole length with respect to the external medium, as in model A of Scheuer (1974). To produce highly overpressured sources, with supersonic lateral expansion, we would need a still larger contribution from protons, low filling factors or non-equipartition field strengths in the lobes. The X-ray data do not rule out a model for radio-source dynamics more similar to Scheuer’s model C, in which the sources have lobe pressures comparable to the external pressure in the X-ray atmosphere, at least by the time they reach linear sizes of hundreds of kpc. Indeed, from the point of view of the power that is required to be transported by the jet, such a model is the most parsimonious we can construct.
This has implications for the self-similar models described by Kaiser & Alexander (1997, hereafter KA), which require radio sources to be described by model A. In these models (and indeed in any realistic model of a radio source) the lobe pressure decreases as a function of time or source length. So it is quite possible for a source to start off highly overpressured (as it seems the small sources discussed in section 3 must be), and later to come into equilibrium with the external medium. From equations 31 and 34 of KA, it can be seen that for a source of constant jet power there is an approximately linear decrease in lobe pressure with source length given some simple assumptions about the external atmosphere111Williams (1991) derives a stronger but qualitatively similar dependence on source length on the assumption of a uniform external medium.. As discussed in section 1, because the pressure in the external medium decreases with distance from the cluster centre, which is in general coincident with the central nucleus of the radio source, while the pressure in the lobes is constant at a given moment along the source length because of the high internal sound speed, a source can be underpressured in its inner regions while being overpressured (and continuing to expand transversely) further from the nucleus. The inner parts of the lobes will be crushed by the external thermal medium on a timescale given by the sound crossing time in the medium, which is typically of the order years (comparable to the lifetime of the radio source). The result will therefore be a slow contraction of the inner lobe [the ‘cocoon crushing’ of Williams (1991)] eventually removing the radio-emitting plasma altogether from the central regions of the source. Although not fatal to the source, the contraction of its inner regions will involve a departure from self-similarity.
There may be some evidence for this process in the tapered and sometimes absent inner lobes seen in some FRII sources (although this may to some extent just be a result of spectral ageing), and the compact appearance of high-redshift, luminous radio sources (Jenkins & McEllin 1977) may be a result of their rich cluster environments. Hardcastle (1999) speculated that cocoon crushing might even account for the appearance of wide-angle-tail radio sources in clusters. Observations suggesting that axial ratio is independent of length may be failing to take account of the variation of width along the source, and studies of large samples of sources do show a weak correlation of axial ratio with length (Black 1992), subject to the same caveat about the effects of spectral ageing. So it seems that both the X-ray and radio data suggest the possibility of a breakdown of self-similar expansion, at least in older sources.
To make this argument quantitative, we have applied the KA model to some of the sources in Tables 1 and 2. Our X-ray data provide the necessary information on the cluster density as a function of radius; together with the jet power and the source lengths and axial ratios (measured from radio maps) they allow us to calculate the expected internal pressures in the lobes. If we use the widely adopted values of jet power calculated by Rawlings & Saunders (1991), which are based on minimum-energy assumptions, we compute expected lobe pressures which are in good agreement with the minimum pressures we have derived for the sources in all cases where the approximations we use (chiefly those involved in mapping our -models onto KA’s simplified density profiles) are applicable. But the computed pressures, like the minimum pressures, lie well below the external thermal pressure, whereas in the KA model the internal pressure must always be above the external pressure. The KA model thus cannot consistently describe these radio sources if the jet powers are as low as those estimated by Rawlings & Saunders, unless the estimated cluster temperatures are much too high; equivalently, we could say that the KA model together with minimum energy assumptions ‘predicts’ cluster temperatures of order 0.1 keV, much lower than observed. In the KA model, the internal pressure scales as for a radio source of fixed length in a fixed environment, so we need large increases in , by 2–3 orders of magnitude, to produce sources which will be overpressured at the cluster centre when the jet length is hundreds of kpc, as the KA model requires for self-similarity. A smaller increase in will produce sources which at large jet lengths are susceptible to the cocoon-crushing process described above, and so which deviate from the self-similar model.
5 Conclusions
We have examined the ROSAT observations for all 3CRR FRIIs for which pointed data exist, and estimated thermal pressures in their X-ray emitting atmospheres. Although many of our estimates of thermal pressure are limits, our data strongly suggest that many, and maybe most, FRIIs with linear sizes kpc have lobe minimum pressures which lie below the external thermal pressure. FRIIs are thus probably similar to the better-studied population of FRIs. Since it is not physically possible for lobes to be so strongly underpressured, the implication is that one or more of the standard minimum-energy assumptions is wrong. The most obvious way of solving this problem is to have a dominant contribution to the energy density in the lobes from non-radiating particles such as protons, though we cannot rule out other possibilities, such as a low volume filling factor for the radio-emitting plasma. It is then a ‘coincidence’ that a few studies have found magnetic field energy densities in lobes and hotspots close to the energy density in electrons. Further observations with XMM and Chandra, which should allow the routine detection of inverse-Compton emission from the lobes and hotspots of radio sources, will allow these possibilities to be tested in more detail.
The transverse expansion of FRII sources will remain supersonic over their expected lifetimes, as in model A of Scheuer (1974), and therefore self-similar, as in the models of KA, only if the internal pressures (and consequently the power supplied by the jet, ) are typically several orders of magnitude above the minimum values. In more parsimonious models, with values of only an order of magnitude above the minimum-energy values quoted by Rawlings & Saunders (1991), the expansion of sources can initially be self-similar but there will be departures from self-similarity for large objects. Without an independent way of estimating the proton content of lobes we have no way of knowing which of these situations really obtains, but purely on energy budget grounds we feel that modellers should be reluctant to rule out the low- scenario. At least for large sources, model C of Scheuer (1974) may be the right one to use after all.
Acknowledgements
We are grateful to Christian Kaiser for helpful comments on an early draft of this paper, to Mark Birkinshaw for comments on a later version, and to Guy Pooley and George Gilbert for providing electronic radio maps of high- radio galaxies. We thank an anonymous referee for comments which enabled us to improve the paper. This work was supported by PPARC grant GR/K98582, and made use of NASA’s Astrophysics Data System Abstract Service.
References
- [] Akujor C.E., Ludke E., Browne I.W.A., Leahy J.P., Garrington S.T., Jackson N., Thomasson P., 1994, A&AS, 105, 247
- [] Alexander P., Leahy J.P., 1987, MNRAS, 224, 1
- [] Arnaud K.A., Fabian A.C., Eales S.A., Jones C., Forman W., 1984, MNRAS, 211, 981
- [] Baars J.W.M., Genzel R., Pauliny-Toth I.I.K., Witzel A., 1977, A&A, 61, 99
- [] Baum S.A., Heckman T., Bridle A., van Breugel W., Miley G., 1988, ApJS, 68, 643
- [] Best P.N., Carilli C.L., Garrington S.T., Longair M.S., Röttgering H.J.A., 1998, MNRAS, 299, 357
- [] Best P.N., Longair M.S., Röttgering H.J.A., 1997, MNRAS, 292, 758
- [] Birkinshaw M., Worrall D.M., 1993, ApJ, 412, 568
- [] Black A.R.S., 1992, PhD thesis, University of Cambridge
- [] Black A.R.S., Baum S.A., Leahy J.P., Perley R.A., Riley J.M., Scheuer P.A.G., 1992, MNRAS, 256, 186
- [] Böhringer H., Voges W., Fabian A.C., Edge A.C., Neumann D.M., 1993, MNRAS, 264, L25
- [] Bogers W.J., Hes R., Barthel P.D., Zensus J.A., 1994, A&AS, 105, 91
- [] Bowman M., Leahy J.P., Komissarov S.S., 1996, MNRAS, 279, 899
- [] Bridle A.H., Hough D.H., Lonsdale C.J., Burns J.O., Laing R.A., 1994, AJ, 108, 766
- [] Brown R.L., 1990, in Zensus J.A., Pearson T.J., eds, Parsec-scale Radio Jets, Cambridge University Press, Cambridge, p. 199
- [] Brunetti G., Setti G., Comastri A., 1997, A&A, 325, 898
- [] Brunetti G., Comastri A., Setti G., Feretti L., 1999, A&A, 342, 57
- [] Burns J.O., Basart J.P., de Young D.S., Ghiglia D.C., 1984, ApJ, 283, 515
- [] Canosa C.M., Worrall D.M., Hardcastle M.J., Birkinshaw M., 1999, MNRAS, 310, 30
- [] Carilli C.L., Perley R.A., Dreher J.R., Leahy J.P., 1991, ApJ, 383, 554
- [] Carilli C.L., Perley R.A., Harris D.E., 1994, MNRAS, 270, 173
- [] Celotti A., Fabian A.C., 1993, MNRAS, 264, 228
- [] Chartas G., Worrall D.M., Birkinshaw M., Cresitello-Dittmar M., Cui W., Ghosh K.K., Harris D.E., Hooper E.J., Jauncey D.L., Kim D.-.W., Lovell J., Marshall H.L., Mathur S., Schwartz D.A., Tingay S.J., Virani S.N., Wilkes B.J., 2000, ApJ, in press,
- [] Clarke D.A., Bridle A.H., Burns J.O., Perley R.A., Norman M.L., 1992, ApJ, 385, 173
- [] David L.P., Slyz A., Jones C., Forman W., Vrtilek S.D., 1993, ApJ, 412, 479
- [] Donahue M., Voit G.M., Gioia I., Luppino G., Hughes J.P., Stocke J.T., 1998, ApJ, 502, 550
- [] Dreher J.W., Carilli C.L., Perley R.A., 1987, ApJ, 316, 611
- [] Fanaroff B.L., Riley J.M., 1974, MNRAS, 167, 31P
- [] Fanti C., Fanti C., Parma P., Schilizzi R.T., van Breugel W.J.M., 1985, A&A, 143, 292
- [] Feigelson E.D., Laurent-Muehleisen S.A., Kollgaard R.I., Fomalont E., 1995, ApJ, 449, L149
- [] Feretti L., Spazzoli O., Gioia I.M., Giovannini G., Gregorini L., 1990, A&A, 233, 325
- [] Feretti L., Perola G.C., Fanti R., 1992, A&A, 265, 9
- [] Fernini I., Burns J.O., Perley R.A., 1997, AJ, 114, 2292
- [] Fernini I., Burns J.O., Bridle A.H., Perley R.A., 1993, AJ, 105, 1690
- [] Ghisellini G., Celotti A., George I.M., Fabian A.C., 1992, MNRAS, 258, 776
- [] Hardcastle M.J., 1999, A&A, 349, 381
- [] Hardcastle M.J., Alexander P., Pooley G.G., Riley J.M., 1997, MNRAS, 288, 859
- [] Hardcastle M.J., Lawrence C.R., Worrall D.M., 1998a, ApJ, 504, 743
- [] Hardcastle M.J., Worrall D.M., Birkinshaw M., 1998b, MNRAS, 296, 1098
- [] Hardcastle M.J., Worrall D.M., 1999, MNRAS, 309, 696 [Paper I]
- [] Harris D.E., Carilli C.L., Perley R.A., 1994, Nat, 367, 713
- [] Harris D.E., Leighly K.M., Leahy J.P., 1998, ApJ, 499, L149
- [] Harris D.E., Hjorth J., Sadun A.C., Silverman J.D., Vestergaard M., 1999, ApJ, 518, 213
- [] Harris D.E., Nulsen P.E.J., Ponman T.P., Bautz M., Cameron R.A., Donnelly R.H., Forman W.R., Grego L., Hardcastle M.J., Henry J.P., Jones C., Leahy J.P., Markevitch M., Martel A.R., McNamara B.R., Mazzotta P., Tucker W., Virani S.N., Vrtilek J., 2000, ApJ, 530, L81
- [] Harvanek M., Hardcastle M.J., 1998, ApJS, 119, 25
- [] Jenkins C.J., McEllin M., 1977, MNRAS, 180, 219
- [] Jenkins C.J., Pooley G.G., Riley J.M., 1977, Mem. RAS, 84, 61
- [] Kaiser C.R., Alexander P., 1997, MNRAS, 286, 215 [KA]
- [] Katz-Stone D.M., Rudnick L., 1997, ApJ, 479, 258
- [] Killeen N.E.B., Bicknell G.V., Ekers R.D., 1988, ApJ, 325, 180
- [] Laing R.A., 1984, in Bridle A.H., Eilek J.A., eds, Physics of Energy Transport in Radio Galaxies, NRAO Workshop no. 9, NRAO, Green Bank, West Virginia, p. 90
- [] Laing R.A., Riley J.M., Longair M.S., 1983, MNRAS, 204, 151
- [] Leahy J.P., 1996, Vistas Astr. 40 173
- [] Leahy J.P., Black A.R.S., Dennett-Thorpe J., Hardcastle M.J., Komissarov S., Perley R.A., Riley J.M., Scheuer P.A.G., 1997, MNRAS, 291, 20
- [] Leahy J.P., Bridle A.H., Strom R.G., 1998, Internet WWW page, at URL: http://www.jb.man.ac.uk/atlas/
- [] Leahy J.P., Gizani N.A.B., 1999, To appear in ‘Life Cycles of Radio Galaxies’, ed. J. Biretta et al., New Astronomy Reviews, astro-ph/9909121
- [] Leahy J.P., Perley R.A., 1991, AJ, 102, 527
- [] Leahy J.P., Pooley G.G., Riley J.M., 1986, MNRAS, 222, 753
- [] Liu R., Pooley G.G., Riley J.M., 1992, MNRAS, 257, 545
- [] Lonsdale C.J., Barthel P.D., Miley G.K., 1993, ApJS, 87, 63
- [] Looney L.W., Hardcastle M.J., 2000, ApJ, 534, 172
- [] Lüdke E., Garrington S.T., Spencer R.E., Akujor C.E., Muxlor T.W.B., Sanghera H.S., Fanti C., 1998, MNRAS, 299, 467
- [] Mack K.-.H., Klein U., O’Dea C.P., Willis A.G., 1997, A&AS, 123, 423
- [] Mantovani F., Junor W., Fanti R., Padrielli L., Saikia D.J., 1994, A&A, 292, 59
- [] Miller L., Longair M.S., Fabbiano G., Trinchieri G., Elvis M., 1985, MNRAS, 215, 799
- [] Morganti R., Fanti R., Gioia I.M., Harris D.E., Parma P., de Ruiter H., 1988, A&A, 189, 11
- [] Mushotzky R.F., Scharf C.A., 1997, ApJ, 482, L13
- [] Ota N., Mitsuda K., Hattori M., Mihara T., 2000, ApJ, 530, 172
- [] Pedelty J.A., Rudnick L., McCarthy P.J., Spinrad H., 1989, AJ, 97, 647
- [] Perley R.A., Taylor G.B., 1991, AJ, 101, 1623
- [] Prestage R.M., Peacock J.A., 1988, MNRAS, 230, 131
- [] Röser H.-.J., Meisenheimer K., 1987, ApJ, 314, 70
- [] Rawlings S., Saunders R., 1991, Nat, 349, 138
- [] Reynolds C.S., Fabian A.C., 1996, MNRAS, 278, 479
- [] Roettiger K., Burns J.O., Clarke D.A., Christiansen W.A., 1994, ApJ, 421, L23
- [] Scheuer P.A.G., 1974, MNRAS, 166, 513
- [] Spangler S.R., Myers S.T., Pogge J.J., 1984, AJ, 89, 1478
- [] Spencer R.E., Schilizzi R.T., Fanti C., Fanti R., Parma P., van Breugel W.J.M., Venturi T., Muxlow T.W.B., Rendong N., 1991, MNRAS, 250, 225
- [] Taylor G.B., Perley R.A., Inoue M., Kato T., Tabara H., Aizu K., 1990, ApJ, 360, 41
- [] Tsakiris D., Leahy J.P., Strom R.G., Barber C.R., 1996, in Ekers R.D., Fanti C., Padrielli L., eds, Extragalactic Radio Sources, IAU Symposium 175, Kluwer, Dordrecht, p. 256
- [] Ueno S., Koyama K., Nishida M., Yamauchi S., Ward M.J., 1994, ApJ, 431, L1
- [] Wardle J.F.C., Homan D.C., Ojha R., Roberts D.H., 1998, Nat, 395, 457
- [] Williams A.G., 1991, in Hughes P.A., ed., Beams and Jets in Astrophysics, Cambridge University Press, Cambridge, p. 342
- [] Willott C.J., Rawlings S., Jarvis M.J., 1999, MNRAS, in press, astro-ph/9910422,
- [] Worrall D.M., Birkinshaw M., 1994, ApJ, 427, 134
- [] Worrall D.M., Birkinshaw M., 2000a, ApJ, 530, 719
- [] Worrall D.M., Birkinshaw M., 2000b, in preparation
- [] Worrall D.M., Birkinshaw M., Cameron R.A., 1995, ApJ, 449, 93