Multicolor Observations of a Planetary Transit of HD 209458
Abstract
We present photometric observations of HD 209458 during the transit by its planetary companion on UT 1999 November 15 with the University of Hawaii 0.6m and 2.2m telescopes and the High Altitude Observatory STARE telescope. The detailed shape of the transit curve is predicted to vary with color due primarily to the color-dependent limb-darkening of the star, but potentially due as well to the effect of color-dependent opacity in the planetary atmosphere. We model the light curves and present refined values for the transit timing and orbital period, useful for planning future observations of the planetary transit. We also derive significantly improved measurements of the planetary radius, , stellar radius, , and orbital inclination, . The derived planetary radius favors evolutionary models in which the planet has a low albedo.
1 Introduction
The discovery of transits of the Sun-like star HD 209458 by an orbiting, low-mass companion has definitively established the existence of extrasolar gas-giant planets (Charbonneau et al., 2000; Henry et al., 2000). The identification of a transiting extrasolar planet system allows, for the first time, exploration of the physical characteristics of a planet outside our solar system.
The most interesting quantity that we can derive from the photometric observations of the transit is the planetary radius, . Although HD 209458b is less massive than Jupiter, its radius is significantly larger, a result of slowing of the planetary contraction due to exposure to high stellar insolation early after the planet’s formation (Burrows et al. 2000). The precise value of is dependent upon the planetary Bond albedo, , a fundamental parameter in the thermodynamics of the planetary atmosphere. A precise measurement of may allow an estimate of (Burrows et al., 2000), though the published uncertainty in (Mazeh et al., 2000) is too great for a meaningful constraint.
The photometric observations of the transit published to date have been in the band (two full transits; Charbonneau et al. (2000)) and in a Strömgren band (one half transit; Henry et al. (2000)). In this Letter, we present observations in five wavelength bands of the planetary transit on UT 1999 November 15. As we describe below, we have observed color-dependent variations in the transit shape due to the stellar limb-darkening. We present a likelihood analysis of the data that improves the estimates of the planetary radius and orbital inclination. More generally, we outline a method that may be used to analyze future high-precision, multicolor data and exploit the color-dependence in order to break the degeneracy shared between the planetary and stellar parameters.
2 Observations and Data Reduction
2.1 University of Hawaii 2.2m Data
Our multicolor observations of the HD 209458 planetary transit were made with the University of Hawaii 2.2m telescope on Mauna Kea under photometric skies. The data were taken with the Tek 20482 CCD at per pixel. The brightness of HD 209458, (Høg et al., 2000)111For HD 209458 and the comparison stars, we list consistent Johnson and magnitudes based on the recommended transformation from the Tycho-2 catalogue and magnitudes, as described by ESA (1997), Vol. 1, Sec. 1.3., forced us to defocus the telescope in order not to saturate the detector. As there were no stars of comparable brightness in the field of view, we took images of a nearby comparison star before and after each set of HD 209458 observations. Each observation sequence on target consisted of five 1 s exposures in each of Johnson and Kron-Cousins and , and five 5 s exposures with a filter. We also observed comparison stars that bracketed HD 209458 in airmass, alternating between HD 210483 () and HD 208156 (). The comparison star observations were taken in the same manner as those of the target star.
We performed aperture photometry on the bias-corrected and flat-fielded CCD images, using a digital aperture. The magnitudes of the comparison star were plotted against airmass to define an extinction correction. We continued observations as far as airmass 2.1, but a linear extinction correction was sufficient to fit the data. We also corrected for color-dependent extinction by interpolating between the extinction corrections derived for the comparison stars (which straddled HD 209458 in color).
We converted the derived magnitues into relative fluxes and each set of five consecutive observations (in each filter) was binned to produce a single average value, with an uncertainty given by the error in the mean. The photometry was limited primarily by scintillation noise, and the achieved relative precision for the time series was (1.6 mmag), (1.0 mmag), (1.2 mmag), and (0.8 mmag), for the , , , and data, respectively. For each band, the off-transit flux level was derived from the statistically-weighted average of the last three observations, and time series in each color were normalized to this level to yield the relative fluxes used in the modeling. Applying the reduction procedure to the comparison star observations yielded constant light curves as expected.
2.2 University of Hawaii 0.6m Data
We obtained Johnson observations of HD 209458 with the University of Hawaii 0.6m telescope, in combination with a three channel photometer, similar to the one described in Kleinman, Nather, & Phillips (1996). Using identical photomultiplier and amplifier-discriminator detectors this device allows high-speed aperture photometry to be simultaneously conducted on three selectable regions of the sky, thus enabling continuous monitoring of a target star, comparison star and sky background.
HD 209458 was continuously monitored using 10 s integrations through a Johnson filter. A nearby (fainter) star was used for comparison and guiding, with all channels (including sky) using apertures. A filter was not available for the comparison star channel, so its effective filter was determined by the atmosphere to the blue and a dichroic beam-splitter to the red (sending the red light in this channel to a CCD guider), resulting in a bluer and broader passband than the target channel. We consequently obtained an improved atmospheric absorption model for the final data reduction by observing HD 209458 off-transit on a subsequent night (UT 1999 November 17), during virtually identical photometric conditions over the same airmass range (1.1 to 1.8) and with the same instrumental configuration. The HD 209458 sky-corrected instrumental magnitudes were corrected for color-dependent extinction with a linear airmass model. These were converted to relative fluxes and binned into 4 minute time bins, with normalization by the weighted average of the final two data bins, which occured off-transit. The resulting rms relative flux residuals were (0.8 mmag).
2.3 STARE Telescope Data
Additional observations of HD 209458 were made with the High Altitude Observatory STARE telescope (Brown & Kolinski 1999222Available at http://www.hao.ucar.edu/public/research/stare/stare.html; Brown & Charbonneau 2000) on the same night, though the target star set at mid-transit. The observations and reduction of these data were identical to those described by Charbonneau et al. (2000), though the precision is significantly lower than those observations since the star was observed at higher airmass. The data were binned into 5 minute sets, and converted to relative fluxes by normalizing by the statistically-weighted average of the off-transit data. The achieved relative flux residual rms increased from (4 mmag) to (7 mmag) over the course of the night as the target set.
Our final multicolor photometry is displayed in Figure 1, along with our best-fit model, described in the next section.
3 Analysis
3.1 Improvement to Orbital Parameters
Assuming the transit is symmetric, we find the time for the center of the transit is HJD. The two previous observations of the full transit (Charbonneau et al., 2000) found HJD and HJD, which occured, respectively, 19 and 17 orbits earlier than the one we report here. From these three measurements of , we calculate an orbital period of days. We note also that this period is consistent with the more precise statements of the period of days (3.9 s) (Castellano et al., 2000) and days (1.2 s) (Robichon & Arenou, 2000) derived from Hipparcos archive photometry.
3.2 Analysis of the Multicolor Transit Curve
Derivation of parameters from transit observations in a single bandpass is plagued by a degeneracy: the transit curve is described primarily by its depth and duration, yet it is always possible to fit these with a larger (smaller) planet provided the stellar radius is also increased (decreased) and the orbital inclination, , is decreased (increased). However, by observing the relative depth and shapes of the transit curves in different bands, this degeneracy can be lifted. Measurement of the relative flux at a given time during the transit can be combined with a limb-darkening model for the star, , to derive , the cosine of the angle between the normal to the stellar surface and the line of sight, thus constraining the inclination. With this constraint, the transit duration constrains the stellar radius, which when combined with the transit depth (a measurement of the ratio ) constrains the planetary radius. For example, if one observes that the transit is deeper in than in , one would infer that a larger planet passes close to the limb of a larger star, because the star is relatively brighter in the red towards the limb.
Because we can observe only the flux integrated over the stellar disk, we proceed as follows. R. Kurucz (personal communication) generated model stellar intensities as a function of wavelength and . For each passband, we multiplied the model intensities by a response function (see below) and integrated over wavelength to produce intensity as a function of . For the 2.2m observations, the response function was the combination of the mirror, CCD, and filter responses, whereas for the 0.6m and STARE data, we used only the filter response. We then produced, for each passband, , a grid of model light curves, , as a function of the planetary radius, the stellar radius, and the orbital inclination. The light curve model follows the description presented in Sackett (1999) and Charbonneau et al. (2000), taking into account the finite size of the planet and the limb-darkening of the star. Since we integrate over the whole stellar disk and a wide passband, the light curves are relatively insensitive to small errors in the Kurucz model; we have confirmed this with fits using parameterized limb-darkening models.
Because all data points of the light curve have been normalized by the statistically weighted average of the off-transit points, there is a potential systematic uncertainty in the transit depth, as there are fewer off-transit points than on-transit points. Thus we introduced a fourth parameter into the model, a scale factor for the data, , equivalent to allowing for an unknown magnitude zeropoint. This nuisance-parameter was subsequently integrated out (see below), and this integration serves to account properly for the systematic uncertainty introduced by the paucity of out-of-transit data by appropriately broadening the likelihood distributions.
We adopt a Bayesian approach for the analysis; in a given passband the likelihood of a particular model is
| (1) |
with
| (2) |
where are the observed data with uncertainties , and the are the prior probabilities (priors; see below). We evaluated separately in each passband for our grid of light curve models spanning the range of where the likelihood was non-negligible.
As we wish to measure the parameters independently of the previous results, we assume we have no prior knowledge of and . However, we can estimate as follows. With the photometry as above, the Hipparcos parallax of HD 209458 yields (Perryman et al., 1997). Applying a bolometric correction (Bessell, Castelli, & Plez, 1998) of , appropriate for the stellar type and metallicity (Mazeh et al., 2000), we can calculate the stellar bolometric flux. Then from the measured effective temperature of 6000 K (Mazeh et al., 2000), we derive . There is a 10% uncertainty in the visual luminosity and a 1% uncertainty in the effective temperature, and we estimate a few percent uncertainty in the bolometric correction. Combining these implies an 8% uncertainty in the stellar radius. Thus, in our analysis of the transit curves we adopt a Gaussian prior for the stellar radius, corresponding to , and uniform priors , and , on the other model parameters. Different choices for the exact shape of the prior on the stellar radius did not significantly affect the results.
We derived independently for each of the six passbands: the UH 0.6m data; the UH 2.2m , , and data; and the STARE data. The minimum reduced is very near unity for four of the six passbands, (with 39 degrees of freedom), (13), STARE (49), (13). The two exceptions are the UH 2.2m and data, which have minimum of 2.85 and 2.97, respectively for 13 degrees of freedom each. As these are the two passbands with the smallest statistical uncertainty, we adopt the plausible hypothesis that the poor fits are caused by an unidentified systematic uncertainty (at the level of mmag), rather than a failing of the light curve models. Data of higher precision will resolve this issue, but for the time being we have scaled the uncertainties for the UH 2.2m and data to give a minimum reduced of unity, thus broadening the derived likelihood distributions.
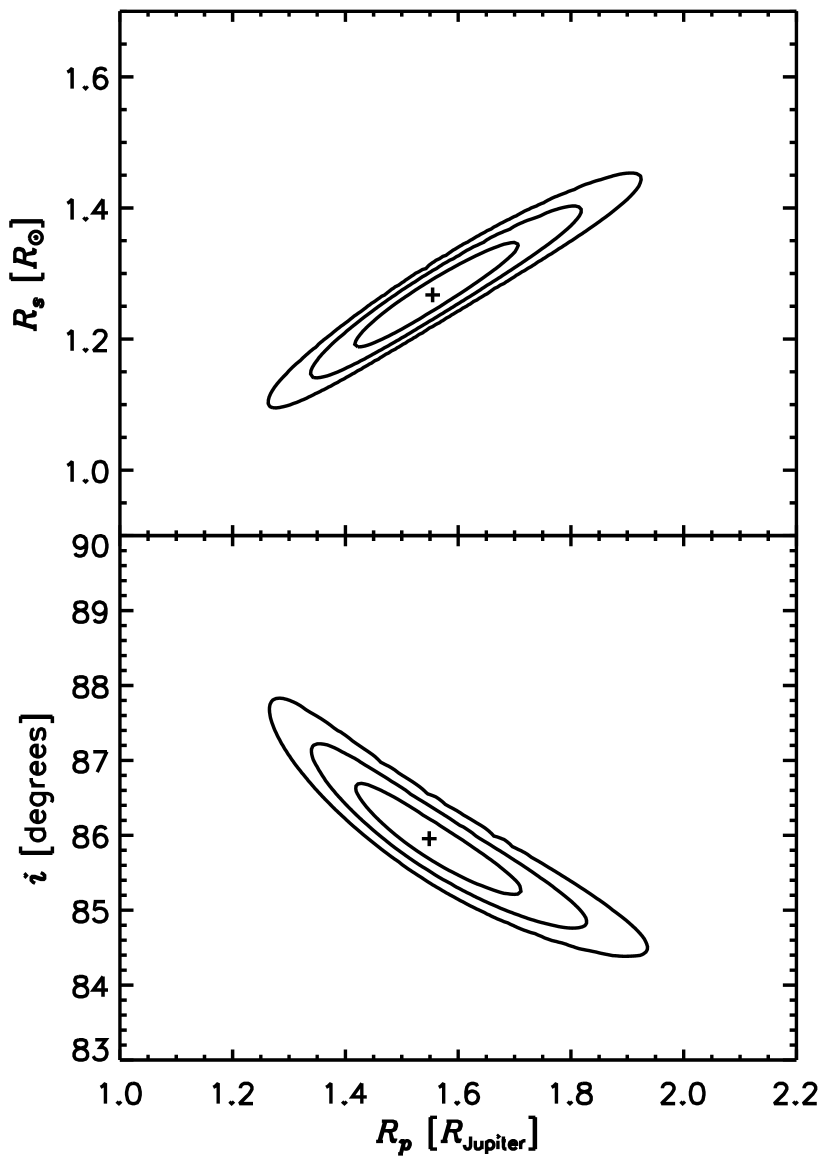
To derive combined constraints from the individual likelihoods, we first integrate each over the nuisance parameter , leaving correctly broadened three-dimensional likelihood distributions over . Multiplying these distributions together (but with the priors included only once) yields our combined likelihood; the peak of this distribution is our best-fit model and the light curves corresponding to this model are shown as the solid lines in Figure 1. We note that the uncertainties in our derived parameters are highly correlated and to underscore this important fact, we present contours of the two-dimensional likelihood distributions (integrated over the third variable) in Figure 2. To correctly account for these correlations in determining the individual likelihoods for each of the parameters separately, we integrate the three-dimensional distribution over the other two parameters. These one-dimensional distributions are well-fit by Gaussians, with , , and .
4 Discussion and Conclusion
Our derived parameters are consistent with the results of Mazeh et al. (2000), with our multicolor data roughly halving the uncertainties presented there, and favoring a slightly larger planet and star. Combined with the orbital data of Mazeh et al. (2000), our results imply a mean planetary density of .
We are also in a position to make a comparison between the observations and models for HD 209458b. Burrows et al. (2000) present evolutionary tracks of radii versus time for close-in extrasolar giant planets, taking into account the effects of high stellar insolation in retarding the planet’s contraction. Previous measurements of the radius of HD 209458b were not precise enough to differentiate between models with low and moderate albedos (models A and B of Burrows et al. (2000) in their Figure 1, with Bond albedos of 0.0 and 0.5, respectively). Our more precise measurement favors a larger planet, and is in very good agreement with model A, which has a radius close to 1.5 (at the approximate age of the system of several Gyr). Our derived radius disfavors model B, for which the radius is predicted to be near 1.3 . This result provides evidence for a low albedo for HD 209458b.
It is also of interest to see if we can detect any differences in the planetary radius as a function of color. The value of as derived from transit observations may vary with the passband, since the planet would appear slightly larger when observed at wavelengths where the atmosphere contains strong opacity sources (Brown & Charbonneau, 2000; Burrows et al., 2000; Seager & Sasselov, 2000). To explore this possibility, in Figure 3 we present the peak positions of the one-dimensional conditional likelihood distributions for the planetary radius in each passband, with the stellar radius and inclination fixed at their best-fit values. The uncertainties shown then do not incorporate the correlations exhibited in Figure 2, but they are correct relative to each other. For instance, if the stellar radius were increased, all of the points on Figure 3 would increase together. Even so, the data are not precise enough to show evidence for any variation in the planetary radius with wavelength. Future observations should be able to improve the measurement precision, and provide a tool for learning about the planetary atmosphere.
The discovery of an extrasolar planet transiting its host star has heralded a new era in a young field. While precision radial velocities reveal much about orbital characteristics, the addition of transit observations yield understanding about the physical characteristics of the planets themselves. We eagerly anticipate further exploration of extrasolar planets with continued observations of this shadowy nature.
References
- Bessell, Castelli, & Plez (1998) Bessell, M. S., Castelli, F., & Plez, B. 1998, A&A, 333, 231
- Brown & Charbonneau (2000) Brown, T. M., & Charbonneau, D. 2000, in ASP Conf. Ser., Disks, Planetesimals, and Planets, eds. F. Garzón and T. J. Mahoney (San Francisco: ASP) (astro-ph/0005009)
- Burrows et al. (2000) Burrows, A., Guillot, T., Hubbard, W. B., Marley, M. S., Saumon, D., Lunine, J. I., & Sudarsky, D. 2000, ApJ, in press (astro-ph/0003185)
- Castellano et al. (2000) Castellano, T., Jenkins, J., Trilling, D. E., Doyle, L., & Koch, D. 2000, ApJ, 532, L51
- Charbonneau et al. (2000) Charbonneau, D., Brown, T. M., Latham, D. W., and Mayor, M. 2000, ApJ, 529, L45
- ESA (1997) European Space Agency 1997, The Hipparcos and Tycho Catalogues (Paris: ESA), SP-1200
- Henry et al. (2000) Henry, G. W., Marcy, G. W., Butler, R. P., and Vogt, S. S. 2000, ApJ, 529, L41
- Høg et al. (2000) Høg, E., Fabricius, C., Makarov, V. V., Urban, S., Corbin, T., Wycoff, G., Bastian, U., Schwekendiek, P., & Wicenec, A. 2000, A&A, 355, L27
- Kleinman, Nather, & Phillips (1996) Kleinman, S. J., Nather, R. E., and Phillips, T. 1996, PASP, 108, 356
- Mazeh et al. (2000) Mazeh, T., et al. 2000, ApJ, 532, 55
- Perryman et al. (1997) Perryman, M. A. C., et al. 1997, A&A, 323, L49
- Robichon & Arenou (2000) Robichon, N., & Arenou, F. 2000, A&A, 355, 295
- Sackett (1999) Sackett, P. D. 1999, in NATO/ASI Ser., Planets Outside the Solar System: Theory and Observations, ed. J.-M. Mariotti & D. Alloin (Dordrecht: Kluwer), 189
- Seager & Sasselov (2000) Seager, S., & Sasselov, D. D. 2000, ApJ, submitted (astro-ph/9912241)