The Cometary Blue Compact Dwarf Galaxies Mkn 59 and Mkn 71:
Abstract
“Cometary” Blue Compact Dwarf Galaxies (iI,C BCDs) are characterized by an off–center starburst close to the end of their elongated stellar bodies. This rare phenomenon may carry some clues on how collective star formation ignites and propagates in gas–rich low–mass stellar systems. This off–center burst may be a fortuitous enhancement of the otherwise moderate star–forming activity of a dwarf irregular (dI), or may be caused by a set of special properties of such systems or their environment. We attempt here a first investigation of this issue by analysing two prototypical examples of cometary dwarf galaxies, the nearby iI,C BCDs Markarian 59 and Markarian 71, both containing an extraordinarily luminous H ii region in the outskirts of a dI–like host. Using deep ground–based spectrophotometric data 111Obtained at the German–Spanish Astronomical Center, Calar Alto, operated by the Max–Planck–Institute for Astronomy, Heidelberg, jointly with the Spanish National Commission for Astronomy.,222Obtained at the Kitt Peak National Observatory, National Optical Astronomy Observatories, operated by the Association of Universities for Research in Astronomy, Inc., under cooperative agreement with the National Science Foundation. and HST images 333Based on observations with the NASA/ESA Hubble Space Telescope, obtained at the Space Telescope Science Institute, which is operated by AURA, INC., under NASA contract No. NAS 5–26555., we study the physical state of the starburst regions and the structural properties of the underlying irregular galaxies. We find that the average metallicities show small scatter in the vicinity of the star-forming regions and along the major axis of Mkn 59 which suggests that mixing of heavy elements must have been efficient on scales of several kpc. The azimuthally averaged radial intensity distributions of the underlying host galaxies in either iI,C BCD can be approximated by an exponential law with a central surface brightness and scale length that is intermediate between typical iE/nE BCDs and dwarf irregulars. Spectral population synthesis models in combination with colour magnitude diagrams and colour profiles yield a most probable formation age of 2 Gyr for the low surface brightness (LSB) host galaxies in both iI,C BCDs, with upper age limits of 4 Gyr for Mkn 59 and 3 Gyr for Mkn 71, i.e. significantly lower than the typical age of several Gyr derived for the LSB component of iE/nE BCDs. These findings raise the question whether iI,C systems form a distinct physical class within BCDs with respect to the age and structural properties of their hosts, or whether they represent an evolutionary stage connecting young i0 BCDs and “classical” iE/nE BCDs. In spite of the scarcity of available data, a review of the properties of analogous objects studied in the local universe and at medium redshifts provides some support for this evolutionary hypothesis.
Key Words.:
galaxies: abundances — galaxies: dwarf — galaxies: evolution — galaxies: compact — galaxies: starburst — galaxies: stellar content1 Introduction
Despite the effort that has been devoted to the investigation of Blue Compact Dwarf Galaxies (BCDs), the origin of their recurrent starburst activity as well as its impact on their spectrophotometric and dynamical evolution is still poorly understood. A thorough investigation of these processes is required before questions pertaining to evolutionary connections among dwarf irregulars (dIs), dwarf ellipticals (dEs) and BCDs (Thuan thuan85 (1985), Davies & Phillipps davies88 (1988), Papaderos et al. 1996b; hereafter P96b , Patterson & Thuan patterson96 (1996), Salzer & Norton salzer98 (1998), Marlowe et al. marlowe97 (1997), marlowe99 (1999)) can be answered. Deep imaging of the low surface brightness (LSB) component of BCDs, discovered first by Loose & Thuan (1985; hereafter LT (85)), disclosed an evolved stellar population underlying the regions of active star formation (SF) (Loose & Thuan lt86 (1986), Kunth et al. kunth88 (1988), Papaderos et al. 1996a; hereafter P96a ). Therefore, the initial hypothesis that BCDs are “extragalactic H ii regions” lacking an older stellar population (Sargent & Searle sargent70 (1970)) had to be dismissed for the majority of these systems.
An exception to this finding is made by a tiny fraction ( 1% ) of young galaxy candidates which recently have been identified among BCDs (Thuan et al. til97 (1997), Papaderos et al. papaderos98c (1998), Thuan & Izotov ti99 (1999)). There is increasing observational evidence that such systems, invariably found among the most metal–deficient ( 1/20 , Thuan & Izotov ti99 (1999), Izotov & Thuan it99 (1999)) members of the BCD class, have started forming the bulk of their stellar component less than 100 Myr ago. This qualifies them as local counterparts of primeval galaxies, i.e. the first galactic building blocks which are thought to have formed at high redshifts.
It seems meaningful to search among the variety of dwarf galaxies for possible successors of young galaxies, i.e. objects in a more evolved stage with a substantial fraction of their masses still in gaseous form. An age sequence built therefrom would allow to study the evolution of nearby dwarf galaxies, which may at the same time give clues to early galaxy evolution processes at high redshift. This is of great interest for the assessment of the starburst–driven evolution of young galaxies, some of which may become the building blocks of larger systems and for the understanding of issues like the faint blue galaxy excess at intermediate redshifts (Babul & Rees babul92 (1992), Koo et al. koo97 (1997), Guzmán et al. guzman98 (1998)).
Loose & Thuan (1985) developed a morphological classification scheme for BCDs and found that 90% of their sample is made up of iE– and nE–objects. These show, respectively, an irregular or nuclear starburst component superposed on a smooth elliptical LSB host galaxy with optical colours pointing to ages of several Gyr (Loose & Thuan lt86 (1986), P96b , Telles & Terlevich telles97 (1997), Noeske noeske99 (1999)). In contrast, the few members of the rare class of i0 BCDs examined so far have been found to be young galaxy candidates (Thuan et al. 1997, Papaderos et al. papaderos98c (1998), Thuan & Izotov ti99 (1999), Izotov et al. izotov99 (1999)), as they apparently lack a smooth stellar underlying component that would have required previous episodes of SF to be built.
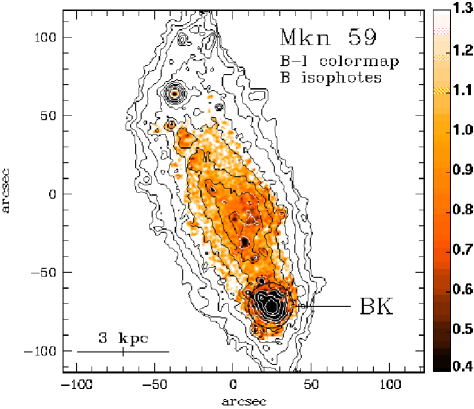
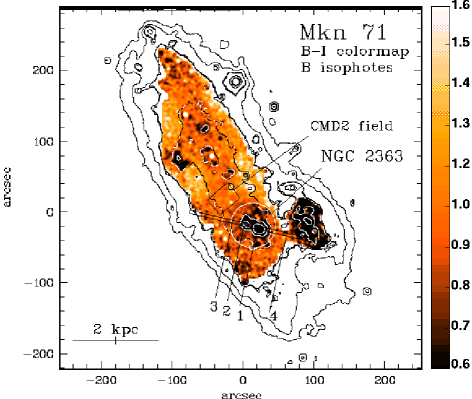
Only the class of iI BCDs, characterized by both irregular LSB components and starburst regions, has not yet been studied systematically. This paper focuses on the subset of iI,C BCDs (LT (85)) where “C” denotes a cometary appearance caused by a bright star–forming complex at one end of an elongated stellar galactic body (see Figs. 1 and 6).
In the notation of Salzer et al. (salzer89 (1989)) an iI,C BCD is to be included in the class of H ii hotspot galaxies; these systems seem to systematically differ from other subclasses of H ii galaxies with respect to the metallicities and excitation properties of their ionized gas.
| Object | Filter | Night | Seeing | Sky | |
| (2000.0) | sec | ″ fwhm | mag | ||
| (2000.0) | |||||
| (1) | (2) | (3) | (4) | (5) | (6) |
| Mkn 59 | 180 | 4 | 1.67 | 22.4 | |
| 1100 | 3 | 2.95 | 22.5 | ||
| 12 59 00.3 | 540 | 4 | 1.57 | 20.8 | |
| +34 50 43 | 300 | 4 | 1.45 | 18.8 | |
| Mkn 71 | 1500 | 1 | 1.59 | 22.1 | |
| 300 | 4 | 1.48 | 20.6 | ||
| 7 28 41.4 | 600 | 3 | 2.92 | 20.7 | |
| +69 11 26 | 600 | 1 | 1.67 | 18.9 | |
| H | 900 | 3 | 3.07 | — | |
| H | 900 | 4 | 1.74 | — |
While the main bodies of iI,C systems are reminiscent of low surface brightness dwarf irregulars (dIs) or magellanic irregulars (Kennicutt et al. kennicutt80 (1980), Dottori et al. dottori94 (1994), Wilcots et al. wilcots96 (1996)) with some widespread low–level SF, the bright off–center H ii regions are typical for BCDs with respect to their sizes, H luminosities and electron temperatures. The detection of Super Star Clusters (SSCs) in these spots points to a very recent or still ongoing starburst episode (Kennicutt et al. kennicutt80 (1980), Dottori et al. dottori94 (1994), Barth et al. barth94 (1994)).
Optical surveys of BCDs (LT (85), Kunth et al. kunth88 (1988), Salzer et al. salzer89 (1989), P96a , Marlowe et al. marlowe97 (1997), Doublier et al. doublier97 (1997)) and dIs (e.g. Hunter et al. hunter98 (1998)) suggest that in these systems SF per unit area correlates with the local surface density of the underlying host galaxy. In this respect, the occurrence of a starburst with the amplitude observed in iI,C BCDs at one end of an elongated stellar LSB body appears puzzling and may be interpreted in at least two ways:
(i) iI,C BCDs are in fact dIs or magellanic irregulars caught during a brief stochastic enhancement of their otherwise moderate star formation rate per unit area. This would imply that both the structural properties of their stellar hosts and H I envelopes will be indistinguishable from those of other dIs.
(ii) In iI,C BCDs the conditions necessary for the ignition of a starburst are not fulfilled at the center but in the outskirts of their LSB components. This may be due to a conspiracy of intrinsic and external properties of an evolved BCD (kinematics of the gaseous component and Dark Matter distribution or external perturbation by a companion or intracluster gas) or alternatively be a common feature among less evolved systems.
Here we attempt to test such hypotheses by analysing optical data of two nearby iI,C BCDs, Mkn 59 (NGC 4861) and Mkn 71 (NGC 2366, hosting the H ii region complex NGC 2363). The distance to Mkn 71 was determined to =3.44 Mpc through observations of Cepheids (Tolstoy et al. tolstoy95 (1995)). For Mkn 59 different models for infall and small–scale perturbations in the Virgo Cluster environment yield a distance between 10.7 Mpc (Heckman et al. heckman98 (1998)) and 17.8 Mpc (Tully tully88 (1988)). The principal results of this work do not depend on the exact distance to Mkn 59 (cf. Section 3.1). Throughout this paper, we adopt =10.7 Mpc (Heckman et al. heckman98 (1998)).
Using broad– and narrow band images and long–slit spectra from own ground–based observations and archival HST data, we shall investigate the physical state and the chemical composition of the ISM and examine whether the iI,C BCDs under study differ from typical iE/nE BCDs with respect to the ages and structural properties of their LSB hosts. In Section 2, we describe our observations and data analysis. We present our results in Section 3, and discuss them in Section 4. In Section 5, we summarize our results and conclusions.
2 Data acquisition and processing
2.1 Ground–based imaging
2.1.1 Observations and data reduction
Images were taken on March 7th – 10th 1997 at the 2.2m telescope of the German–Spanish Astronomical Center, Calar Alto, Spain. We used the Calar Alto Faint Object Spectrograph (CAFOS), equipped with a 20482048 pixel SITe#1d CCD. The focal ratio of f/4.4 in the RC focus and the pixel size of 24 m/pixel yield an instrumental scale of 0.53″/pixel and a usable field of view of 15′. At a gain ratio of 2.3 e- ADU-1 the read–out noise was 3 counts (rms). Column (1) of the observing log (Table 1) contains the equatorial coordinates of the targets, cols. (2) and (3) give the filters and exposure times, respectively. Column (4) lists the night of the observing run, starting with night 1 from March 7th to March 8th 1997. The seeing and the mean sky surface brightness during each exposure are given in cols. (5) and (6). During each night, dark–, bias–, and flat–field exposures were taken, and the photometric standard field NGC 2419 (Christian et al. christian85 (1985)) was observed at different zenith angles. Using the ESO MIDAS444Munich Image Data Analysis System, provided by the European Southern Observatory (ESO). software package, standard reduction and calibration steps were applied to the raw images. During nights 3 and 4 the conditions were photometric, resulting in calibration errors well below 0.05 mag. A poor atmospheric transparency during night 1 led to strong airmass–dependent terms for the band exposure of Mkn 71. Therefore the calibration was accomplished by comparing aperture photometry of bright isolated point sources on HST– and ground–based images. The photometric uncertainty of the latter band exposure was found to be 0.1 mag. All exposures for one object were aligned to each other using positions of point sources; the transformed images were generated by re–sampling the original image using a flux–conserving routine. Colour maps were derived after the resolution of different frames had been equalized by convolving the exposure with the better resolution with a normalized gaussian distribution of adequate width.
The continuum level in the H images was inferred by scaling the band images by an empirically determined factor so that the fluxes of field stars were matched between the raw H– and the scaled exposures. In turn, the scaled band exposures were subtracted from the raw H images, giving the emission flux at each pixel. The latter approach is strictly correct only when the H emission line is contributing a minor fraction of the line–of–sight band flux. In regions where H emission makes a substantial fraction of the photons received in the band the empirical scaling may lead to a slight overestimation of the continuum flux. In these cases the correct H emission is obtained from as:
| (1) |
where is the empirical factor described above and the mean transmission of the band filter at the H wavelength. The resulting narrow band frames were calibrated using continuum–subtracted H exposures of the planetary nebula NGC 2392 for which aperture flux measurements are given by Kaler (kaler83 (1983)).
To derive H equivalent width maps we subtracted first the corrected line emission frame (Eq.1) from the raw H image to obtain a continuum image , which was then normalized to the continuum flux per 1Å wavelength interval by dividing it by the effective width of the H filter. The emission line image was divided by the transmission of the H filter at the H wavelength. The resulting frame, containing the total H emission flux, was divided by the 1Å– normalized continuum flux frame to obtain the H equivalent width image.
2.1.2 Surface photometry

| Name | Band | , | |||||||
| mag/ | kpc | kpc | mag | kpc | mag | mag | kpc | ||
| (1) | (2) | (3) | (4) | (5) | (6) | (7) | (8) | (9) | (10) |
| Mkn 59 | 21.620.15 | 1.1510.041 | 1.39 | 13.96 | 3.59 | 13.11 | 12.640.01 | 1.37, 2.83 | |
| 20.780.23 | 1.1230.059 | 0.37 | 14.11 | 4.36 | 12.22 | 12.080.02 | 1.67, 3.07 | ||
| 19.770.24 | 1.0220.051 | 0.17 | 14.02 | 4.92 | 11.36 | 11.640.02 | 2.01, 3.29 | ||
| Mkn 71 | 21.820.12 | 0.8790.028 | 0.65 | 13.39 | 2.58 | 11.47 | 11.120.02 | 1.19, 2.25 | |
| 21.290.15 | 0.8850.035 | 0.50 | 13.51 | 3.02 | 10.84 | 10.680.03 | 1.28, 2.34 | ||
| 20.570.15 | 0.8160.030 | 0.29 | 14.26 | 3.33 | 10.22 | 10.200.03 | 1.32, 2.30 |
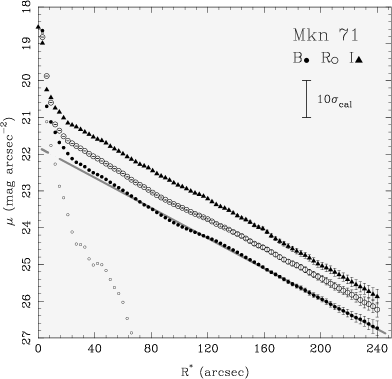
Surface brightness profiles (SBPs) are the result of a transformation of a galaxy’s 2–dimensional flux pattern into a monotonically decreasing 1–dimensional intensity distribution. For a set of methods to compute the photometric radius , i.e. the radius of a circle with an area equal to the one enclosed by the isophote at the surface brightness level , see e.g. Loose & Thuan (1986) and P96a . The method of summing up the area defined by pixels with fluxes exceeding a threshold () (method iii; P96a ) was considered most appropriate for the BCDs analyzed here as both their underlying and starburst components are of irregular morphology. Other techniques, such as isophote integration or ellipse fitting, though well suited for more regular BCDs, are hardly applicable to the optical images of Mkn 59 and Mkn 71, mainly due to the fact that their high surface brightness components split into many star-forming regions occupying a substantial fraction of the host galaxy’s surface.
For each surface brightness level , the number of all pixels within a polygonal aperture with a count level was determined; the corresponding photometric radius is
| (2) |
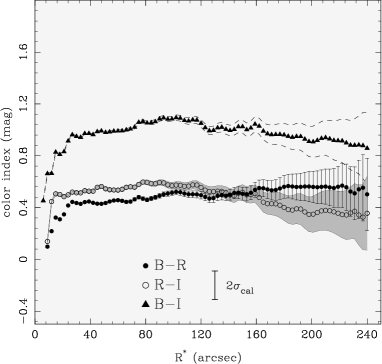
where is the solid angle per pixel in . Numerical simulations showed that for the technique described above Poisson photon noise may cause a systematic flattening of SBPs at a signal to noise level . This frequently observed artificial profile flattening could be, however, satisfactorily corrected down to a level of by using the adaptive filtering algorithm implemented in MIDAS (see Richter et al. 1991 for a description). The uncertainties at each photometric radius were calculated taking into account the corresponding intensity, the sky noise of each image, and the number of pixels involved in its calculation (cf. P96a ). Colour profiles were computed by subtracting SBPs from each other; the surface brightness– and colour profiles displayed in Figure 3 are corrected for interstellar extinction (cf. Section 2.1.1).
Unlike stellar systems like globular clusters and giant ellipticals where the mass to light () ratio may be regarded nearly constant over the whole system, the integrated luminosity of BCDs originates from two distinct stellar populations with substantially different ages and ratios. Although the LSB component contributes on average one half of the total band luminosity of a BCD (P96b , Salzer & Norton 1998), it contains most of the stellar mass of the system. Therefore, its intensity distribution yields information on the inner gravitational potential within which the starburst ignites and evolves. In order to disentangle the light distribution of the older host galaxy from the one of the superimposed starburst component, we applied a simple 2–component decomposition scheme adjusted interactively to each profile, instead of iteratively fitting the full nonlinear 3–component scheme described in P96a . The intensity distribution of the LSB component is approximated by an exponential fitting law of the form
| (3) |
or equivalently
| (4) |
where denotes its exponential scale length in arcsec and the surface brightness level in mag/. Equation (4) was adjusted to each profile by applying an error weighted linear fit to the data, at radii sufficiently large to be free from the contamination of the starburst light, i.e. where the colour profiles become constant and H emission vanishes. To check at which surface brightness levels gaseous emission becomes negligible, we overlaid the H emission– and H maps with broad band isophotes (cf. Figs. 1 and 2) . The fits, obtained at radii 76 for Mkn 59 and 160 for Mkn 71, yield the extrapolated central surface brightness and the exponential scale length . The radial surface brightness distribution of the starburst component can be computed from the residual luminosity in excess of the fit Eq. (4).
Table 2 summarizes the results of the profile decomposition. In the same way as described in P96a , cols. (3) and (4) give the central surface brightness and exponential scale length of the LSB component. Columns (5) and (7) list respectively the isophotal radii of the starburst component (practically the “plateau radius” used in P96a ), and of the stellar LSB host, . Both radii were determined from extinction–corrected SBPs at a surface brightness level of 25 mag/. Columns (6) and (8) contain the apparent magnitudes of the latter components determined within and , respectively, and col. (9) the total apparent magnitude in each band as derived from integration of the corresponding SBP out to the last measured point. Column (10) lists the effective radius and the radius , enclosing 80% of the galaxy’s total flux.
2.2 HST images


2.2.1 Data reduction
Next we shall discuss colour–magnitude diagrams (CMDs) of the H ii complex NGC 2363 and the main body of Mkn 71 derived from Hubble Space Telescope (HST) archival data. The following analysis is based on integrations of 2800 and 1700 sec in the F439W filter, 2800 sec in the F547M filter and 1900 plus 1600 sec in the F656N filter taken on January 8th, 1996 with the WFPC2 (PI: Drissen, Proposal ID 06096). All images were reduced through the standard pipeline as described in Holtzman et al. (1995a ). Exposures taken in the same filter were co–added and corrected for cosmic ray events using the STSDAS package and IRAF222IRAF is distributed by the National Optical Astronomy Observatories, which is operated by the Association of Universities for Research in Astronomy, Inc., under cooperative agreement with the National Science Foundation.. We applied a charge transfer efficiency correction to the data as described in the HST Data Handbook (hst98 (1998)), performed a sky background subtraction and used the synthetic zero points and transformation coefficients given by Holtzman et al. (1995b ) to transform the measured fluxes to magnitudes in the Johnson system. For the H narrow band filter, F656N, the continuum was subtracted as described in Section 2.1.1; the correction given by Eq. (1) was not necessary, as the H line lies outside the wavelength range covered by the F547M filter. The calibration of the H images was done following the prescriptions by Holtzman et al. (1995b ).
2.2.2 Colour–magnitude diagrams
The H ii region NGC 2363 within Mkn 71 (Figure 1; right) was centered on the PC/WF1 chip (instrumental scale of 0046/pixel), allowing the resolution of compact groups of stars with a mean linear separation of 0.8 pc. We utilized the PC1 data to derive CMDs in order to further constrain the results of the spectral population synthesis analysis (Section 3.3) using the DAOPHOT II stellar photometry package under ESO MIDAS. A model for the point spread function (PSF), necessary for performing multiple–PSF fitting in crowded fields, was computed from several isolated bright stars in each frame. Because of the severe crowding within some regions of NGC 2363 as well as local background variations due to strong gaseous emission, we evaluated the photometric uncertainties and completeness limits of the resulting point-source identification files, taking into account the error growth towards fainter luminosities and the magnitude histograms (cf. Figure 5).
The measured fluxes were calibrated and transformed to the Johnson and filters as described in the previous section. The luminosity functions of the detected point sources (Figure 5, left panel) suggest a reasonable completeness for sources brighter than 26 mag in both and . Faintwards of the latter magnitude cutoff the photometric errors become dominant (see Figure 4). Close to the detection limit, an additional error source is introduced by the small–scale variations of the background due to gaseous emission as well as strong noise peaks which possibly are misinterpreted as faint stars (cf. the excess counts at low luminosities in the upper left panel of Figure 5). We shall therefore consider the data reliable down to a limit of 25 mag in and , close to the one Drissen et al. (drissen99 (1999)) obtain for the same data set. This cutoff is sufficient for our purposes; from a simple comparison of data points and isochrones it becomes evident that, given the photometric errors and poor time resolution of the CMD, no firm conclusions on the SF history can be drawn for ages 50 Myr. A second CMD was derived in the same way for a region on the WF4 chip apparently free of any appreciable signatures of current SF (marked in Figure 1) to obtain information on the galaxy’s underlying stellar population separately. From an inspection of the right panels of Figure 5, and from the considerations referring to the CMD of NGC 2363 we estimate the confidence limit to 24 mag for both and . Either CMD is shown in Figure 4 with typical photometric uncertainties for different magnitude intervals along with synthetic isochrones for a metallicity of =0.001 adopted from Bertelli et al. (bertelli94 (1994)).

2.3 Spectroscopic observations and data reduction
| Ion | region 1 | region 2 | |||
|---|---|---|---|---|---|
| ()/(H) | ()/(H) | ()/(H) | ()/(H) | ||
| 3727 [O ii] | 1.00860.0018 | 1.08790.0020 | 1.91910.0832 | 2.08010.1049 | |
| 3750 H12 | 0.02040.0006 | 0.02680.0009 | … | … | |
| 3770 H11 | 0.02800.0006 | 0.03490.0009 | … | … | |
| 3798 H10 | 0.03410.0006 | 0.04150.0009 | … | … | |
| 3835 H9 | 0.04980.0006 | 0.05810.0009 | … | … | |
| 3868 [Ne iii] | 0.45660.0011 | 0.48720.0012 | 0.31790.0503 | 0.33660.0584 | |
| 3889 He i + H8 | 0.16330.0008 | 0.17860.0010 | … | … | |
| 3968 [Ne iii] + H7 | 0.28060.0009 | 0.30140.0011 | 0.14670.0309 | 0.28480.0698 | |
| 4026 He i | 0.01100.0005 | 0.01160.0005 | … | … | |
| 4069 [S ii] | 0.00970.0006 | 0.01020.0006 | … | … | |
| 4076 [S ii] | 0.00310.0036 | 0.00330.0038 | … | … | |
| 4101 H | 0.23960.0008 | 0.25520.0010 | 0.12960.0246 | 0.26060.0598 | |
| 4340 H | 0.45890.0011 | 0.47660.0012 | 0.37750.0316 | 0.47370.0461 | |
| 4363 [O iii] | 0.08900.0006 | 0.09160.0006 | 0.05600.0326 | 0.05500.0349 | |
| 4471 He i | 0.03570.0005 | 0.03650.0005 | 0.08750.0320 | 0.08460.0339 | |
| 4658 [ iii] | 0.00540.0004 | 0.00540.0004 | … | … | |
| 4686 He ii | 0.01310.0005 | 0.01320.0005 | … | … | |
| 4713 [Ar iv] + He i | 0.00840.0004 | 0.00850.0004 | … | … | |
| 4740 [Ar iv] | 0.00550.0004 | 0.00560.0004 | … | … | |
| 4861 H | 1.00000.0017 | 1.00000.0017 | 1.00000.0495 | 1.00000.0554 | |
| 4921 He i | 0.00820.0004 | 0.00810.0004 | … | … | |
| 4959 [O iii] | 2.06700.0030 | 2.05030.0030 | 1.49930.0672 | 1.35880.0667 | |
| 5007 [O iii] | 6.15850.0078 | 6.09170.0078 | 4.32420.1668 | 3.89560.1645 | |
| 5199 [N i] | 0.00330.0004 | 0.00330.0004 | … | … | |
| 5271 [Fe iii] | 0.00190.0004 | 0.00190.0003 | … | … | |
| 5518 [Cl iii] | 0.00430.0004 | 0.00410.0003 | … | … | |
| 5538 [Cl iii] | 0.00260.0004 | 0.00250.0004 | … | … | |
| 5876 He i | 0.11380.0005 | 0.10750.0005 | 0.08540.0160 | 0.06980.0144 | |
| 6300 [O i] | 0.02100.0004 | 0.01950.0004 | … | … | |
| 6312 [S iii] | 0.02090.0004 | 0.01940.0003 | … | … | |
| 6364 [O i] | 0.00720.0003 | 0.00660.0003 | … | … | |
| 6548 [N ii] | 0.02420.0005 | 0.02220.0005 | … | … | |
| 6563 H | 3.07490.0041 | 2.82140.0041 | 3.61340.1384 | 2.80620.1277 | |
| 6583 [N ii] | 0.05400.0004 | 0.04950.0004 | 0.18000.0229 | 0.13770.0194 | |
| 6678 He i | 0.03230.0004 | 0.02950.0003 | 0.04270.0137 | 0.03240.0114 | |
| 6717 [S ii] | 0.10520.0005 | 0.09590.0005 | 0.29830.0266 | 0.22580.0225 | |
| 6731 [S ii] | 0.07850.0005 | 0.07150.0004 | 0.15970.0245 | 0.12070.0204 | |
| 7065 He i | 0.02800.0003 | 0.02520.0003 | … | … | |
| 7136 [Ar iii] | 0.08620.0005 | 0.07740.0004 | 0.13310.0178 | 0.09740.0144 | |
| 7281 He i | 0.00510.0003 | 0.00460.0002 | … | … | |
| 7320 [O ii] | 0.01860.0004 | 0.01660.0004 | … | … | |
| 7330 [O ii] | 0.02090.0005 | 0.01870.0005 | … | … | |
| (H) dex | 0.1100.002 | 0.2350.050 | |||
| (H)a | 15.080.02 | 0.280.01 | |||
| (H) Å | 150.10.2 | 441 | |||
| (abs) Å | 0.350.04 | 3.90.5 | |||
ain units of 10-14 ergs s-1cm-2.
| Ion | region 3 | ||
|---|---|---|---|
| ()/(H) | ()/(H) | ||
| 3727 [O ii] | 3.17300.1866 | 2.95050.2018 | |
| 3868 [Ne iii] | 0.53710.0516 | 0.49940.0528 | |
| 3968 [Ne iii] + H7 | 0.21770.0343 | 0.28320.0603 | |
| 4101 H | 0.15680.0426 | 0.23770.0836 | |
| 4340 H | 0.43350.0518 | 0.48330.0714 | |
| 4363 [O iii] | 0.05940.0287 | 0.05520.0287 | |
| 4861 H | 1.00000.0739 | 1.00000.0848 | |
| 4959 [O iii] | 1.35220.0939 | 1.25740.0939 | |
| 5007 [O iii] | 3.83270.2218 | 3.56400.2219 | |
| 6300 [O i] | … | … | |
| 6563 H | 2.56510.1519 | 2.43290.1693 | |
| 6583 [N ii] | 0.21770.0374 | 0.20240.0378 | |
| 6717 [S ii] | 0.31420.0410 | 0.29210.0418 | |
| 6731 [S ii] | 0.30370.0430 | 0.28240.0437 | |
| 7136 [Ar iii] | … | … | |
| (H) dex | 0.0000.077 | ||
| (H)a | 0.210.01 | ||
| (H) Å | 51.12.7 | ||
| (abs) Å | 3.851.49 | ||
ain units of 10-14 ergs s-1cm-2.
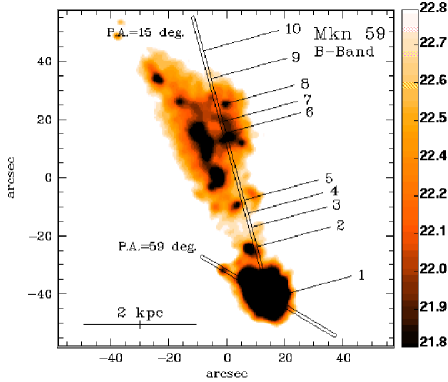
Spectrophotometric observations of Mkn 59 and Mkn 71 were obtained on March 17th and 18th 1994, using the Ritchey–Chrétien spectrograph of the KPNO 4m Mayall telescope. We used a 2″300″ slit with the KPC-10A grating (316 lines mm-1) in first order, with a GG 385 order separation filter which cuts off all second order contamination for wavelengths blueward of 7400Å. This instrumental setup gave a spatial scale along the slit of 069 pixel-1, a scale perpendicular to the slit of 2.7 Å pixel-1, a spectral range of 3500–7500 Å, and a spectral resolution of 5 Å. The seeing was 15 FWHM. Mkn 59 was observed at two slit positions (cf. Figure 6), both centered at the brightest star–forming region with P.A. = 59∘ and P.A. = 15∘ (close to the direction of the major axis). The total exposure time for the first orientation of the slit was 70 minutes and was broken up into four subexposures. At the second slit orientation a single 15 minutes exposure was taken.
Mkn 71 was observed at a slit orientation of P.A. = 77∘ (see Figure 1), centered on the brightest star–forming region (NGC 2363 I). The total exposure time was 29 minutes, broken up into five subexposures. Three Kitt Peak IRS spectroscopic standard stars were observed during each night for flux calibration. The airmasses during all observations were 1.25, therefore a correction for atmospheric dispersion was not necessary. Spectra of He-Ne-Ar comparison lamps were obtained before and after each observation to calibrate the wavelength scale.
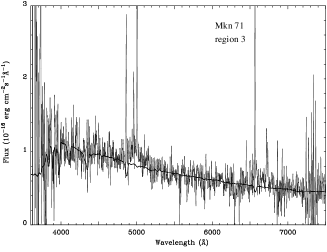
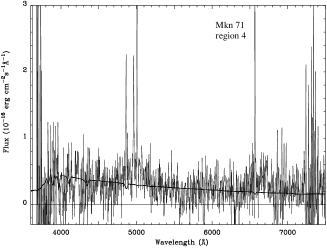
The data reduction was done with the IRAF software package. The two–dimensional spectra were bias–subtracted and flat–field corrected. Then the IDENTIFY, REIDENTIFY, FITCOORD, TRANSFORM, BACKGROUND and CALIBRATE routines were used to perform the wavelength calibration, correction for distortion and tilt, night sky subtraction and flux calibration for each frame. One–dimensional spectra were extracted from the flux–calibrated two–dimensional spectra using the IRAF task APALL. For Mkn 59 we chose ten 7″2″ regions along the major axis of the galaxy (i.e the slit at P.A. = 15∘), the locations of which are indicated in Figure 6. Six of these spectra are shown in Figure 7. From the slit at P.A. = 59∘ the subspectra were extracted at each pixel row along the slit, so that the resulting areas were 0692″ each. For Mkn 71 (see Figure 1), the subspectra from regions 1 and 2 were extracted from 7″2″regions, while for regions 3 and 4 areas of 14″2″ and 28″2″ were used to obtain a sufficiently high . The extracted spectra are shown in Figure 8.
The emission line intensities were measured utilizing a Gaussian profile fitting. All spectra were corrected for interstellar extinction, where the extinction coefficient (H) was derived from the hydrogen Balmer decrement using the equations given in Izotov et al. (itl94 (1994)) and the theoretical hydrogen emission line flux ratios from Brocklehurst (brocklehurst71 (1971)). The variations of (H) along different regions (Tables 3 and 4) arise mainly from observational uncertainties (imperfect focussing at the blue and red ends of the spectra), and from different combinations of Balmer lines that could be reliably measured in each subspectrum to determine the local extinction. While each spectrum was corrected using its individual value of (H), images were extinction–corrected adopting a uniform value of (H)=0.09 and (H)=0.12 for Mkn 59 and Mkn 71, respectively (Guseva et al. guseva98b (2000)).
The electron temperature (O iii) was derived from the observed flux ratio [O iii](4959+5007)/4363. In cases where the [O iii] 4363 emission line was not detected, we used the so–called upper branch of the Edmunds & Pagel (edmunds84 (1984)) calibration of the total oxygen emission line flux [O ii]3727+[O iii](4959 + 5007) vs. the electron temperature to determine and derived the oxygen abundance following van Zee et al. (1998a ).
The observed (()) and corrected (()) emission line fluxes relative to the H emission line fluxes for 3 regions in Mkn 59 (slit P.A. = 15∘) are listed in Tables 3 and 4. The tables contain only the regions where the emission line [O iii]4363 was detected at a that allowed for a reliable flux measurement. Also listed are the extinction coefficient (H), the observed flux of the H emission line and its equivalent width (H) along with the equivalent width of hydrogen absorption lines (abs). The line intensities of the brightest regions (1 and 2) of Mkn 71 are presented in Izotov et al. (itl97 (1997)).
Applying the electron temperature (O iii), ionic abundances of O2+, Ne2+ and Ar3+ were derived. The temperature (O ii) was inferred, according to Izotov et al. (itl94 (1994), izotov96 (1996)), from the relation between (O ii) and (O iii) using H ii region photoionization models by Stasińska (stasinska90 (1990)). From (O ii), the O+ and N+ ionic abundances were determined, while the intermediate value of the electron temperature (S iii) served to derive the ionic abundances of Ar2+ and S2+ (Garnett garnett92 (1992)). The [S ii]6717/6731 ratio was used to determine the electron number density (S ii). Total heavy element abundances were derived after correcting for unseen stages of ionization following Izotov et al. (itl94 (1994), itl97 (1997)) and Thuan et al. (til95 (1995)).
The resulting ionic and heavy element abundances for the 3 H ii regions in Mkn 59 with measured [O iii]4363 are given in Table 5 along with the adopted ionization correction factors (ICF) while the heavy element abundances in the two brightest knots of Mkn 71 are given in Izotov et al. (itl97 (1997)).
| Property | region 1 | region 2 | region 3 |
|---|---|---|---|
| (O iii)(K) | 13,46938 | 13,0693,299 | 13,5582,910 |
| (O ii)(K) | 12,97934 | 12,7623,008 | 13,0272,626 |
| (S iii)(K) | 13,22432 | 12,9162,738 | 13,2932,415 |
| (S ii)(cm-3) | 7910 | 1010 | 536561 |
| O+/H+(105) | 1.5020.012 | 3.0012.164 | 4.2392.571 |
| O++/H+(105) | 8.7570.069 | 6.1524.365 | 5.0953.013 |
| O+3/H+(105) | … | … | … |
| O/H(105) | 10.260.070 | 9.1544.872 | 9.3343.961 |
| 12 + log(O/H) | 8.0110.003 | 7.9620.231 | 7.9700.184 |
| O/Ha | –0.9190.003 | –0.9680.231 | –0.9600.184 |
| N+/H+(107) | 4.9020.040 | 14.2610.28 | 19.9812.12 |
| ICF(N) | 6.83 | 3.05 | 2.20 |
| log(N/O) | –1.4860.006 | –1.3230.550 | –1.3270.455 |
| Ne++/H+(105) | 1.6390.014 | 1.2430.931 | 1.6461.016 |
| ICF(Ne) | 1.17 | 1.49 | 1.83 |
| log(Ne/O) | –0.7280.006 | –0.6950.461 | –0.4910.374 |
| S+/H+(107) | 2.1640.013 | 4.6341.900 | 7.7762.782 |
| S++/H+(107) | 14.850.281 | … | … |
| ICF(S) | 1.89 | … | … |
| log(S/O) | –1.5040.006 | … | … |
| Ar++/H+(107) | 3.4970.023 | 4.6521.738 | … |
| Ar+3/H+(107) | 1.0490.080 | … | … |
| ICF(Ar) | 1.02 | 1.53 | … |
| log(Ar/O) | –2.3460.008 | –2.1080.266 | … |
| Fe++/H+(107) | 1.5050.123 | … | … |
| ICF(Fe) | 8.54 | … | … |
| log(Fe/O) | –1.9020.012 | … | … |
a[X] = logX – logX⊙. Solar abundances are from Anders & Grevesse (anders89 (1989)).


3 Results
3.1 Structural properties of the host galaxies
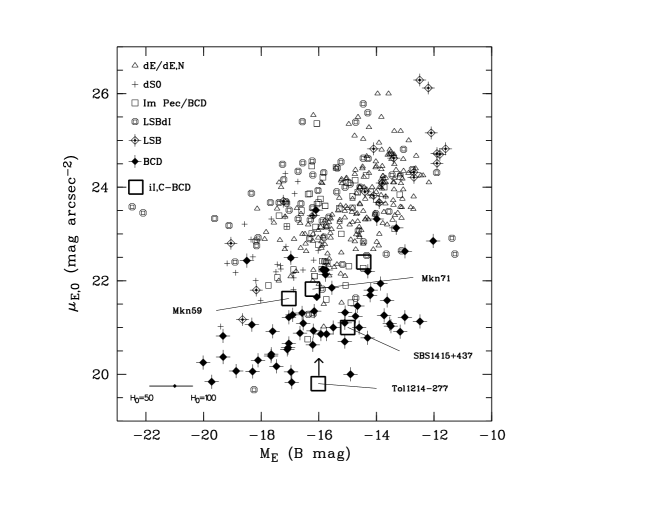
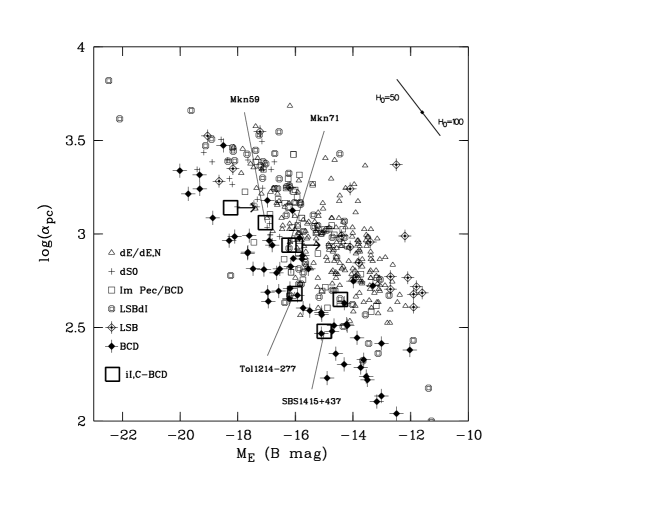
Recent studies have established that the underlying host galaxy of iE/nE BCDs does systematically differ with respect to its central surface brightness and exponential scale length from other classes of dwarf galaxies such as dIs and dEs (P96b , Patterson & Thuan patterson96 (1996), Marlowe et al. marlowe97 (1997), Papaderos papaderosphd (1998), Salzer & Norton salzer98 (1998), Marlowe et al. marlowe99 (1999)). This structural dichotomy is evident from Figure 9 (adopted from Papaderos papaderosphd (1998)) showing that the central surface brightness and exponential scale length of the LSB component of a BCD with an absolute magnitude –16 mag are respectively 1.5 mag brighter and a factor of 2 smaller than in a typical dI/dE of equal luminosity. Although there is no sharp limit, a gap around 22 mag separates the host galaxies of iE/nE BCDs from other classes of dwarf galaxies. The same diagram shows that more luminous BCDs (i.e. systems with a host galaxy brighter than –16 mag in the band) follow the same trend populating systematically different areas in the – and log()––planes than dIs and dEs. In Figure 9 (left panel) we show with open squares the positions of the LSB components of the iI,C BCDs studied here (values derived in the band) along with the ones of the iI,C BCDs SBS 1415+437 (Thuan et al. ti99 (1999)), Tol 1214–277 (Fricke et al. fricke99 (2000)) and UM 417 (Cairós et al. cairos99 (2000)). In the right panel of the same figure we include two further iI,C BCDs for which measurements of the exponential scale length of their LSB components are available, UM 133 (Telles & Terlevich telles97 (1997)) and Mkn 1328 (James james94 (1994)). It may be seen that the iI,C BCDs fit into the gap between typical iE/nE BCDs and dIs/dEs except for SBS 1415+437 and Tol 1214–277 which are indistinguishable from typical BCDs in the – and log()– parameter space.
The uncertain distance to Mkn 59 (cf. Section 1) does not affect the results stated above. As can be seen in both panels of Figure 9, the vector illustrating a shift to the data points due to a change of the Hubble constant is approximately parallel to the sequences of data points for iE/nE BCDs and other types of dwarf galaxies. For a different distance, Mkn 59 therefore remains within the gap between compact BCDs and dIs/dEs.
3.2 Heavy element and line intensity distributions


In Figure 10 we show the spatial intensity distributions
of the H and H lines along with that of the continuum
adjacent to H, as determined from the one–dimensional
spectra extracted along the slit at P.A. = 59∘ of Mkn 59
(cf. Figure 6). It is obvious that all three distributions are spatially coincident.
This is also the case for other nebular emission lines,
including He i, [N ii], [O ii], [O iii]
and [Ne iii], which show the same spatial distribution as
the H and H emission lines.
Wolf–Rayet stars were detected in region No. 1 of both, Mkn 59 and Mkn 71. For Mkn 71, 5 late nitrogen WR stars (WN stars) and 2 early carbon WR stars (WC stars) stars were found. The number of WC stars in Mkn 59 was determined to be 13 and that of WN stars to be 40 (Guseva et al. guseva98b (2000), values adapted to the distances used here). The spatial flux distributions of the blue 4650 and red 5808 WR bumps are shown in the right panel of Figure 10 along with the one of the nebular He ii 4686 emission line. The red bump results primarily from WC stars, the blue bump from WN stars. We remark that the maxima of the H and WR emission are shifted by 1 pixel (0 69) along the slit at P.A. = 59∘ suggesting that the locations of O and WR stars may slightly differ.
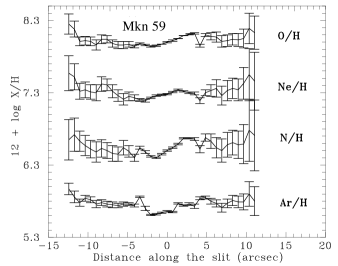
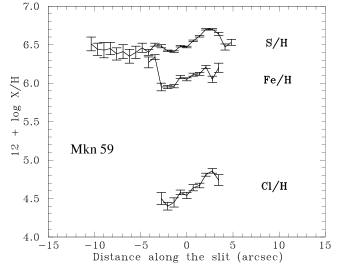
In all one–dimensional spectra of Mkn 59 at P.A. = 59∘ the [O III] 4363 emission line is detected which allows a reliable determination of the electron temperatures and element abundances. Despite the large spatial variations of the oxygen line intensities and their ratios, the oxygen abundance is practically constant over the starburst region within the errors (Figure 11). The abundances of other heavy elements (neon, nitrogen, argon, sulphur, iron and chlorine) show the same, nearly constant spatial distribution along the slit with P.A. = 59∘ through the center of the giant H ii region. In spite of the small abundance variations within the central part, in most cases 0.2 dex, we remark that a weak gradient is present for the abundances of all heavy elements along the slit from –2″ to +3″, i.e. on scales of 260 pc. This suggests a local heavy element enrichment and may be related to the possible displacement of WR stars relative to O stars (see above).
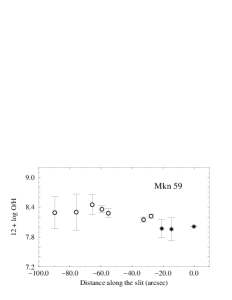
In Figure 12 we show the spatial distribution of the oxygen abundance in Mkn 59 along the major axis with P.A. = 15∘. Three regions where the electron temperature was derived from the [O iii] 4363/(4959 + 5007) flux ratio are indicated by stars, while open circles mark the regions where the [O iii] 4363 line was not detected, thus oxygen abundances were derived following van Zee et al. (1998a ). The latter abundances appear systematically higher compared to those where the electron temperature could be directly constrained utilizing the [O iii] 4363 line. However, the differences are still comparable to the intrinsic uncertainty of the order of 0.2 in log(O/H) ascribed by van Zee et al. (1998a ) to their empirical calibration. Taking this fact into account, as well as the weakness of the [O iii] 4363 line in the outer parts of the galaxy, we shall consider the oxygen abundance as constant over the main body of Mkn 59 with an average value of 12+log(O/H) = 8.0.
The same analysis for Mkn 71 yields for the two brightest regions (regions 1 and 2; Figure 1, right), in which the [O iii]4363 line is observed, heavy element abundances of 12+log(O/H) = 7.79 and 7.77, respectively. The oxygen abundance in the regions 3 and 4 derived from the empirical calibration method described in van Zee et al. (1998a ) is larger by 0.3 dex.
3.3 Population synthesis models
For an analysis of the stellar content of the young ionizing clusters, we used the spectral energy distributions (SEDs) calculated by Schaerer & Vacca (schaerer98 (1998)) for heavy element mass fractions and ages in the range between = 0.001–0.02 and = 0.1 – 10 Myr, respectively. For ages 10 Myr, we calculated a grid of SEDs for stellar populations with ages ranging from 10 Myr to 10 Gyr in time steps of yr0.1 and a heavy element mass fraction of = 0.002, using isochrones from Bertelli et al. (bertelli94 (1994)) and the compilation of stellar atmosphere models from Lejeune et al. (lejeune98 (1998)). An initial mass function (IMF) with a Salpeter slope (2.35) and lower and upper mass limits of 0.6 and 120 was adopted.
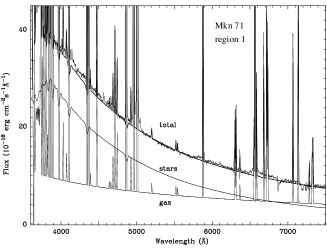
To study the age of the stellar populations in the galaxies and to compare the results of the spectral analysis with broad band photometric data, it is necessary to take into account both the stellar and ionized gaseous emission in the spectra. For this purpose, the stellar SED has to be separated from the gaseous emission following the procedure described by Guseva et al. (guseva98a (1998)) and Papaderos et al. (papaderos98c (1998)). We added stellar SEDs calculated for instantaneous bursts with different ages (“single stellar populations”; SSPs) to the observed gaseous emission SED to match the total SED. The contribution of the gaseous emission was scaled to the stellar emission by the ratio of the observed equivalent width of the H emission line to the equivalent width of H expected for pure gaseous emission. To calculate the gaseous continuum SED at each region along the slit, the observed H flux and the electron temperatures were derived from the respective spectrum. The contributions of bound–free, free–free, and two–photon processes to the continuum emission were then calculated for the spectral range from 0 to 5 m (Ferland ferland80 (1980), Aller aller84 (1984)).
3.4 The ages of the stellar populations
The number of O stars within the giant H ii region complexes at the southeastern tips of Mkn 59 and Mkn 71 was derived from the H flux to 4740 and 2010, respectively, following the prescriptions by Guseva et al. (guseva98b (2000)). As stated in Section 3.2, WR stars were detected in both BCDs, which, together with the large number of O stars, contribute strongly to the total SED. Taking into account the average metallicities, the ages of the brightest H ii regions in which WR stars were detected cannot exceed 4 to 5 Myr (e.g. Schaerer & Vacca 1998).
In Figs. 7 and 8 the modelled stellar SEDs, the gaseous SEDs and their coadded spectral distributions (marked as “total”) are shown superposed on the observed spectra for different regions of the BCDs. For nearly all spectra, a good agreement is achieved between the observed and modelled SEDs. Only in the case of region 2 of Mkn 71 (see Figure 1, right and Figure 8), the agreement is not as good due probably to an imperfectly focussed telescope.
Assuming that the observed gas emission is not caused by local SF, but due to photoionization or shock ionization by SF outside the observed region, the observed SEDs are in some cases reproducible with one SSP of intermediate age (few 108 yr) only; mostly, however, reproducing the observed SEDs required a superposition of SSPs with different ages and mass fractions. Tables 6 and 7 list the ages and relative mass fractions of the old and young SSPs which provide the best fits to the observed SEDs at different slit positions. The models imply respective ages of 4 and 2.9 Myr for the stellar population formed in the bright H ii region complexes in Mkn 59 and Mkn 71 (slit regions 1) while for other slit positions the age of the younger stellar continuum was inferred to few 10 Myr. The ages of the old SSPs could be constrained to 2 Gyr. Within the uncertainties of the methods applied, an upper limit of 3–4 Gyr is possible (see the following subsections), whereas even higher ages appear untenable. One has, however, to keep in mind that present spectrophotometric dating methods cannot definitely rule out the presence of a small fraction of even older stars, which due to their high would barely contribute to the SED.
| region | log | relative mass | log | relative mass | ||||
|---|---|---|---|---|---|---|---|---|
| a) Stellar and gaseous emission | ||||||||
| 1 | 6.6 | 0.7 | 9.0 | 0.3 | 0.17 | –0.01 | –0.32 | 0.12 |
| 2 | 6.9 | 0.6 | 9.3 | 0.4 | 0.03 | 0.09 | –0.03 | 0.64 |
| 3 | 8.7 | 1.0 | … | … | 0.29 | 0.52 | 0.28 | 1.93 |
| 4 | 7.4 | 0.1 | 9.3 | 0.9 | 0.21 | 0.42 | 0.25 | 1.59 |
| 5 | 7.4 | 0.1 | 9.3 | 0.8 | 0.28 | 0.44 | 0.16 | 1.46 |
| 6 | 7.0 | 0.3 | 9.3 | 0.7 | 0.04 | 0.21 | 0.24 | 1.39 |
| 7 | 8.7 | 1.0 | … | … | 0.28 | 0.58 | 0.30 | 2.03 |
| 8 | 7.4 | 1.0 | … | … | 0.05 | 0.24 | 0.27 | 1.54 |
| 9 | 7.0 | 0.1 | 9.3 | 0.9 | 0.11 | 0.30 | 0.28 | 1.51 |
| 10 | 8.3 | 1.0 | … | … | 0.15 | 0.33 | 0.32 | 1.90 |
| b) Stellar emission | ||||||||
| 1 | 6.6 | 0.7 | 9.0 | 0.3 | –0.15 | –0.17 | 0.00 | 0.20 |
| 2 | 6.9 | 0.6 | 9.3 | 0.4 | –0.04 | 0.02 | 0.11 | 0.70 |
| 3 | 8.7 | 1.0 | … | … | 0.28 | 0.54 | 0.39 | 2.08 |
| 4 | 7.4 | 0.1 | 9.3 | 0.9 | 0.18 | 0.43 | 0.33 | 1.70 |
| 5 | 7.2 | 0.2 | 9.3 | 0.8 | –0.01 | 0.11 | 0.19 | 1.22 |
| 7 | 8.7 | 1.0 | … | … | 0.28 | 0.54 | 0.39 | 2.08 |
| region | log | relative mass | log | relative mass | ||||
|---|---|---|---|---|---|---|---|---|
| a) Stellar and gaseous emission | ||||||||
| 1 | 6.46 | 1.0 | … | … | 0.26 | 0.04 | –0.58 | 0.07 |
| 2 | 6.6 | 0.15 | 9.3 | 0.85 | 0.03 | 0.13 | –0.14 | 0.62 |
| 3 | 6.6 | 0.02 | 9.0 | 0.98 | 0.30 | 0.57 | 0.40 | 2.09 |
| 4 | 8.7 | 1.0 | … | … | 0.28 | 0.54 | 0.39 | 2.08 |
| b) Stellar emission | ||||||||
| 1 | 6.4 | 1.0 | … | … | –0.19 | –0.25 | –0.08 | –0.42 |
| 2 | 6.6 | 0.15 | 9.3 | 0.85 | –0.07 | –0.03 | 0.09 | 0.67 |
3.4.1 Uncertainties of the population synthesis models
The goodness of the spectral fits was found to sensitively depend on the mass fraction and ages of the adopted young and old SSPs. For instance, for region 1 of Mkn 59, increasing the age of the young SSP from 4 to 5 Myr yielded a satisfactory fit, but a 6 Myr old SSP resulted in systematic residuals between the observed and modelled SED. The age of the old SSPs could be constrained with an accuracy of 1 Gyr at slit regions where young stellar sources provide a minor contribution to the light (regions 3, 7 and 10 in Mkn 59 and region 3 in Mkn 71). In e.g. region 7 of Mkn 59, old SSPs up to 2 Gyr could still reproduce the observed SED, while already a 3 Gyr old SSP produced obvious residuals to the observed spectrum. A comparison of the observed and modelled H yielded further constraints to resolve ambiguities between different SED solutions. The assumption of high ages for the old SSP requires an increased contribution by the young SSP to reproduce the blue continuum, which in turn results in too high H as compared to the observed value.
Given that the metallicities of the stellar populations in BCDs may be lower than those of the ionized gas (Calzetti calzetti97 (1997), Guseva et al. guseva98a (1998), Mas–Hesse & Kunth mashesse99 (1999)), we computed a set of models varying the metallicity of the SSPs around 0.002 by 0.5 dex, the smallest stepsize our model libraries allowed. Models computed on the assumption of a metallicity other than 0.002 failed to adequately reproduce the observed spectrum, suggesting that the metallicity of the ionized gas is similar to that of the stellar population.
Alternatively, to constrain the age of the underlying galaxies, not only an instantaneous burst was considered, but also an extended episode of moderate SF at a constant rate. This way, the presumably complex formation histories of the galaxies were bracketed between two limiting cases.
In the same way as described in Section 3.3, a grid of model SEDs was calculated for stellar populations that were formed in extended SF episodes which started and ended at different times. The best–fitting solutions for e.g. Mkn 71 correspond to a formation episode of the underlying galaxy which started 2 Gyr ago and ended 10 Myr ago. Within the uncertainties, a SF episode that began up to 3 Gyr ago is possible; higher ages of the underlying galaxies would require a very recent ( Myr ago) termination of their formation episode to reproduce the observed SEDs. Such a recently ongoing SF activity in the underlying galaxy in Mkn 71 can be rejected from the colour–magnitude diagrams (Figure 4); in the left panel (a), obtained at the starburst region NGC 2363, stars are absent between the actual burst (younger than 10 Myr) and the last SF episode of the underlying galaxy which seems to have occurred more than 20 Myr ago (note the red supergiants at the tip of the 25 Myr isochrone). Also in the right panel (b), no stars much younger than 20 Myr are present. This indicates that, in the galaxy underlying the starburst, no significant SF occured during the last 20 Myr, in agreement with the ground–based CMDs by Aparicio et al. (1995). A similar analysis for Mkn 59 indicates, within the unvertainties, an upper age limit of 4 Gyr.
3.4.2 Consistency with imaging data; further implications
The (H) of region 1 in Mkn 59 and Mkn 71 amount to 150Å (Table 3) and 316Å(Izotov et al. 1997), respectively. For these regions the broad band colours calculated from the synthetic SEDs, including and ignoring gaseous emission (Tables 6 and 7) differ from each other by up to 0.5 mag. This demonstrates that a reliable dating of stellar populations within a starburst environment requires a correction for the colour shift induced by ample gaseous emission.
The consistency of the observed broad band colours with the spectral population synthesis results was checked by extracting the areas covered by the spectrograph slits from the colour maps of Mkn 59 and Mkn 71 (cf. Section 2.1.1). Figure 13 shows the modelled and observed colours along the slits after the latter were transformed to the Johnson–Cousins system (Bessell bessell90 (1990)).

Generally, the observed and synthesized colours agree well with each other (within 1 uncertainties), given that i) the synthesized colours are averaged values over regions covering several arcsec length along the slit, and ii) a minor displacement between the positions of a region in the colour map and of the slit may significantly alter the observed colours (see Figure 6 and the 1–variations of the observed colours in Figure 13), as the H ii regions are typically very compact.
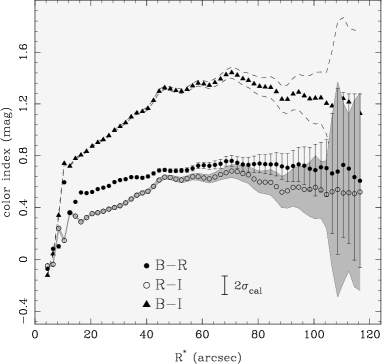
Transforming the colours of the LSB component as derived from the colour profiles (Figure 3) to the Johnson–Cousins system yields a 0.6 for Mkn 59 and Mkn 71. This is in good agreement with the upper limits of the colours derived from the spectra (cf. Tables 6 and 7). The constancy of the colour profiles for photometric radii where the starburst light contribution becomes negligible (i.e. for ) indicates that in the underlying galaxies population gradients are absent. Therefore, the upper age limits as being derived for either BCD along the spectrograph slits can be considered to be valid for the entire underlying galaxy.
4 Discussion
4.1 The metallicity distribution
Compared to BCDs in general, which show a metallicity distribution that peaks around 1/10 and steeply decays towards lower metallicities (Kunth & Sargent kunth86 (1986)), the metal abundances of Mkn 59 () and Mkn 71 () are not exceptional. The nearly constant metallicity along the major and minor axes of Mkn 59, as well as along the minor axis of Mkn 71 (Figs. 11 and 12; see also González–Delgado et al. gonzalez94 (1994)), suggests that large–scale mixing processes in the ISM of both BCDs were at work on time scales of a few 106 yr. Otherwise, one would expect measurable metallicity enhancements in the vicinity of regions of ongoing or recent SF. Furthermore, the transport of metal–enriched warm and hot gas on scales of up to 1 kpc from the starburst region, an observational signature of which is the formation of supergiant shells, is commonly seen in the ISM of star–forming dwarf galaxies (cf. e.g. Marlowe et al. marlowe95 (1995), Hunter & Gallagher hunter97 (1997), Bomans et al. bomans97 (1997), Brinks & Walter brinks98 (1998), Papaderos & Fricke papaderos98a (1998), Strickland & Stevens strickland99 (1999); cf. also Figure 2, this work). The dilution of heavy elements in the vicinity of starburst regions may even be powered by galactic outflows. These were predicted by numerical models to develop within dwarf galaxies (Vader vader86 (1986), De Young & Gallagher deyoung90 (1990), De Young & Heckman deyoung94 (1994), Mac Low & Ferrara maclow99 (1999)) and proved necessary to account for the much lower metallicities observed in BCDs with respect to those predicted from closed–box evolutionary synthesis models (Krüger krueger92 (1992), Lisenfeld & Ferrara lisenfeld98 (1998)). The development of such a large–scale perturbation of the ambient gaseous component does not appear unreasonable given the high–velocity ( 103 km sec-1) gaseous motions revealed spectroscopically by Izotov et al. (izotov96 (1996)) and Roy et al. (roy91 (1991), see also Figure 2, this work) in Mkn 59 and Mkn 71, respectively.
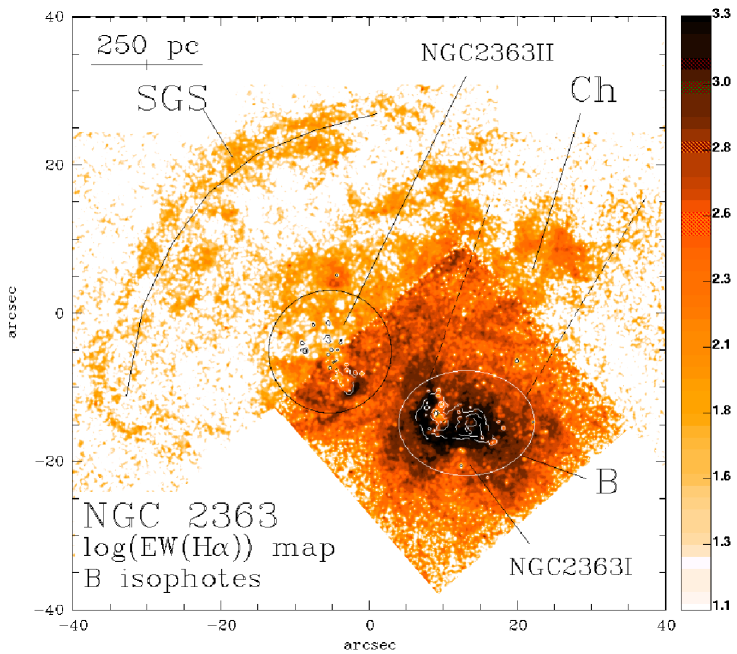
The small variations of the heavy element abundances along the giant H ii region complex of Mkn 59 (Section 3.2), as well as the possible spatial offset of the O– and WR stars, may be explained by a relocation of SF processes within a time span of few Myr. Propagating SF on a linear scale of 400 pc within the last 10 Myr has also been suggested by Drissen et al. (drissen99 (1999)), to account for the age differences of the young star clusters NGC 2363 I and II within Mkn 71.
4.2 Morphology vs. structural properties and age
The two iI,C BCDs investigated here appear similar with respect to the age and structure of their exponentially distributed host galaxies. This raises the question of whether the entire class of iI,C BCDs shares, besides a morphological resemblance, a set of common physical properties, such as an intermediate age and structural properties bridging the gap between iE/nE BCDs and dIs/dEs. A literature search for data on other nearby cometary BCDs does indeed provide some support to this hypothesis.
Mkn 1328VCC 1374: NIR surface photometry (James james94 (1994)) yields an exponential scale length of =0.88 kpc for its LSB component. With its integrated absolute -magnitude of –16 mag, and taking into account that a burst raises the luminosity of a BCD by typically 0.75 mag (P96b , Salzer & Norton salzer98 (1998)), Mkn 1328 resides presumably in between the parameter spaces populated by BCDs and dIs in the log()––plane (cf. Figure 9). From the integral colour of 0.6 mag, the age of its host galaxy may be estimated to 6 Gyr, following the predictions by Krüger (krueger92 (1992)) and Krüger et al. (krueger95 (1995)) when a burst parameter 0.01 is adopted. The metallicity was determined to 1/8 (Kinman & Davidson kinman81 (1981)).
UM 133: For the observed metallicity (1/17 , Telles telles95 (1995)), the integral colour of 0.4 mag derived by Telles & Terlevich (telles97 (1997)) is consistent with an age of 4 Gyr. With =–18.25, and an exponential scale length of =1.39 kpc for its LSB component (Telles & Terlevich telles97 (1997)), this object falls also into the gap between BCDs and dIs.
UM 417 ( 1/13 ; Campos–Aguilar at al. campos93 (1993)). Surface photometry of the LSB component yields an intermediately compact structure, too ( 0.45 kpc, –14.4 mag and 22.4 mag; Cairós et al. cairos99 (2000)). The same authors deduce a color for the LSB component of 0.5 mag, compatible with an age of few Gyr.
SBS 1415+437 (Thuan, Izotov & Foltz ti99 (1999)): With a probable age of 100 Myr and an extremely low metallicity (1/21), this galaxy is a young galaxy candidate. Its LSB component, however, does not fit within the structural gap between BCDs and dIs; with =21.0 mag, =0.30 kpc and =–14.95 mag, it is rather comparable to a compact BCD. On the other hand, as this object apparently still undergoes its first major episode of SF, it is likely that its stellar LSB component has not yet been fully built but, as suggested by the age gradient along its major axis, delineates the trail along which SF has occurred.
Tol 1214–277: Similar to SBS 1415+437, this is an extremely low–metallicity iI,C BCD (23, Terlevich et al. terlevich91 (1991)). Recent surface photometry studies with the VLT (Fricke et al. fricke99 (2000)) yield 0.48 kpc and –16 mag. The average colours of the LSB component, –0.4 mag and +0.3 mag, suggest an unevolved galaxy with an age of few 108 yr.
The examples given above call for a further investigation of the following two hypotheses:
(i) Cometary BCDs are relatively young objects, with ages not exceeding a few Gyr, thus systematically younger than the majority of BCDs classified iE/nE.
(ii) Except for the candidate young extremely metal–deficient galaxies ( yr) among them, cometary BCDs show structural properties of their host galaxies being typically intermediate between those of iE/nE BCDs and dIs/dEs.
Provided that the above hypotheses will be strengthened by an investigation of a larger sample of nearby iI,C BCDs, one may expect the iI,C morphology to occur more frequently in dwarf objects at higher redshifts. Indeed, examples of high- galaxies displaying a comet–like morphology have frequently been reported (cf. e.g. Dickinson dickinson96 (1996) for a galaxy cluster at =1.15). Furthermore, a few medium-redshift objects with cometary morphology were included in the sample of Gúzman et al. (guzman98 (1998), Figure 1), notably the Faint Blue Galaxy (FBG) HERC 13088, at a redshift =0.436. With a total luminosity of =–21.5 mag and an exponential scale length 2.8 kpc, this galaxy appears an upscaled version of the nearby iI,C BCDs studied here. It is worth noting that the rest–frame colours of the LSB host of the latter FBG, 0.35 mag, also suggest an age of 5 Gyr.
These findings provide support to the hypotheses proposed in Section 1, namely that a strong off–center burst ontop a dwarf LSB component as observed in iI,C BCDs is primarily not a stochastic event but occurs in systems considerably younger than iE/nE BCDs, probably differing from the latter with regard to their structural properties. These results emphasize the need for a detailed investigation of the processes leading to the development of iI,C morphology in dwarf galaxies. We shall briefly remark on that issue in the next section.
4.3 An elongated structure of high gas density?
In the majority of BCDs, the centrally concentrated H ii complexes where massive SF takes place are typically found to almost coincide with maxima in the surface density of an extended H i envelope (Taylor et al. taylor94 (1994), Simpson simpson95 (1995), van Zee et al. 1998b ). Since a high gas density is necessary to sustain SF, such a condition is expected to be fulfilled near the end of the stellar body of an iI,C BCD. Age gradients of the star–forming regions along the stellar body’s major axis seem to be frequent attributes of such a system (Barth et al. barth94 (1994); Aparicio et al. aparicio95 (1995); Thuan et al. ti99 (1999)). These may be plausibly explained as due to propagation of SF activity (cf. Thuan et al. thuan87 (1987)) along the major axis of an elongated H i body.
Given these observational results, it seems that the H i halos of iI,C BCDs have elongated central concentrations with major axes that coincide with those of the stellar bodies. Indeed, low–resolution H i maps of Mkn 59 (Wilcots et al. wilcots96 (1996)) and Mkn 71 (Wevers et al. wevers86 (1986)) show the stellar components to follow prolate central concentrations within elongated H i clouds. A similar distribution of the gaseous halo does not seem rare among magellanic irregulars (Wilcots et al. wilcots96 (1996)) and has been interferometrically mapped also in BCDs in different evolutionary stages (see e.g. II Zw 40, van Zee et al. 1998b , and I Zw 18, van Zee et al. 1998c ). Moreover, the young BCD SBS 0335–052 (Izotov et al. izotov90 (1990)) is forming within an elongated gas cloud with a probably primordial chemical composition (Thuan & Izotov ti97 (1997), Lipovetsky et al. lipovetsky99 (1999)).
It might be argued that stellar bodies and H i concentrations of iI,C BCDs merely represent edge–on disks, as suggested by the slow rotation found for the H i envelopes of Mkn 59 and Mkn 71 as well as for the ionized gas of SBS 1415+437 (Thuan et al. ti99 (1999)). The generally exponential surface brightness profiles of their stellar LSB hosts (cf. Figure 3) do not serve as a proof of a disk structure (Freeman freeman70 (1970)), since exponential SBPs are also observed for e.g. small spheroidal systems (Binggeli et al. binggeli84 (1984)) and bars in late–type spirals (Elmegreen et al. elmegreen96 (1996)). However, the assumption of edge–on disks would demand the presence of numerous less–inclined iI,C BCDs, i.e. relatively blue disks with a single starburst in their outskirts, in contradiction to morphological studies of dwarf galaxies.
4.3.1 iI,C systems vs. old iE/nE BCDs
Considering that only little data is available for BCDs with morphological types other than iE/nE, the construction of a tentative age–morphology sequence for gas–rich dwarf galaxies appears premature. The evolution of the different types of dwarf galaxies as well as their possible relations among each other are still sketchy, especially the triggering and effects of starbursts as well as the role of the Dark Matter (see Thuan thuan85 (1985), Davies & Phillipps davies88 (1988), P96b , Meurer meurer98 (1998), Swaters swaters98 (1998), Marlowe et al. marlowe97 (1997), marlowe99 (1999); van Zee et al. 1998b , Gil de Paz et al. gildepaz99 (1999)).
However, we argue that their relatively low ages would make iI,C BCDs a possible link between the extremely young ( 100 Myr) dwarf galaxy candidates, most of which belong to the i0 class, and the evolved iE/nE BCDs, for which a lower age limit of 2 Gyr has been invariably derived (Krüger & Fritze–v.Alvensleben krueger94 (1994), Noeske noeske99 (1999)). In the young BCDs investigated thus far, a propagation of the SF activity has been observed (Papaderos et al. papaderos98c (1998), Izotov et al. izotov99 (1999), Thuan et al. ti99 (1999)). Thereby, it is conceivable that after a period of several 108 yr, these objects will gradually develop a cometary morphology with the youngest and most active star–forming regions located at one end of an elongated stellar body.
5 Summary and conclusions
Aiming at a better understanding of the different morphological subclasses of Blue Compact Dwarf Galaxies (BCDs) in the context of the evolution of star–forming dwarf galaxies, we have started a study of the “cometary” (iI,C ) subclass of BCDs. Contrary to the majority of BCDs where SF is confined to the inner part of an old circular or elliptical stellar LSB host, iI,C BCDs exhibit intense starburst activity close to one end of an elongated irregular LSB component. This intriguing morphology prompts two hypotheses: (i) iI,C BCDs are in fact dwarf irregulars (dIs) observed during a major stochastic enhancement of their otherwise moderate SF activity and (ii) a set of physical properties of the gaseous and stellar components favours the ignition of a burst with an amplitude comparable to that typically observed in other BCDs at the outskirts of an older LSB component.
For the two nearby cometary BCDs Markarian 59 and Markarian 71, a variety of deep ground–based and HST photometric and spectrophotometric data are available. To investigate the structural properties of the LSB component we derived surface brightness profiles (SBPs), corrected for systematic effects which can be important at low levels. Photometric properties of the underlying host galaxy and the superposed starburst component were derived by fitting a simple decomposition scheme to the SBPs; the radial extent of the starburst component as derived from this profile decomposition was verified using H– and colour maps. The spatial distributions of heavy element abundances in the starburst regions and over the main stellar body were derived using long–slit spectra. After the superposed emission by ionized gas had been semi–empirically modelled and subtracted from the original spectra, a population synthesis analysis was carried out at several positions along each slit to derive the properties of the underlying young and older stellar continuum. For Mkn 71 we also derived colour–magnitude diagrams from HST data. The main findings of our analysis may be summarized as follows:
1. The azimuthally averaged intensity distribution of the underlying LSB host galaxy of both iI,C BCDs can be approximated by an exponential fitting law with a central surface brightness and a linear scale length intermediate between those typically inferred for iE/nE BCDs and dIs/dEs.
2. Spectral synthesis modeling of the starburst region and the main body implies the presence of an older population with a most probable age 2 Gyr for the underlying host galaxies of Mkn 59 and Mkn 71. Ages up to 4 Gyr for Mkn 59 and 3 Gyr for Mkn 71 are tenable within the model uncertainties, but higher values are unlikely.
3. The average oxygen abundances were determined to be 12+log(O/H)=8.0 (1/8 ) for Mkn 59 and 12+log(O/H)=7.8 (1/14 ) for Mkn 71, which are typical among BCDs. In addition, the metallicity distribution as derived for various elements in the vicinity of the starburst regions and along the major axis of the LSB-body shows only small scatter ( 0.2 dex), suggesting that mixing of heavy elements has been efficient.
The similarity of the two objects with respect to the ages and structural properties of their LSB components motivated a search for published data on other cometary BCDs. We found that five objects for which the required data are available share similar properties with Mkn 59 and Mkn 71 with respect to the results (1) – (2). These findings suggest that the specific starburst morphology observed in iI,C BCDs comes along with distinct physical properties of their LSB host galaxies, i.e. is not attributable to stochastic processes only. Hypotheses which we consider worth investigating are:
(i) Cometary BCDs are relatively young objects, with ages not exceeding a few Gyr, thus systematically younger than “classical” BCDs of type iE/nE. If true, the development of iI,C morphology may represent a late evolutionary stage of an i0 BCD before it gradually assumes iE/nE–characteristics.
(ii) The underlying host galaxies of iI,C BCDs with an age 1 Gyr are moderately compact, in the sense that they show central surface brightnesses and exponential scale lengths intermediate between those typically derived for iE/nE BCDs and dIs/dEs.
The strongly extranuclear location of the starburst regions and the signatures of propagating star–forming activity along the main stellar body of an iI,C BCD suggest that the surface density distribution of cold H i gas in these systems resembles the optical morphology; published H i maps support this assumption. Spatially resolved interferometric studies will be of major importance for assessing the intrinsic processes regulating SF in iI,C BCDs and exploring possible evolutionary links to “classical” iE/nE BCDs.
Acknowledgements.
N.G.G. and Y.I.I. thank the Universitäts–Sternwarte of Göttingen for warm hospitality. We acknowledge the support of Volkswagen Foundation Grant No. I/72919. Research by K.G.N, P.P. and K.J.F. has been supported by Deutsche Forschungsgemeinschaft (DFG) grant FR 325/50–1, Deutsche Agentur für Raumfahrtangelegenheiten (DARA) GmbH grants 50 OR 9407 6 and 50 OR 9907 7. We thank the referee, Dr. R.C. Dohm–Palmer, for helpful comments and suggestions and C. Möller for providing us with a calibration spectrum. P. Papaderos thanks K. Bischoff for his assistance during the observations at Calar Alto. T.X. Thuan thanks the partial financial support of NSF grant AST–9616863.References
- (1) Aller, L. H. 1984, Physics of Thermal Gaseous Nebulae (Dordrecht: Reidel)
- (2) Anders, E., Grevesse, N. 1989, Geochim. Cosmochim. Acta 53, 197
- (3) Aparicio, A., Cepa, J., Gallart, C., et al., 1995, AJ 110, 212
- (4) Babul, A., Rees, M.J., 1992, MNRAS 255, 346
- (5) Barth, C.S., Cepa, J., Vilchez, J.M., and Dottori, H.M., 1994, AJ 108, 2069
- (6) Bertelli, G, Bressan, A., Chiosi, C., Fagotto, F., Nasi, E., 1994, A&AS 106, 275
- (7) Bessell, M.S., 1990, PASP 102, 1181
- (8) Bessell, M.S., Castelli, F., Plez, B., 1998, A&A 333, 231
- (9) Binggeli, B., Cameron, L.M., 1991, A&A 252, 27
- (10) Binggeli, B., Cameron, L.M., 1993, A&AS 98, 297
- (11) Binggeli, B., Sandage, A., Tarenghi, M., 1984, AJ 89, 64
- (12) Bomans, D.J., Chu, Y.–H., Hopp, U., 1997, AJ 113, 1678
- (13) Bothun, G.D., Impey, C.D., Malin, D.F., 1991, ApJ 376, 404
- (14) Brinks, E., Walter, F., 1998, in ”The Magellanic Clouds and Other dwarf Galaxies”, Braun, J.M., Richtler, T. (eds.). Bonn: Shaker Verlag, p.1
- (15) Brocklehurst, M. 1971, MNRAS 153, 471
- (16) Cairós, L.M., Vílchez, J.M., González–Pérez, J.N., Iglesias–Páramo, J., 2000, submitted
- (17) Caldwell, N., Bothun, G.D., 1987, AJ 94, 1126
- (18) Calzetti, D., 1997, in “The Ultraviolet Universe at Low and High Redshift: Probing the Progress of Galaxy Evolution”, W.H. Waller et al. (eds.), AIP conference proceedings, v. 408, 403
- (19) Campos-Aguilar, A., Moles, M., Masegosa, J., 1993, AJ, 106, 1784
- (20) Carignan, C., Beaulieu, S., 1989, ApJ 347, 760
- (21) Christian, C.A., Adams, M., Barnes, J.V., et al., 1985, PASP 97, 363
- (22) Davies, J.I., Phillips, S., 1988, MNRAS, 23, 553
- (23) De Young, D.S., Gallagher, J.S., 1990, ApJ 356, L15
- (24) De Young, D.S., Heckman, T.M., 1994, ApJ 431, 598
- (25) Dickinson, M., 1996, in ”HST and the High Redshift Universe”, N. Tanvir, A. Aragon–Salamanca, J.V. Wall (eds.), World Scientific, London (astro-ph/9612178)
- (26) Dottori, H.M., Cepa, J., Vilchez, J.M., and Barth, C.S., 1994, A&A 283, 753
- (27) Doublier, V., Comte, G., Petrosian, A., et al., 1997, A&AS 124, 405
- (28) Drinkwater, M., Hardy, E., 1991, AJ 101, 94
- (29) Drissen, L., Roy, J.R., Robert, C., Devost, D., Doyon, R., 2000, AJ 119, 688
- (30) Edmunds, M. G., Pagel, B. E. J. 1984, MNRAS 211, 507
- (31) Elmegreen, B.G., Elemgreen, D.M., Chromey, F.R., Hasselbacher, D.A., Bissel, B.A., 1996, AJ 111, 2233
- (32) Ferland, G. J., 1980, PASP 92, 596
- (33) Freeman, K.C., 1970, ApJ 160, 811
- (34) Fricke, K.J., Papaderos, P., Izotov, Y.I., Thuan, T.X., 2000, in prep.
- (35) Garnett, D. R. 1992, AJ 103, 1330
- (36) Gil de Paz, A., Zamorano, J., Gallego, J., 1999, MNRAS 306, 975
- (37) González–Delgado, R.M., Pérez, E., Tenorio–Tagle, G., et al., 1994, ApJ 437, 239
- (38) Guseva, N.G., Izotov, Y.I., Thuan, T.X., 1998, Kinematics and Physics of Celestial Bodies 14, N1, 41
- (39) Guseva, N.G., Izotov, Y.I., Thuan, T.X., 2000, ApJ, in press
- (40) Guzmán, R., Jangren, A., Koo, D.C., Bershady, M.A., Simard, L., 1998, ApJ 495, L13
- (41) Heckman, T.M. et al. 1998, ApJ 503, 646
- (42) Holtzman, J., et al., 1995a, PASP 107, 156
- (43) Holtzman, J., et al., 1995b, PASP 107, 1065
- (44) Hopp. U., Schulte–Ladbeck, R.E., 1991, A&A 248, 1
- (45) HST Data Handbook, Update version 3.1, March 1998, Space Telescope Science Institute, available at: http://www.stsci.edu/documents/data-handbook.html
- (46) Hunter, D.A., Elemegreen, B.G., Baker, A.L., 1998, ApJ 493, 595
- (47) Hunter, D.A., Gallagher, J.S. III, 1997, AJ 475, 65
- (48) Izotov, Y.I., Dyak, A.B., Chaffee, F.H., Foltz, C.B., Kniazev, A.Y., Lipovetsky, V.A., 1996, ApJ 458, 524
- (49) Izotov, Y.I., Guseva, N.G., Lipovetsky, V.A., Kniazev, A.Y., Stepanian, J.A., 1990, Nature 343, 238
- (50) Izotov, Y.I., Papaderos, P., Thuan, T.X., Fricke, K.J., Foltz, C.B., Guseva, N.G., 1999, preprint (astro-ph/9907082)
- (51) Izotov, Y.I., Thuan, T.X., 1999, ApJ 511, 639
- (52) Izotov, Y.I., Thuan, T.X., Lipovetsky, V.A. 1994, ApJ 435, 647
- (53) Izotov, Y.I., Thuan, T.X., Lipovetsky, V.A. 1997, ApJS 108, 1
- (54) James, P.A., 1994, MNRAS 269, 176
- (55) Kaler, J.B., 1983, ApJ 264, 594
- (56) Kennicutt, R., Balick, B., Heckman, T, 1980, PASP 92, 134
- (57) Kinman, T.D., Davidson, K., 1981, ApJ 243, 127
- (58) Koo, D.C., Guzman, R., Gallego, J., 1997, ApJ 478, L49
- (59) Krüger, H., 1992, PhD Thesis, Universität Göttingen
- (60) Krüger, H., Fritze–v.Alvensleben, 1994, A&A 284, 793
- (61) Krüger, H., Fritze–v.Alvensleben, U., Loose, H.–H., 1995, A&A 303, 41
- (62) Kunth, D., Maurogordato, S., Vigroux, L., 1988, A&A 204, 10
- (63) Kunth, D., Sargent, W.L.W., 1986, ApJ 300, 496
- (64) Lejeune, T., Cuisinier, F., Buser, R., 1998, A&AS 130, 65
- (65) Lipovetsky, V.A., Chaffee, F.H., Izotov, Y.I., et al., 1999, ApJ 519, 177
- (66) Lisenfeld, U., Ferrara, A., 1998, ApJ 496, 145
- LT (85) Loose, H.-H., Thuan, T.X., 1985, in ”Star–Forming Dwarf Galaxies and Related Objects”, Kunth, D., Thuan, T.X., Van, T.T. (eds.). Paris: Editions Frontières, p.73 (LT85)
- (68) Loose, H.–H., Thuan, T.X., 1986, ApJ 309, 59
- (69) Mac Low, M.–M., Ferrara, A., 1999, ApJ 513, 142
- (70) Marlowe, A.T., Heckman, T.M., Wyse, R.F.G., Schommer, R., 1995, ApJ 438, 563
- (71) Marlowe, A.T., Meurer, G.R., Heckman, T.M., 1999, ApJ 522, 183
- (72) Marlowe, A.T., Meurer, G.R., Heckman, T.M., Schommer, R., 1997, ApJS 112, 285
- (73) Mas–Hesse, J.M., Kunth, D., 1999, A&A 349, 765
- (74) Méndez, D.I., Cairós, L.M., Esteban, C., Vílchez, J.M., 1999, AJ 117, 1688
- (75) Meurer, G.R., 1998, astro-ph/9806304
- (76) Murakami, I., Babul, A., 1999, MNRAS 309, 161
- (77) Noeske, K.G., 1999, Diploma Thesis, Universität Göttingen
- (78) Noeske, K.G., Cairós Barreto, L.M., Papaderos, P., Vílchez, J.M., Fricke, K.J., 1999a, in ”The Evolution of Galaxies on Cosmological Timescales”, J. Beckman and T. Mahoney (eds.), ApSS (in press)
- (79) Noeske, K.G., Papaderos, P., Fricke, K.J., Thuan, T.X., 1998, in ”The Magellanic Clouds and Other dwarf Galaxies”, Braun, J.M., Richtler, T. (eds.). Bonn: Shaker Verlag, p.279
- (80) Papaderos, P., 1998, PhD Thesis, Universität Göttingen
- (81) Papaderos, P., Fricke, K.J. 1998, in the proc. of ”Highlights in X-ray Astronomy”, Garching 1998, B. Aschenbach et al. (eds.), in press (astro-ph/9810101)
- (82) Papaderos, P., Izotov, Y.I., Fricke, K.J., Thuan, T.X., Guseva, N.G., 1998, A&A 338, 43
- (83) Papaderos, P., Loose, H.-H., Fricke, K.J., Thuan, T.X., 1996b, A&A 314, 59 (P96b)
- (84) Papaderos, P., Loose, H.-H., Thuan, T.X., Fricke, K.J., 1996a, A&AS 120, 207 (P96a)
- (85) Patterson, R.J., Thuan, T.X., 1996, ApJS 107, 103
- (86) Pustilnik, S.A., Thuan, T.X., Brinks, E., Lipovetsky, V.A., Izotov, Y.I., 1999, in prep.
- (87) Richter, G.M., Lorenz, H., Bohm, P., Priebe, A., 1991, Astron.Nachr. 312, 345
- (88) Roy, J.R., Boulesteix, J., Joncas, G., Grundseth, B., 1991, ApJ 367, 141
- (89) Salzer, J.J., MacAlpine, G.M., Boroson, T.A., 1989, ApJS 70, 479
- (90) Salzer, J.J., Norton, S.A., 1998, in: IAU Coll. 171, in press (astro-ph/9810338)
- (91) Sandage, A., Tammann, G.A., 1976, ApJ 210, 7
- (92) Sargent, W.L.W., Searle, L., 1970, ApJ 162L, 155
- (93) Savage, B.D., Mathis, J.S., 1979, ARA&A 17, 73
- (94) Schaerer, D., Vacca, W. D. 1998, ApJ 497, 618
- (95) Simpson, C.E., 1995, PhD Thesis, Univ. of Florida
- (96) Stasińska, G., 1990, A&AS 83, 501
- (97) Strickland, D.K., Stevens, I.R., 1999, MNRAS 306, 43
- (98) Swaters, R., 1998, in ‘Dwarf Galaxies and Cosmology’, eds. T.X. Thuan, C. Balkowski, V. Cayatte, J. Tran Thanh Van, in press
- (99) Taylor, C.L., Brinks, E., Pogge, R.W., Skillman, E.D., 194, AJ 107, 971
- (100) Telles, E., 1995, PhD Thesis, Cambridge
- (101) Telles, E., Terlevich, R., 1997, MNRAS 286, 183
- (102) Terlevich, R., Melnick, J., Masegosa, J., Moles, M., Copetti, M.V.F., 1991, A&AS 91, 285
- (103) Thuan, T.X., 1985, ApJ 299, 881
- (104) Thuan, T.X., Izotov, Y.I., 1997, ApJ 489, 623
- (105) Thuan, T.X., Izotov, Y.I., Foltz, C.B., 1999, ApJ 525, 105
- (106) Thuan, T. X., Izotov, Y. I., Lipovetsky, V. A., 1995, ApJ 445, 108
- (107) Thuan, T.X., Izotov, Y.I., Lipovetsky, V.A., 1997, ApJ 477, 661
- (108) Thuan, T.X., Williams, T.B., Malumuth, E., 1987, in “Starbursts and Galaxy Evolution”, T.X. Thuan, T. Montmerle, J.T. Thanh Van (eds.), Editions Frontières
- (109) Tolstoy, E., Saha, A., Hoessel, J.G., McQuade, K., 1995, AJ 110, 1640
- (110) Tully, R.B., 1988, ”Nearby galaxies catalog”, Cambridge Univ. Press
- (111) Vader, J.P., 1986, ApJ 317, 128
- (112) van Zee, L., Salzer, J.J., Haynes, M.P., O’Donoghue, A.A., Balonek, T.J., 1998a, AJ 116, 2805
- (113) van Zee, L., Skillman, E.D., Salzer, J.J., 1998b, AJ 116, 1186
- (114) van Zee, L., Westphal, D., Haynes, M.P., Salzer, J.J., 1998c, AJ 115, 1000
- (115) Vigroux, L., Thuan, T.X., Vader, J.P., Lachièze–Rey, M., 1986, AJ 91, 70
- (116) Wevers, B.M.H.R., van der kruit, P.C., Allen, R.J., 1986, A&AS 66, 502
- (117) Wilcots, E.M., Lehman, C., Miller, B., 1996, AJ 111, 1575