H Photometry of Abell 2390
Abstract
We present the results of a search for strong H emission line galaxies (rest frame equivalent widths greater than 50Å) in the cluster Abell 2390. The survey contains 1189 galaxies over 270 □′, and is 50% complete at . The fraction of galaxies in which H is detected at the 2 level rises from 0.0 in the central regions (excluding the cD galaxy) to 12.58% at . For 165 of the galaxies in our catalogue, we compare the H equivalent widths with their [OII] equivalent widths, from the CNOC1 spectra. The fraction of strong H emission line galaxies is consistent with the fraction of strong [OII] emission galaxies in the CNOC1 sample: only % have no detectable [OII] emission and yet significant (2) H equivalent widths. Dust obscuration, non-thermal ionization, and aperture effects are all likely to contribute to this non-correspondence of emission lines. We identify six spectroscopically ’secure’ k+a galaxies ((OII)Å and Å); at least two of these show strong signs in H of star formation in regions that are covered by the slit from which the spectra were obtained. Thus, some fraction of galaxies classified k+a based on spectra shortward of 6000 Å are likely to be undergoing significant star formation. These results are consistent with a ’strangulation’ model for cluster galaxy evolution, in which star formation in cluster galaxies is gradually decreased, and is neither enhanced nor abruptly terminated by the cluster environment.
Subject headings:
galaxies: clusters: Abell 2390 — galaxies: evolution1. Introduction
The study of large scale gradients in clusters has benefited lately from a wealth of observational data. Radial gradients in stellar populations and star formation rates (SFRs) have been measured out to beyond the virial radius in fifteen moderate redshift clusters in the Canadian Network for Observational Cosmology (CNOC1) sample (Abraham et al. (1996); Morris et al. (1998); Balogh et al. (1997);Balogh et al. (1998, 1999)); the MORPHS collaboration (Smail et al. (1997)) have been able to do similar work at smaller radii (Dressler et al. (1999); Poggianti et al. (1999)), with the added advantage of Hubble Space Telescope (HST) imaging to study galaxy morphologies in these clusters (Couch et al. (1994); Dressler et al. (1997); Couch et al. (1998)). These studies, and others, have shown that there are strong gradients in the mean SFR; recent modelling by Balogh et al. (Balogh et al. (2000)) suggests that it is reasonable to interpret this as a consequence of gradients in typical mass accretion times.
There is an intriguing class of unusual galaxies with strong absorption, but no observable [OII]3727 emission (e.g. Dressler and Gunn (1983); Couch and Sharples (1987); Balogh et al. (1999)) which have been an important focus of the above studies. The dust–free models constructed to reproduce these strong Balmer absorption lines have two important characteristics: (1) active star formation must have ceased fairly abruptly, within Gyr; and (2) the galaxies with the strongest H lines require this abrupt truncation to be immediately preceded by a strong increase in the SFR. The presence of these galaxies in some clusters has therefore led to the suggestion that star formation is abruptly quenched in a large fraction of infalling cluster galaxies (e.g. Barger et al. (1996)). However, there is mounting evidence that some of these unusual spectra may result from patchy dust obscuration (Poggianti et al. (1999); Smail et al. (1999); Poggianti and Wu (2000)). In this case, the galaxies are actually still undergoing strong star formation, but the most massive stars are heavily obscured. Longer lived A-stars migrate out of these dusty regions and become a more widespread population, dominating the continuum light even though star formation is still present. In light of this, we want to move away from empirical definitions, which are based on the strengths of spectral features, and propose four quantitative, physical definitions which we will use throughout this work.
-
•
Truncation: A decline in SFR from a significant rate (i.e., one that can account for the formation of a substantial fraction of the galaxy’s stars over a Hubble time, say M⊙yr-1) to negligible or undetectable levels in 1 Gyr.
-
•
Starburst: An episodic increase in the SFR, during which the galaxy increases its stellar mass by more than 10%, in Gyr. Spectrophotometric modelling suggests that a burst strength of at least this size is necessary to produce the galaxy spectra with the strongest Balmer absorption lines.
-
•
Post-starburst: The phase lasting Gyr after the truncation of a starburst. It is during this time that Balmer lines are significantly enhanced, relative to galaxies undergoing quiescent star formation.
-
•
Strangulation: A gradual decline in the SFR of a galaxy, due to the absence of halo gas that is required to continually fuel the disk of normal star forming galaxies. It has been suggested that this is the primary mechanism responsible for the differences between field and cluster galaxies (Balogh et al. (2000)).
If dust-obscured star formation is occurring in H-strong galaxies, then most of the evidence for truncated star formation disappears. Instead, the systematically lower SFRs of cluster galaxies relative to the field may be due to the more gradual ’strangulation’ process, since galaxies are unlikely to be able to retain a gaseous halo in the cluster environment (Larson et al. (1980); Balogh et al. (2000)). Moss & Whittle (Moss and Whittle (1993, 2000)) and Moss et al. (Moss et al. (1998)) have demonstrated that spiral galaxies in rich clusters show enhanced, circumnuclear H emission, relative to the field, which they suggest are due to tidal effects. However, it is not clear if the frequency and intensity of this activity is sufficient to be responsible for the transformation of the field spiral population into the dominant S0 population in clusters.
In many spectroscopic studies of high redshift galaxies, including the CNOC1 and MORPHS surveys discussed above, slit spectroscopy of the [OII] line is used as evidence for star formation. Kennicutt (Kennicutt (1992)) has shown that the strength of this emission line correlates well with SFR. However, there are several problems inherent in its use for studies of this kind. In particular:
-
•
Physical Interpretation: The strength of the [OII] line is sensitive to not only the ionizing flux from massive stars, but also to the metallicity and ionization state of the emitting gas. Primarily because of variations in these quantities, the correlation between [OII] strength and SFR shows considerable scatter, and varies considerably between samples (e.g., Gallagher et al. (1989); Kennicutt (1992); Tresse et al. (1999)). However, the presence of [OII] emission is still a reliable indication that star formation is present (except in the case of active galactic nuclei), even though the absolute rate may be uncertain.
-
•
Dust Extinction: The [OII] line is a blue feature, and quite sensitive to foreground dust extinction. Although line equivalent widths are unaffected by uniform dust obscuration, the derivation of SFRs requires estimating (or measuring) the line flux, which can be significantly reduced by dust extinction. Weaker lines will become undetectable in the presence of dust, and the number of star forming galaxies will be underestimated. Furthermore, if dust obscuration is patchy, the line emission may be more extincted that the continuum light, which will serve to reduce the line equivalent width, as well as the flux (e.g., Calzetti (1997)).
-
•
Slit Sampling: In most spectroscopic studies of galaxies at , the spectra are obtained from a narrow (″) slit centred on the peak of the continuum light, i.e., the centre of the galaxy. While this can cover a fairly large region at moderate redshifts, such observations may still exclude much of the flux from an extended disk component, where copious amounts of star formation often take place. Thus, measurements from slit spectroscopy do not always correspond directly to the total, luminosity-weighted average properties of the galaxy as a whole.
One can move a long way toward overcoming the above difficulties by undertaking imaging surveys in H light; this emission line is a more reliable star formation indicator than [OII], as it is less sensitive to dust extinction and metallicity. Underlying stellar absorption is generally less than 5Å (Kennicutt (1992)). Assuming a Salpeter initial mass function (IMF) for stellar masses ranging from 0.1 to 100 , Kennicutt et al. (Kennicutt et al. (1994)) find the following relationship between H luminosity, L(H) and SFR (for solar metallicity):
| (1) |
As recently reviewed by Kennicutt (Kennicutt (1998)), other calibrations have been published, with a variation of about 30% arising mostly from differences in the assumed initial mass function, but also, to some extent, from the nature of the models used. In particular, the coefficient in Equation 1 is 13% smaller than that determined by Kennicutt (Kennicutt (1992), as used in Balogh et al. Balogh et al. (1997)) and 50% smaller than that determined by Barbaro and Poggianti (Barbaro and Poggianti (1997), adopted in Balogh et al. Balogh et al. (1998)). Although the H line is much less sensitive to extinction than [OII], this effect is still the most important source of systematic error (Kennicutt (1998)). Typical estimates of the mean extinction for nearby spirals are A(H)=0.5–1.8 mag (Kennicutt (1983); Niklas and Wielebinski (1997); Caplan and Deharveng (1986); Kaufman et al. (1987); van der Hulst et al. (1988); Caplan et al. (1996)); furthermore A(H) is certainly not the same for all galaxies, and it is likely correlated with galaxy type and SFR. In particular, the extinction could be considerably higher in starburst galaxies which are targeted by the present survey.
In this work, we present the results of narrow band H imaging of galaxies in the CNOC1 cluster Abell 2390, an object which has been well studied previously by Abraham et al. (Abraham et al. (1996)). We use this data to determine:
-
1.
The fraction of cluster galaxies undergoing strong star formation (yr-1). We note that this alone cannot be used to determine the number of cluster-induced starbursts without similar measurements of the field galaxy population and a model of cluster infall. A first attempt at such modeling, based on [OII], is presented in Balogh et al. (Balogh et al. (2000)).
-
2.
The fraction of cluster galaxies which are undetected in [OII], but show H emission. This allows us to quantify how much star formation is missed in spectroscopic surveys based on [OII], and to investigate possible reasons for this omission.
-
3.
The presence and nature of H emission in the small k+a galaxy population. Their detection in H would imply that these systems do not satisfy our definition of physical post-starburst galaxies.
In §2 we describe the details of the observations made in 1998 at the Canada–France–Hawaii Telescope (CFHT). The reduction of this data and the details of the photometry, are discussed in §3. Our catalogue is presented in §4, the results are shown in §5, and our findings are summarised in the final section, §6.
2. Observations
The data were obtained with the OSIS (Optical Sub–arc second Imaging Spectrograph) instrument in imaging mode, over four half nights at CFHT from June 21–24, 1998. Twenty–one (19 with acceptable transmission) pointings were made, for a total areal coverage of about 270 □′. Only the central and extreme east/west portions of the CNOC1 strip were observed, due primarily to a night lost to cloudy conditions. For each pointing, we obtained images through three narrow-band filters (the on-line, a red continuum (RC) and a blue continuum (BC)) and one broad band R filter. The three narrow–band filters were chosen to isolate the H emission line at the mean cluster redshift of , Å. An appropriate on–line filter was manufactured by Barr Associates, with Å, Å FWHM (398Å between 10% transmission levels) and a peak transmission of 90%. Adequate filters for the blue and red continuum observations were available from CFHT111#4701: Å, Å and #1814: Å, Å.. These were chosen to encompass as much continuum as possible, while avoiding H emission from cluster members, and other strong emission lines. Using two continuum filters allows the determination of the continuum level at H, even in the presence of a strong slope. Although relatively isolated, the on–line filter will still sometimes be contaminated with [SII] emission, in addition to [NII], while the red continuum filter is susceptible to contamination by the very weak [ArIII] line. Corrections are only made for [NII] emission, using the relation [NII]/H 0.3 appropriate for strong emission line galaxies (Tresse et al. (1999)).
Exposure times were 90 s for the R–band filter, 600 s for the on-line filter, and 300s for each of the two continuum filters. A summary of the fields observed is presented in Table 1.
| Date (1998) | Field | RA () | Dec () |
|---|---|---|---|
| 21/6 | cc | 0 | 0 |
| “ | e1c | 225 | 0 |
| “ | e1n | 225 | 170 |
| “ | cn | 0 | 170 |
| 23/6 | w1s | -225 | -170 |
| “ | cs | 0 | -170 |
| “ | e1s | 225 | -170 |
| “ | w4n | -900 | 90 |
| “ | w3n | -675 | 90 |
| “ | w2n | -450 | 90 |
| “ | w2s | -450 | -90 |
| 24/6 | w3s | -675 | -90 |
| “ | w4s | -900 | -90 |
| “ | e4n | 900 | 90 |
| “ | e4s | 900 | -90 |
| “ | e3s | 675 | -90 |
| “ | e3n | 675 | 90 |
| “ | e2n | 450 | 90 |
Note. — Positions are measured relative to 21:53:39.2 +17:41:16 (J2000).
3. Data Reduction and Photometry
Each image was reduced using standard procedures with the IRAF222IRAF is distributed by the National Optical Astronomy Observatories which is operated by AURA Inc. under contract with NSF. ccdproc package. The continuum and on-line images were aligned by matching the centroids of several stars, and the astrometric solution, used for matching galaxies with the CNOC1 sample, was computed from stars in the U.S. Naval Observatory (USNO) A2.0 catalogue333The USNO SA2.0 catalogue is a product of the USNO Flagstaff Station and is distributed by the Astrometry Department.. Object detection, photometry and star/galaxy separation was done with the SExtractor photometry package (Bertin and Arnouts (1996)). We estimated the background using a global background map; this is inadequate for objects found in the haloes of bright stars or near bright ghosts or reflections, and these 35 objects are excluded from the catalogues. Objects are detected as 5 contiguous pixels more than 1 over the background, following convolution with a Gaussian (5 pixels FWHM). These detections are then passed through a deblending algorithm, which rethresholds each object at 32 exponentially spaced levels, and identifies peaks that contribute at least of the flux of the blended structure as distinct objects. Due to the sensitivity of measured colours to this deblending procedure, these measurements must be treated with some caution. For this reason, we will plot all deblended galaxies as separate symbols in the figures of this paper.
Sources were detected separately on all four images for each field; these detections were then matched, so the final catalogue contains only objects detected on all four images. This allows easy rejection of false detections due to noise spikes or residual cosmic rays. Magnitudes in each filter were determined from the FLUX_BEST quantity calculated by SExtractor; this uses an adaptive aperture approach to estimate the total light associated with each object. This approach is taken to allow for the fact that the PSF can vary significantly between different images of the same field (in different filters). We have verified that on-line/continuum ratios, measured in large enough apertures ( 2″ diameter, using the IRAF phot task) are consistent with the “total” ratios measured in this manner, within the uncertainties. Additional confidence that the equivalent widths measured in this way do not include additional, significant systematic uncertainty is given by comparing independent measurements of the same galaxy; this is discussed in detail below.
SExtractor star–galaxy classification is used to remove stellar objects from the final catalogue. The classification of bright objects () is at least reliable at the 95% level, though there is some tendency to classify compact members of deblended galaxy-galaxy pairs as stars. SExtractor assigns a “stellarity index” between 0 and 1 to each galaxy, where the larger number indicates increased likelihood that the object is a star. By inspecting objects on several of our OSIS images, we determined that almost all objects with stellarity index greater than 0.97 are stars, and we adopt this as our threshold.
Photometric zero points were determined from observations of a spectrophotometric standard star, BD+28∘ 4211 (Oke (1990)), in each filter. The relative throughput as a function of wavelength for the filter and detector combination is required to determine the expected flux of this standard star in each of our filters. This response was determined by taking a dispersed, long slit image of the flat field lamp through each filter, and dividing this by the spectrum obtained without a filter in place. We renormalise this response function to reach a maximum value of unity, so that the value in each wavelength interval represents the relative contribution of flux in that interval, accounting for both filter and detector response.
Since the nights were not photometric, the zeropoints are not reliable to within more than 0.3 mag. However, H equivalent widths () can be more precisely determined, since they only depend on the relative flux between the on-line and continuum images. We calibrate this by assuming that stellar objects have no significant absorption or emission at Å, corresponding to the wavelength of our on–line filter; thus, an appropriate scaling can be found such that the mean equivalent width of stellar objects is equal to zero. We first calculated the continuum flux of each galaxy by averaging its flux (in ergs s-1 Hz-1 cm-2) in each of the two continuum filters, RC and BC, to obtain ; this is appropriate because the central wavelengths of RC and BC are almost equally spaced on either side of the on–line filter in frequency. We then selected a sample of unsaturated, unblended stellar objects (with stellarity index 0.97, and free from image edges or bad columns), and measured the ratio of the flux in the on–line filter, , to . An example of this relation is shown in Figure 1, where we compare these two fluxes for stars in the central field. The tight correlation suggests that it is fair to assume all stars in the field have an approximately featureless spectrum in this wavelength range. We then divided by the mean value of this ratio ( in this case), to obtain a scaled image for all galaxies in the field, ensuring that the mean of is zero for stellar objects. For a given image, the r.m.s. of the scale factor is about , and we adopt this as the relative uncertainty in this scaling.

The rest frame equivalent width of the H line for cluster members is given by
| (2) |
where is the rest frame width of the on–line filter, in Å, which we take to be the FWHM of the filter response function, 348 Å. In fact, the on-line filter also covers the adjacent [NII] emission lines; all values of presented here include contribution from these lines, and a correction will only be made when SFRs are derived. For galaxies with or this index will not measure the strength of H, though we retain this notation since cluster membership has not been determined for all galaxies. The uncertainty in is computed using standard independent error propagation, including the 5% uncertainty in the scale factor . Note that, for large values of , the relative uncertainty in this quantity is larger than the relative uncertainty in the H flux, , but always by less than 10%.
Since adjacent OSIS fields overlapped by up to 30″, some galaxies appear on more than one image; from these duplicates, only the best quality image was used. We can use the duplicate observations to estimate the reliability of our equivalent width measurements, by comparing the difference between two measurements () with the quadrature sum of their uncertainties, . In Figure 2 we plot the distribution of the ratio of these two numbers, , excluding galaxies near image boundaries, and those which were originally blended with another object. If the true errors are Gaussian distributed with a variance given by our error estimate, the distribution of should be Gaussian with a mean of zero and variance of unity; this is shown as the solid curve for reference. A K–S test cannot significantly distinguish between this Gaussian and the distribution (the probability that the two are drawn from the same distribution is 0.14). This implies that our error estimates reliably represent the reproducibility of the equivalent width measurements, and that there are no large systematic effects.

4. The Final Catalogue
Galaxies lying near the single bad column of the STIS2 chip, in the haloes of bright stars, or with corrupted photometry (due to nearness to an image boundary or saturated pixels) were removed from the sample. The final catalogue contains flux ratios (corresponding to for cluster members) for 1189 galaxies, and will be made available at the Astronomical Data Center (http://adc.gsfc.nasa.gov/adc/); the data can also be obtained directly from M. Balogh. A sample entry in this catalogue is shown in Table 2. The name of the field in which the object lies is given in column 1, and the position on the CCD, in pixel coordinates, is given in columns 2 and 3. The J2000 coordinates of each object are shown in columns 4 and 5. We take the position of the brightest cluster galaxy (BCG) to be the centre of the cluster, relative to which galaxy positions are measured; offsets from this position, in arcseconds, are given in columns 6 and 7. From Carlberg et al. (Carlberg et al. (1996)), for this cluster is 1.51h-1 Mpc, where is the radius at which the mean interior mass density is equal to 200 times the critical density, and within which it is expected that the galaxies are in virial equilibrium (Gott and Gunn (1972); Crone et al. (1994)). This radius corresponds to 624″444We adopt for all cosmological dependent calculations., and we normalise all projected cluster–centric distances () to this value. The flux (column 11) and equivalent width (column 13) of the feature at 8059Å corresponds to H for galaxies within of the cluster redshift; the former quantity should only be used in a relative sense, due to systematic uncertainty in the zero point. In column 15 we list the SExtractor photometry flags which indicate the presence of bright neighbours (1), a deblended object (2), both (3) or neither (0).
| (1) | (2) | (3) | (4) | (5) | (6) | (7) | (8) | (9) |
|---|---|---|---|---|---|---|---|---|
| Field | x | y | RA | Dec | RA | Dec | ||
| cc | 784.4 | 473.6 | 21:53:36.80 | 17:41:43.8 | 0. | 0. | 17.209 | 0.004 |
| (10) | (11) | (12) | (13) | (14) | (15) | (16) | (17) | (18) |
| flux | flux | Flag | ppp | C.M. | ||||
| 17.258 | 0.117 | 0.029 | 86.6 | 21.9 | 2 | 1.12 | 101084 | yes |
Note. — Column definitions:(1) Field name; (2-3) chip coordinates (pixels); (4-5) J2000 coordinates; (6-7) Distance from central galaxy (arcseconds); (8-9) magnitude and uncertainty; (10) magnitude corrected for zero-point based on CNOC1 catalogue; (11-12) H flux in mJy, and its uncertainty; (13-14) Rest frame equivalent width of H and its uncertainty (Å); (15) SExtractor photometry flag in the on-line image; (16) incompleteness correction; (17) CNOC1 ppp number, if a spectrum is available; (18) cluster membership as determined from the CNOC1 redshift. The full catalogue will be available at the Astronomical Data Center.
4.1. Completeness
To estimate the completeness of our final catalogue, we compare our galaxy sample with the photometric CNOC1 galaxy sample, which is complete to about (Abraham et al. (1996)). Galaxies were matched in right ascension and declination coordinates, verified by interactive inspection in ambiguous cases. The number of galaxies in our catalogue matched in this manner is shown in the bottom panel of Figure 3, in bins of CNOC1 magnitude. The difference between this distribution and that of galaxies in the CNOC1 sample that lie within the same area of sky is shown in the top panel. Note that this procedure does not account for the small number of galaxies in the present sample which have no match in CNOC1; these usually arise from cases where our superior sampling and seeing is able to resolve an object into multiple components. There are also cases of discrepancy where objects are classified as stellar in one catalogue, but not the other. Figure 3 shows that our galaxy sample is % complete to , and falls to 50% completeness at . For our adopted cosmology, corresponds to an absolute magnitude of , including a K-correction of 0.23 mag555Based on model spectral energy distributions of Coleman, Wu and Weedman (Coleman et al. (1980)), independent of SED type to within 0.02 mag..

We used this matched sample to correct the zero points of our photometry, on a CCD frame by frame basis, by computing the mean offset , between the CNOC1 photometry and our magnitudes, for the galaxies we have in common brighter than . We adjusted our magnitudes according to this difference, which is, in general, mag. After applying this correction, the difference between the two measures for galaxies brighter than has a 3-clipped r.m.s. of 0.12 mag (to be compared with 0.21 mag, before this correction). This procedure allows us to apply a reliable magnitude cut to the final sample, by ensuring the photometry is on a consistent system. However, the same correction cannot be applied to the other filters, as the zero point may vary between exposures. In Table 2, the original magnitudes, and their uncertainties, are given in columns 8 and 9; the corrected magnitude is shown in column 10.
To correct for the incompleteness that sets in around =21.1, we calculated a statistical weight, , which is the ratio of the number of galaxies in the (area matched) CNOC1 photometric sample to the number in the current sample, binned in magnitude. We approximate for and for ; this is tabulated in column 17 of Table 2. This weight is applied when considering the statistical properties of the full sample in §5.2.
There are 165 galaxies in our H sample which have spectra available from the CNOC1 sample. For these, the ppp number from the CNOC1 catalogue is given in column 16 of Table 2. From the redshifts, we find 136 galaxies for which the H emission line lies within the 10% transmittance levels of our on-line filter (): we classify these as cluster members, as noted in column 18 of Table 2. From the CNOC1 spectroscopic catalogue, 90.2% of galaxies in this redshift range lie within 3 of the cluster redshift, and 96.7% lie within 6, where km/s is the cluster velocity dispersion.
5. Results
The goal of this project is to detect only the galaxies with the strongest star formation rates, yr-1. The local analogues of these galaxies are spiral galaxies of type Sc or later, and starburst galaxies (e.g. Kennicutt (1992); Jansen et al. (2000)). This should be borne in mind when considering these results, which do not necessarily apply to the more common types of spiral galaxies.
5.1. Comparison with CNOC1 [OII] Measurements
For the 165 galaxies with CNOC1 spectra available, we can compare the measurements with their other optical spectral properties. In particular, we will concern ourselves with the rest frame equivalent widths of the H absorption line, , and the [OII] emission line, (OII), as defined in Balogh et al. (Balogh et al. (1999)). The former index is positive for absorption features, while the latter is positive in the case of emission. The CNOC1 spectroscopic sample is a subset of a complete photometric sample, and statistical weights discussed in Yee et al. (Yee et al. (1996)) are applied to galaxies in this sample to correct for selection effects due to apparent magnitude (), geometric position () and colour (), where necessary (as in §5.2).
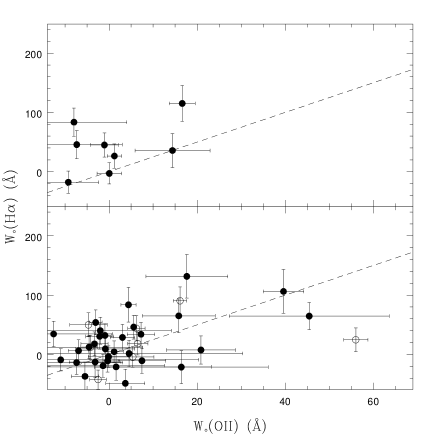
In Figure 4 we compare with (OII), plotting only galaxies brighter than , and with (OII) uncertainties less than 20Å. In the bottom panel we plot field galaxies, for which the H emission line does not fall within our on–line filter wavelength range and, thus, should (usually) have =0. These measurements are fairly evenly distributed about zero (the median is -1.9Å), with a standard deviation (excluding 3 outliers with large negative values) of Å, consistent with the mean uncertainty of Å. As expected, we only detect () galaxies with fairly strong emission lines, Å. In the top panel we show the relation between (OII) and for cluster members; the solid line represents the mean local relation found by Kennicutt (Kennicutt (1992)). Most of the galaxies that have strong (OII) (i.e., Å) are also detected in H. Low ratios of /(OII) in some cases are partly due to the fact that the H emission originates from a small (usually central) region of the galaxy; thus, is low since there is a considerable amount of continuum flux dominating the light, from other regions of the galaxy. The spectroscopic observations, from which (OII) is measured, only sample the light in a narrow 15 slit (corresponding to 10 pixels in our images, or 3.6 kpc) placed across the galaxy, so the emission line flux may contribute a larger fraction of the total light in the slit.

We can estimate the SFR for galaxies detected in H from Equation 1, adopting a mean H extinction of 1 magnitude and correcting for [NII] contamination assuming [NII]/H=0.3 (Tresse et al. (1999)). We determine the H flux as , and the uncertainty in this quantity includes the 5% uncertainty in the scale factor . The luminosity is computed from the luminosity distance to the cluster of 752 Mpc corresponding to our adopted cosmology. The relation between SFR and is shown in Figure 5; only galaxies brighter than with Å and CNOC1 spectra available are plotted. Galaxies which were originally blended with another object, or which have nearby, bright neighbours which may bias the photometry, are plotted as triangles. Of the 32 cluster members with (OII)Å (at 2 confidence), four have at the 2 level666We note that one H-detected galaxy in the catalogue, ppp #300034, has an incorrect redshift in the CNOC1 catalogue, and is therefore catalogued with weak [OII]. Using the correct redshift of 0.22630, the [OII] emission is significant.; these are shown as the filled symbols in Figure 5. These four galaxies have SFRs of 2–4 , comparable to that of the Milky Way (Rana (1991)), which suggests that 12% of galaxies for which we do not detect [OII] may in fact have substantial star formation activity. In one galaxy, the H emission is confined to a small central region, perhaps indicative of an active nucleus. Thus, only three of the galaxies with undetected [OII] show significant H emission extended over large scales; this comprises only % of the galaxies with CNOC1 spectra. The value of for these galaxies is Å; from Kennicutt’s (Kennicutt (1992)) mean relation (see Figure 4), this corresponds roughly to (OII)20 Å, which should be easily detectable. Dust obscuration may be responsible for the missing [OII] in these three galaxies. However, there is often a significant amount of emission in the outer, disk regions of these galaxies, which may have fallen outside the slit in the spectroscopic survey; this aperture effect may be more important than dust obscuration at ’hiding’ signs of star formation, in some cases.

Interestingly, we also find that 3/8 galaxies which have [OII] Å (2) are undetected in H. We cannot draw strong conclusions from this, since the uncertainties on the measurements are Å, and there could be considerable emission below our detection limit of 50Å. We note that Tresse et al. (Tresse et al. (1999)) find that % of galaxies without H emission have detectable [OII] emission.
5.2. Properties of the Full H Sample
measurements for the full catalogue are shown in Figure 6. In the bottom panel we show all galaxies, as a function of magnitude; in the top panel, is plotted against radius, for only those galaxies (581) brighter than our nominal magnitude limit of . Note that both of these figures will include field galaxies, for which the index is not centred on H, and is not correlated with the strength of the H line. There is a clear trend for galaxies with strong to be located at large distances from the cluster centre (). The single galaxy (apart from the BCG) in the central regions () with a large H equivalent width is a disk galaxy, and the emission seems to be confined to the disk component. The archival HST image shows several bright knots within this disk, and clear signs of interaction with a nearby galaxy of similar brightness. The resolution and signal in our H image is not high enough to allow a good determination of where the line emission is coming from, however.

There is also an indication that the strong emission line galaxies tend to be faint (). We demonstrate this further in Figure 7, where we compare with absolute (K-corrected) magnitude for all galaxies detected at the 2 level. Most of the detections are for galaxies with ; and the strongest lines (100 Å) are found in galaxies fainter than . Since the faintest galaxies are also the most numerous, as seen in the magnitude distribution of the full sample in the bottom panel, the fraction of detections is actually nearly independent of magnitude, at %. Despite the large equivalent widths of these faint galaxies, their corresponding SFRs are fairly low; this can be seen in Figure 5, where there is a substantial population of galaxies with Å, and SFR1 . From Jansen et al. (Jansen et al. (2000)), we expect most of these faint, strong emission line galaxies to be of Hubble type Sc or later.

To calculate the fraction of cluster galaxies with detected H emission, we need to make a statistical correction for the inclusion of field galaxies, which will be relatively more common far from the cluster centre. To do this, we use the CNOC1 spectroscopic sample to calculate the fraction of of cluster members as a function of , including the appropriate statistical weights discussed in 5.1. This fraction is shown in the bottom panel of Figure 8; nearly all of the galaxies within 0.1 are expected to be cluster members, while only 70% near are members. Using this statistical field correction, and the weights discussed in §4.1 to correct for incompleteness, we show, in the top panel of Figure 8, the fraction of galaxies that have Å with 2 confidence, as a function of . We only consider galaxies brighter than to allow a fair comparison with the CNOC1 spectroscopic survey, which is very incomplete (magnitude weights greater than 5) at fainter magnitudes. A total of 4.31% of all cluster members in the sample satisfy this criterion, and there is a clear increase in the incidence of this fraction with increasing distance from the cluster centre. From Kennicutt’s (Kennicutt (1992)) relation, Å corresponds to (OII)Å. The fraction of galaxies in the CNOC1 sample with (OII)Å, with 2 confidence and to the same magnitude limit, is shown in Figure 8 as the dashed line; it agrees well with the fraction of strong H emitting galaxies: within , the [OII] fraction is also %. This is a crude comparison, because the detection limit in one line cannot be uniquely identified with a limit in the other. However, it is clear that the fraction of strong emission line galaxies calculated in the CNOC1 survey (Balogh et al. (1997)), at least for this cluster, is not strongly underestimated due to aperture or dust effects.

5.3. H Emission in Unusual Galaxy Types
5.3.1 The cD Galaxy
The extended distribution of H emission in the central, cD galaxy of this cluster has been discussed in Hutchings & Balogh (Hutchings and Balogh (2000)). To briefly summarize the results of that paper, the H emission extends several arcseconds from the galaxy centre, to the northwest, roughly following L and blue knots seen in HST images and spectra. However, there is inexact correspondence between H and L, which may be the result of an inhomogeneous dust distribution. This is the only strong line emitting galaxy (but one) detected in the central region of A2390, and has been omitted from all other analysis in this paper.
5.3.2 Strong Balmer Line Galaxies
In the local universe, typical galaxies, regardless of Hubble type, have Balmer absorption lines which are much weaker than the maximum possible (for a pure A-star composition), due to the presence of very young or very old stars. The strongest lines are generally found in Sc and Sd galaxies, and even in these galaxies 5Å. Stronger absorption seen in a rare class of galaxies seems to require something unusual in their recent star formation history. For those strong Balmer line galaxies without detectable [OII] emission lines, it has been suggested that star formation has recently been truncated, perhaps preceded by a starburst (e.g., Dressler and Gunn (1983); Couch and Sharples (1987); Barger et al. (1996); Poggianti et al. (1999); Balogh et al. (1999)). The remainder (i.e., those with [OII]) may be dust-obscured starburst galaxies (Poggianti et al. (1999)) in which light from the most massive stars is suppressed enough to produce the strong Balmer lines observed.
We adopt the definitions of Balogh et al. (Balogh et al. (1999)) which are Å and (OII)Å for k+a galaxies, and Å and (OII)Å for a+em galaxies. In the present sample, there are fourteen galaxies satisfying these constraints, for which we have both CNOC1 spectra and H measurements. However, as we wish to consider these objects on a per-galaxy basis, rather than in a statistical sense, we restrict our sample to those galaxies for which their spectral classification is the most secure. We therefore require that the uncertainties on (OII) be small enough that the determination of (OII) Å (for k+a galaxies) or (OII) Å (a+em galaxies) is significant at the 1 level. We also remove one galaxy with a large uncertainty in , and include another which lies just below our threshold (4.7Å), but has Å with more than 2 confidence. We list the properties of these selected galaxies in Table 3.
| ppp | (OII) | (OII) | Comments | ||||
|---|---|---|---|---|---|---|---|
| 101695 | 16.6 | 2.9 | 5.8 | 1.4 | 115.1 | 30.2 | a+em: central emission |
| 500858 | 14.4 | 8.5 | 8.1 | 4.3 | 35.8 | 28.7 | a+em |
| 101100 | -1.0 | 3.1 | 4.7 | 0.7 | 45.1 | 20.2 | (almost) k+a: diffuse emission |
| 400656 | 1.2 | 1.6 | 5.3 | 1.1 | 26.5 | 20.4 | k+a: bow shock? |
| 100537 | 0.0 | 2.7 | 5.5 | 0.6 | -2.8 | 18.0 | k+a |
| 201228 | -7.3 | 10.1 | 5.8 | 2.3 | 45.6 | 23.7 | k+a: emission in central knot |
| 100604 | -9.3 | 6.9 | 5.9 | 1.6 | -17.6 | 18.8 | k+a |
| 501033 | -8.0 | 11.9 | 7.1 | 2.1 | 83.5 | 23.8 | k+a: emission in disk |
Note. — All equivalent widths are rest frame, in units of Å. Uncertainties are 1.
In the top panel of figure 9 we show the (OII)- relation for these eight galaxies. For comparison, we present the distribution of blue () galaxies with Å in the bottom panel. The eight H-strong galaxies appear to lie toward somewhat higher /(OII) ratios; however, there are not enough objects to allow strong conclusions. Below, we discuss the H and continuum morphologies of the k+a and a+em galaxies separately, beginning with the four k+a galaxies with .
-
501033:
The only k+a galaxy for which with more than 3 significance, this object is shown in the bottom left panel of Figure 10. The emission comes from the disk (perhaps from individual HII regions, though this conclusion depends on the smoothing scale adopted), with no central emission. The absence of [OII] in the spectrum may be partly due to an aperture effect, since some of the disk emission will not have been covered by the 15 slit (10 pixels in our images). However, it seems unlikely that this can be the only reason, as most of the disk should still have been covered.
-
101100:
This galaxy is detected in H at the 2.2 level, and is shown in the bottom right panel of Figure 10. Although the value of falls just below our adopted threshold of 5Å for k+a classification, the H line is clearly strong, greater than 3Å with more than 2 significance. Unlike galaxy 501033, the H emission in this object is weakly present over large scales, and is peaked on the nucleus. In this case, the [OII] light must be obscured, probably by dust in the centre of the galaxy.
-
201228:
This is not quite a 2 detection in H. The emission in this k+a galaxy arises from a compact region at the centre, which may indicate the presence of a non-thermal nuclear source.
-
400656:
The final k+a galaxy detected in H is shown in the top right panel of Figure 10. The emission forms a distinct arc on the western edge. Although the formal significance of the detection is low, this is because the emission arises from a much smaller area than the bulk of the continuum light. At the position of the arc, the H flux is clearly detected at . The centre of the cluster is almost due west from this bulge-dominated galaxy; thus, it is possible that this emission arises from a shock, or induced star formation, due to an interaction with the intercluster medium as the galaxy plunges toward the cluster centre. However, the image quality is not good enough to rule out the possibility that the emission shape arises normally in a spiral arm, or in a tidal tail. Since the long edge of the CNOC1 slit was aligned in the east–west direction, this emitting region should have contributed to the spectrum obtained in that survey.
In summary, only 2/6 of the k+a galaxies are undetected in H as well as [OII] (though the formal significance of two others is less than 2 due to the relatively small area in which the emission originates). In one case the absence of [OII] may be partly attributed to an aperture effect. In two other galaxies, the H emission may arise from non–thermal sources (i.e. active nucleus or shocked gas). Therefore, there are only two k+a galaxies in which there is strong H resulting from star formation in the regions covered by the spectroscopic slit; it is possible that dust obscuration is responsible for the absence of [OII] in the CNOC1 spectra of these objects. It seems probable that there is substantial star formation taking place in at least some galaxies that were classified as k+a based on spectra that did not include H emission. We can therefore conclude that galaxies with truncated star formation likely make up only a subset of the k+a class of galaxies.

We now consider the a+em galaxies, in which the H lines are too strong to be consistent with the ongoing star formation implied by the presence of [OII] emission (Poggianti et al. (1999); Balogh et al. (1999)). Our sample only contains two such galaxies, and only one is detected in H at the level. The detected galaxy is shown in the top, left panel of Figure 10: it is a pure disk galaxy, with fairly symmetric, diffuse emission centred on the continuum peak. The ratio /(OII) , which is larger than the mean ratio found by Kennicutt (Kennicutt (1992)) by 1.6, as expected if there is considerable dust extinction. However, we cannot draw any conclusions from this one object. The only other secure a+em galaxy has a “normal” ratio, with fairly large uncertainties on both line indices.
6. Conclusions
We have presented measurements for the strongest emission line cluster galaxies (corresponding to late type spirals and starburst galaxies) from a sample of 1189 galaxies over fields covering 270 □′ about the cluster Abell 2390. We confirm the presence of a gradient in strong emission line frequency within this cluster; the fraction of galaxies in which H emission is detected at the 2 level increases from 0.0 in the central regions (, excluding the BCG) to % at . This is consistent with the fraction of galaxies with strong [OII] emission, measured in the CNOC1 survey. We compare with (OII) measured from CNOC1 spectra for 166 galaxies, and find that less than % show no significant [OII] emission in their spectra, and yet are detected in H at the 2 level. The [OII] emission in these galaxies is likely absent in the spectra due to a variety of effects, such as 1) non-central (i.e., disk) emission missed by the narrow slit; 2) naturally low (OII)/ ratios due to non-thermal ionization; and 3) dust extinction. At least two out of the six clear examples of k+a galaxies (which have strong H absorption but no detectable [OII]) have strong, diffuse H emission within the region covered by the spectroscopic slit; thus, the fraction of galaxies in which star formation was recently truncated is less than estimated from the frequency of these spectral types.
Moss & Whittle (Moss and Whittle (2000)) have found evidence that circumnuclear star formation in spiral galaxies is more common in rich clusters than in the field, and claim this enhanced star formation is due to cluster tidal effects. We note that the circumnuclear emission detected by these authors has, in general, equivalent widths Å (Moss and Whittle (1993)), and would not have been detected in the present study. The lack of dramatically starbursting cluster galaxies in Abell 2390 found in the present survey is consistent with the conclusions based on the spectral analysis of this cluster (Abraham et al. (1996); Balogh et al. (1999)), that cluster–induced star formation is unlikely to play a large role in cluster galaxy evolution. The level of star formation observed in this cluster is consistent with the “strangulation” model of cluster galaxy evolution, in which star formation is assumed to decline gradually after a galaxy is accreted into a cluster (Balogh et al. (2000)).
References
- Abraham et al. (1996) Abraham, R. G., Smecker-Hane, T. A., Hutchings, J. B., Carlberg, R. G., Yee, H. K. C., Ellingson, E., Morris, S., Oke, J. B., and Rigler, M.: 1996, ApJ 471, 694
- Balogh et al. (1997) Balogh, M. L., Morris, S. L., Yee, H. K. C., Carlberg, R. G., and Ellingson, E.: 1997, ApJL 488, 75
- Balogh et al. (1999) Balogh, M. L., Morris, S. L., Yee, H. K. C., Carlberg, R. G., and Ellingson, E.: 1999, ApJ 527, 54
- Balogh et al. (2000) Balogh, M. L., Navarro, J. F., and Morris, S. L.: 2000, ApJ accepted, astroph/0004078
- Balogh et al. (1998) Balogh, M. L., Schade, D., Morris, S. L., Yee, H. K. C., Carlberg, R. G., and Ellingson, E.: 1998, ApJL 504, 75
- Barbaro and Poggianti (1997) Barbaro, G. and Poggianti, B. M.: 1997, A&A 324, 490
- Barger et al. (1996) Barger, A. J., Aragón-Salamanca, A., Ellis, R. S., Couch, W. J., Smail, I., and Sharples, R. M.: 1996, MNRAS 279, 1
- Bertin and Arnouts (1996) Bertin, E. and Arnouts, S.: 1996, A&AS 117, 393
- Calzetti (1997) Calzetti, D.: 1997, AJ 113, 162
- Caplan and Deharveng (1986) Caplan, J. and Deharveng, L.: 1986, A&A 155, 297
- Caplan et al. (1996) Caplan, J., Ye, T., Deharveng, L., Turtle, A. J., and Kennicutt, R. C.: 1996, A&A 307, 403
- Carlberg et al. (1996) Carlberg, R. G., Yee, H. K. C., Ellingson, E., Abraham, R., Gravel, P., Morris, S., and Pritchet, C. J.: 1996, ApJ 462, 32
- Coleman et al. (1980) Coleman, G. D., Wu, C. C., and Weedman, D. W.: 1980, ApJS 43, 393
- Couch et al. (1998) Couch, W. J., Barger, A. J., Smail, I., Ellis, R. S., and Sharples, R. M.: 1998, ApJ 497, 188
- Couch et al. (1994) Couch, W. J., Ellis, R. S., Sharples, R. M., and Smail, I.: 1994, ApJ 430, 121
- Couch and Sharples (1987) Couch, W. J. and Sharples, R. M.: 1987, MNRAS 229, 423
- Crone et al. (1994) Crone, M. M., Evrard, A. E., and Richstone, D. O.: 1994, ApJ 434, 402
- Dressler and Gunn (1983) Dressler, A. and Gunn, J. E.: 1983, ApJ 270, 7
- Dressler et al. (1997) Dressler, A., Oemler, A., Couch, W. J., Smail, I., Ellis, R. S., Barger, A., Butcher, H. R., Poggianti, B. M., and Sharples, R. M.: 1997, ApJ 490, 577
- Dressler et al. (1999) Dressler, A., Smail, I., Poggianti, B. M., Butcher, H., Couch, W. J., Ellis, R. S., and Oemler, A.: 1999, ApJS 122, 51
- Gallagher et al. (1989) Gallagher, J. S., Hunter, D. A., and Bushouse, H.: 1989, AJ 97, 700
- Gott and Gunn (1972) Gott, J. R. and Gunn, J.: 1972, ApJ 176, 1
- Hutchings and Balogh (2000) Hutchings, J. B. and Balogh, M. L.: 2000, AJ 119, 1123
- Jansen et al. (2000) Jansen, R. A., Fabricant, D., Franx, M., and Caldwell, N.: 2000, ApJS 126, 331
- Kaufman et al. (1987) Kaufman, M., Bash, F. N., Kennicutt, R. C., and Hodge, P. W.: 1987, ApJ 319, 61
- Kennicutt (1998) Kennicutt, R. C., J.: 1998, ARA&A 36, 189
- Kennicutt (1983) Kennicutt, R. C.: 1983, ApJ 272, 54
- Kennicutt (1992) Kennicutt, R. C.: 1992, ApJ 388, 310
- Kennicutt et al. (1994) Kennicutt, R. C., Tamblyn, P., and Congdon, C. W.: 1994, ApJ 435, 22
- Larson et al. (1980) Larson, R. B., Tinsley, B. M., and Caldwell, C. N.: 1980, ApJ 237, 692
- Morris et al. (1998) Morris, S. L., Hutchings, J. B., Carlberg, R. G., Yee, H. K. C., Ellingson, E., Balogh, M. L., Abraham, R. G., and Smecker-Hane, T.: 1998, ApJ 507, 84
- Moss and Whittle (1993) Moss, C. and Whittle, M.: 1993, ApJL 407, 17
- Moss and Whittle (2000) Moss, C. and Whittle, M.: 2000, astro-ph/ 0003337
- Moss et al. (1998) Moss, C., Whittle, M., and Pesce, J. E.: 1998, MNRAS 300, 205
- Niklas and Wielebinski (1997) Niklas, S. and Wielebinski, R.: 1997, A&A 322, 19
- Oke (1990) Oke, J. B.: 1990, AJ 99, 1621
- Poggianti et al. (1999) Poggianti, B. M., Smail, I., Dressler, A., Couch, W. J., Barger, A. J., Butcher, H., Ellis, R. S., and Oemler, A.: 1999, ApJ 518, 576
- Poggianti and Wu (2000) Poggianti, B. M. and Wu, H.: 2000, ApJ 529, 157
- Rana (1991) Rana, N.: 1991, ARA&A 29, 129
- Smail et al. (1997) Smail, I., Dressler, A., Couch, W. J., Ellis, R. S., Oemler, A., Butcher, H., and Sharples, R. M.: 1997, ApJS 110, 213
- Smail et al. (1999) Smail, I., Morrison, G., Gray, M. E., Owen, F. N., Ivison, R. J., Kneib, J.-P., and Ellis, R. S.: 1999, ApJ 525, 609
- Tresse et al. (1999) Tresse, L., Maddox, S. J., Loveday, J., and Singleton, C.: 1999, MNRAS 310, 262
- van der Hulst et al. (1988) van der Hulst, J. M., Kennicutt, R. C., Crane, P. C., and Rots, A. H.: 1988, A&A 195, 38
- Yee et al. (1996) Yee, H. K. C., Ellingson, E., and Carlberg, R. G.: 1996, ApJS 102, 269