Abstract
We present the results of two ToO BeppoSAX observations of BL Lac. During the first observation we detected both the synchrotron and the Compton components. Fast time variability was present, but only for the synchrotron component. During the second observation the spectrum was flatter and only the Compton component was present. Four different SED are presented and can be described by a blob moving along a jet and responsible for the SSC emission. The seed photons for the Compton scattering are the synchrotron photons themself plus possibly external photons coming from the broad line region.
1 Introduction
BL lac objects are highly variable sources characterised by non thermal emission that dominates from the radio to the -rays. The overall Spectral Energy Distribution (SED) is dominated by two broad emission peaks: the lower frequency peak is believed to be produced by synchrotron emission, while the higher frequency peak is probably due to inverse Compton process. The variability for these sources is more pronounced at higher energies and the overall SED can change drammatically during strong flare events (e.g. Mkn 501, Pian et al. 1997; 1ES 2344+514, Giommi et al. 1997).
Here we report on the two BeppoSAX observations of BL Lac itself, during a campaign aiming to study other BL Lac objects while in a flaring state. BL Lac X-ray spectrum is quite hard with an energy spectral index of (Sambruna et al. 1999; Madejski et al. 1999). It has already been observed by BeppoSAX, in November 1997, with a 2-10 keV flux of (Padovani et al. in preparation). This is comparable to the level observed by RossiXTE during the 1997, July outburst. Our two BeppoSAX observations were triggered by two optical flare events (R magnitude brighter than 13 mag), although when the source was actually observed by BeppoSAX the optical flux was lower (R=13.4-13.6 mag).
| Date | F2-10keV | /d.o.f. | ||
|---|---|---|---|---|
| ergs cm-2 s-1 | ||||
| 5-7 June 1999 | 1.03/122 | |||
| 5-6 December 1999 | 1.02/130 |
NH fixed at the value . The two power laws cross at keV.
2 Observation and Results
On May, 1999, BL Lac was reported to be again in an optically bright state, thus we triggered our BeppoSAX ToO and BL Lac was observed the 5-7 of June, 1999. However, the source was about a factor of two weaker than the first BeppoSAX observation. The 0.1-100 keV X-ray spectrum cannot be fitted by a single power law. A broken power law gives a better fit with a concave shape (see Table 1). For the interstellar absorption we find a value of N, consistent with the values found in previous works (see Sambruna et al. 1999; Madejski et al. 1999). Thus, we probably detected both the synchrotron and the inverse Compton components. During this observation we also find very short time scale variability, with the 0.1-10 keV flux increasing by a factor of two in about 20 minutes. This variation was not detected in the simultaneous R band light curve. This variability is seen only in the synchrotron part of the spectrum. In fact, both the LECS and the MECS instruments detect this variability only below the break, keV (see Fig. 1 in Tagliaferri et al. 2000a). This result is similar to what we observed during another BeppoSAX ToO observation of the BL Lac object ON 231 (Tagliaferri et al. 2000b).

After the BeppoSAX observation, the source remained active in optical with the R magnitude ranging between mag. At the end of November, it brightened again to R, thus we triggered a second BeppoSAX ToO observation. However, again, when the source was observed in X-ray the R magnitude was down to R. This time the 0.1-100 keV X-ray spectrum is well fitted by a single power law, with a flat energy index . The total flux in the 2-10 keV energy band is about a factor of two higher, however the two spectra cross at about 1.5 keV, thus the flux in the softer X-ray energy band is actually lower. Clearly, the overall shape of the SED changed between the two observations and during the second one we detected only the Compton component. During this observation we did not detect fast variability.
3 Discussion
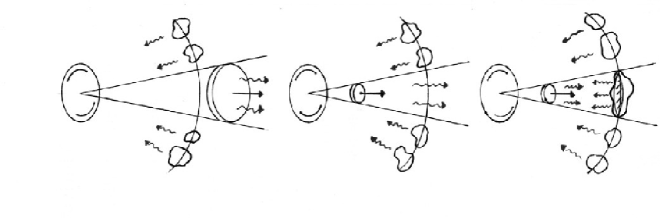
We plot in Fig. 1 four different SEDs corresponding to the multi-wavelength campaigns carried out during November 1995, during July 1997, when the source was in a very high state and during the two BeppoSAX observations. This figure clearly shows the high degree of variability and complexity of the BL Lac’s SED. Probably different emission mechanisms are working at different times. Here we propose the presence of a blob moving along a jet, responsible for the SSC emission. If the moving blob is outside the broad line region (BLR), there will not be an extra Compton component. If instead the blob is inside the BLR, then there will also be external seed photons coming from the BLR that can be Compton scattered. These will be even more numerous if one or more clouds were inside the jet itself. The various scenarios are sketched in Fig. 2. In Fig. 1 the labels OUT/IN mean that the model that better represents the data is the one with the blob INside or OUTside the BLR.
References
- 1
- 2 Giommi P., Padovani P., Perlman E., Nucl. Physics B (Proc. Suppl.), 69, p.407
- 3 Madejski G.M., Sikora M., Jaffe T., et al., 1999, ApJ 521, 145
- 4 Pian E. et al. 1997, ApJL 492, L17
- 5 Sambruna R.M., Ghisellini G., Hooper E., et al., 1999, ApJ 515, 140
- 6 Tagliaferri G., Ghisellini G., Giommi P., et al. 2000b, A&A 354, 431
- 7 Tagliaferri G., Ghisellini G., Giommi P., et al. 2000a, Astr. Lett. & Comm., in press
- 8