Coherent radio emission from the magnetic chemically peculiar star CU Virginis
Abstract
Radio observations of the magnetic chemically peculiar star CU~Vir,
carried out with the VLA in three different days, show that the radio emission
at 20 cm is characterized by a strong enhancement at
particular rotational phases. This radio emission is found to be right hand
polarized with a degree of polarization close to 100 %.
As common for this class of stars, the magnetic axis of CU~Vir is
oblique with respect to the rotational axis. By comparing the 20 cm radio
light curve with the effective magnetic field available from the literature,
a coincidence of the main peaks of the radio emission with the magnetic nulls
has been found. This happens when the magnetic axis lies in the plane of the
sky.
We suggest that the high degree of polarization, together with the high
directivity of the radiation, can be explained in terms of coherent radio
emission.
The data have been interpreted on the basis of the Electron Cyclotron
Maser Emission from electrons accelerated in current sheets out of the
Alfvén radius toward the stellar surface and eventually reflected
outward by magnetic mirroring.
Key Words.:
Stars: chemically peculiar – Stars: individual: CU Vir – Polarization – Stars: magnetic field – Radio continuum: stars – Masers
1 Introduction
Magnetic chemically peculiar (MCP) stars can produce radio emission at centimetric wavelengths. This radio emission is consistent with gyrosynchrotron emission from continuous ejected, mildly relativistic nonthermal particles trapped in the magnetosphere (Drake et al. drake (1987)).
MCP stars are characterized by mainly dipolar magnetic fields, whose strength steeply decreases with the stellar distance, and thus each radio frequency is expected to be emitted in a well localized stellar shell of the circumstellar region. Since the dipole axis is tilted with respect to the rotation axis, Leone (leo91 (1991)) suggested that the observed radio emission from MCP stars should be periodically variable. Combining their own observations with Drake et al. (drake (1987)) and Phillips & Lestrade (phil (1988)) data, Leone & Umana (leo93 (1993)) have shown that the 6 cm density fluxes of HD 37017 and HD 37479 vary with the stellar rotation period. The coincidence of radio maxima with the extrema of the effective magnetic field lead Leone & Umana to suggest that radio emitting regions are located above the magnetic poles. The variability of the 6 cm emission with the rotational period and has been also observed for the MCP star HD 133880 by Lim et al. (lim (1996)).
We have monitored along the rotational period CU~Vir (= HD 124224) with the Very Large Array (VLA) at four frequencies. This star is particularly suitable for studying the radio emission from MCP stars because of its small distance (80 pc), very short rotational period (0.52 days) and reversing magnetic field. Here we present the behavior of the 1.4 GHz radiation whose properties are compatible with cyclotron maser emission.
2 Observations and data reduction
We have monitored at 1.4, 5, 8.4 and 15 GHz the B9p Si star CU~Vir (= HD 124224) over three separate days using the VLA 111The Very Large Array is a facility of the National Radio Astronomy Observatory which is operated by Associated Universities, Inc. under cooperative agreement with the National Science Foundation. The observations have been carried out on June 1, 6 and 11, 1998 from 23 to 07 UT with all the available telescopes at the beginning of the A to B reconfiguration. For each frequency, we used the standard observing mode with two independent 50 MHz bands in Right and Left Circular Polarizations (RCP and LCP), adopting a 10 sec integration time. At 1.4 GHz the two bands are separated by 80 MHz, being centered at 1385 and 1465 MHz.
A typical observing cycle consisted of 10-min on source preceded and followed by 2-min on the phase calibrator 1354$-$021, which is only far from CU~Vir. The four frequencies have been observed alternately with all the telescopes, so that at each frequency CU~Vir has been observed for about over a total time of . The sequence of the frequencies during the three observing runs have been organized to get the best possible sampling of the rotational phases, avoiding redundancies. To get a reliable flux scale, the amplitude calibrator 3C286 was observed at the beginning and the end of each run ( and of elevation respectively).
Data were calibrated and mapped by using the standard procedures of the Astronomical Image Processing System (A.I.P.S.). CU~Vir was found unresolved on VLA baselines at all the observed frequencies. Its position was determined by using the task JMFIT, and found to be coincident with the position given in the Hipparcos Catalogue (Perryman et al. hip (1997)): and . The temporal variation of the Stokes I and V parameters was determined with the task DFTPL. This task performs the direct Fourier transform of the visibilities as a function of time for an arbitrary position in the map. The results of this task can be affected by the sidelobes of any other strong source in the field. However, since the only source close to our target is very weak, having a flux density of only 3 mJy at 1.4 GHz, the possible confusion is negligible. Heliocentric correction was then applied to the times of observation. Fig. 1 shows the radio light curve at 1.4 GHz during the three days of observation.


3 Stellar parameters
Spectral, photometric and magnetic variations of MCP stars are characterized by a single period. Stibbs (stibbs (1950)) proposed that these stars present a dipolar magnetic field, whose symmetry axis is tilted with respect to the rotational axis, and a non homogeneous distribution of chemical elements on the stellar surface. Thus the variability period is the rotational one.
The rotational period of CU~Vir was firstly determined by Deutsch
(deutsch (1952)) equal to 0.52067 days. Several authors have later re-determined
this period with values ranging from 0.52067 to 0.5207 days,
see Catalano & Renson (cat (1998)) for a complete list of references.
Recently, Pyper et al. (pyper (1998)) analyzed all the photometric data
covering 40 years. They suggested that the rotational period of CU~Vir
increased abruptly between 1983 and 1987
of a factor . This unexpected jump
of the rotational period was discussed by Stȩpień (stepien (1998)).
He suggested that the spin down occurs in the outher stellar
envelope alone, due to a change of the moment of inertia of the envelope
itself because of the internal magnetic field strength.
The new ephemeris given by Pyper et al. (pyper (1998)), referred to light
minimum, are:
Using the projected rotational velocity (Hatzes hatzes (1997)) and the stellar radius (North north (1998)), in the relation
valid for a rigid rotator, we measure an inclination of the rotational axis with respect to the line of sight .
Borra & Landstreet (borra (1980)) found that the effective magnetic field (), measured from 1976 to 1978, is variable with the period established by Winzer (winz (1974)) from photometry. is the average of the component of the local magnetic field along the line of sight over the whole stellar disk. From the value of the inclination and Borra & Landstreet (borra (1980)) measurements of , we obtain an obliquity of the dipole and a polar magnetic field equal to gauss. Pyper et al. (pyper (1998)) give new values of ; however, we prefer to infer the magnetic geometry from Borra & Landstreet measurements which are based on hydrogen lines. In fact, Pyper and co-workers measurements are based on the 634.7 and 637.1 nm lines of silicon and this element is not homogeneously distributed on the surface of CU~Vir (Kusching et al. kusching (1999)). Even if we cannot exclude a more complex topology of the magnetic field, like a dipole+quadrupole or a decentered dipole, as proposed by Hatzes (hatzes (1997)), the assumption of a simple dipole at an height above the photosphere where the radio emission is generated seems reasonable, as the strength of the quadrupole field decreases one order of magnitude faster than the dipole field.
A summary of the adopted and derived parameters for CU~Vir is reported in Table 1.

4 The 1.4 GHz emission
The observed 1.4 GHz emission is shown in Fig. 2 as a function of the phase during the three days of observation separately. In Fig. 3 a summary of the behavior of other three frequencies as a function of the phase for the whole observing run is reported. The smooth variations of the radio flux and of the circular polarization at the higher frequencies will be discussed elsewhere, together with a numerical model for the continuum radio emission from MCP stars.
4.1 Correlation with the magnetic field
Since Leone & Umana (leo93 (1993)) reported a correlation between radio emission and effective magnetic field in HD 37017 and HD 37479, we look first at a similar correlation for our data. Fig. 4, upper panel, shows the 1.4 GHz emission as a function of the rotational phase. This emission is characterized by two or three components: a basal flux of mJy and very large increments of the flux around phases 0.35-0.45 and 0.75-0.85, where it goes up to 15 mJy, and secondary peaks of up to 7 mJy, further discussion of which is deferred to Section 5.2.2. Only in two moments, at phase 0.85 and 0.97, the intensity drops below 1 mJy. Phasing the magnetic data from Borra & Landstreet (borra (1980)) and Pyper et al. (pyper (1998)) (Fig. 4, lower panel), we found that those peaks of the radio emission coincide approximately with the the null magnetic field, i.e. when the axis of the dipole is almost perpendicular to the line of sight. The peak visible at phase 0.35-0.45 is defined by the observations on June 2 (maximum) and 6 (rising phase), and the 0.75-0.85 one on June 2 (rising phase) and 11 (maximum) (see also Fig. 2). According to the accuracy of the period given by Pyper et al. (pyper (1998)), our data are phased with respect to the magnetic data better than .
It is worthy to note that the flux density of the peaks is about five times larger than those previously reported in the literature at this frequency for MCP stars. Previous observations of CU~Vir reported by Leone et al. (leo96 (1996)) show that the 1.4 GHz flux is 2.6 mJy, in agreement with the ”out of peaks” emission here reported.
The high flux increment, that occurs at the particular orientation of the magnetosphere, indicates an emission mechanism that is not explainable with the emission models up to now proposed. In the following, we will analyze further characteristics of this emission.

4.2 Polarization
A further exceptional aspect of the 1.4 GHz is its high degree of circular polarization. Fig. 5, where the Stokes V parameter (V = 1/2(RCPLCP)) is plotted versus the rotational phase, shows that the increment of the flux occurs only in the right-hand circular polarization. Six peaks, denoted with the letters from a to f in Fig. 5, are visible, the largest and broad emission being detected in peaks a and d, that occur in coincidence with the null magnetic field. Outside the peaks, the Stokes parameter V is statistically null. The percentage of polarization goes up to 80 % during the main peaks a and d. If we subtract the continuum radio emission, that contributes for about 3 mJy, we get %.
In order to verify if the behavior of the right-hand circular polarization was not due to an instrumental problem, we looked for other sources in the field of our star to be monitored for the polarization at the same times of our observations. Leone et al. (leo96 (1996)) found in the 6 cm VLA frames centered at the CU~Vir position a radio source with coordinates: and , that they used to check possible instrumental effects. This field source is visible also in the 1.4 GHz map showed in Fig. 6 and has a flux density (Stokes I) of about 3 mJy, comparable with CU~Vir outside the peaks. By comparing the polarizations (Stokes V) of the field source and of CU~Vir, we can rule out any instrumental effects (Fig. 7).


4.3 Directivity of the radio emission
Since the polarized peaks have been observed in the three different days of observation, we can conclude that this radiation is stable at least in a period of weeks. The observed variations can be due to the different inclination that the oblique dipole forms with the line of sight as the star rotates. In a particular geometric configuration, highly beamed radiation is emitted toward the Earth, producing the observed peaks. As already pointed out, the main peaks of the right-hand circular polarization corresponds almost to the zero of the average magnetic field over the surface of the star. This means that the maxima of this emission occur when the magnetic axis is almost perpendicular to the line of sight.

Borra & Landstreet (borra (1980)) found that the magnetic curve is delayed with respect to the light curve. Assuming that the two main peaks occur in two symmetric orientations of the magnetosphere, we can compute this shift with good accuracy: from our data, peaks and show their maxima at phases and respectively, and therefore
Once the geometry of the magnetosphere of the star has been defined by the values of the inclination and the obliquity (see Table 1), we can find the angle that the line of sight forms with respect to the axis of the dipole, defined by:
The error of estimated from this relation and from the uncertainty in the angles and is about when and when and . Fig. 8 shows the change of the orientation of the star, and so of the angle , with the rotation.
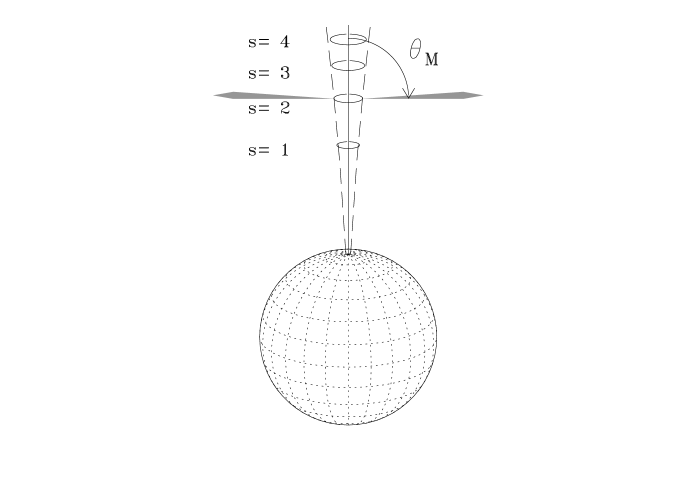
Fig. 9 shows the behavior of the polarized component of the emission as a function of the angle in a polar view. The main peaks are emitted at an angle of about with respect to the axis of the dipole (indicated as the arrow B), and have a high degree of directivity, with an half power beam width of about . For the less intense peaks and , the beams have a narrower width of about . Fig. 10 shows the details of the main peaks as a function of the angle . It is important to note that the magnetic longitude of the line of sight during the two main peaks are different, since in these configurations the star shows opposite hemispheres (see Fig. 8). This means that the observed phenomenon is not related to an active longitude, depending only on . It seems to be similar to the pulses observed in pulsars, the magnetic fields of which are, like MCP stars, typically characterized by oblique dipole geometries.

5 Discussion
To explain the radio continuum and the X-ray emissions from young magnetic B stars and Bp-Ap stars, André et al. (andre (1988)) proposed a model where the stellar wind plasma flows out near the magnetic poles along the field lines. Far from the star, such a wind draws the field lines near the equator into current sheets which should be location of particle acceleration. Mildly relativistic electrons return to regions near the star by traveling along the magnetic field lines, emitting gyrosynchrotron radiation. This model has been applied by Linsky et al. (linsky (1992)) to explain the flat spectra of the MCP stars.
The characteristics of the polarized component of the radio emission at 1.4 GHz from CU~Vir, that show high degrees of circular polarization and high directivity, can be explained in terms of coherent emission. The two major mechanisms that have been suggested to explain coherent radio emission are plasma radiation due to Langmuir waves and cyclotron maser. Plasma radiation has been invoked in several cases, such as solar microbursts at 1.4 GHz (e.g. Bastian bastian (1991)), solar millisecond spikes (e.g. Wentzel wentzel (1993)) and radio bursts from the flare star AD~Leo (Abada-Simon et al. abada (1997)). The theory of Electron Cyclotron Maser Emission (ECME) (e.g. Wu & Lee wu (1979) or Melrose & Dulk meldulk (1982)) seems to be the favourable emission mechanism to explain coherent radiation from the magnetosphere of Jupiter, solar spike bursts and flare stars, like M dwarfs and RS CVn binary systems.
5.1 Plasma Radiation
Plasma radiation is a two-stage process where longitudinal waves in the plasma (Langmuir waves) are first generated and later their energy is converted into radiation (e.g. Dulk dulk (1985)). The frequency of the radiation is the plasma frequency ( Hz, with the plasma density number in ) or its second harmonic. To be observed at 1.4 GHz, or respectively for . Plasma radiation can occur when the magnetic field is relatively weak (, where , with in gauss). This gives an upper limit for the magnetic field in the region where the radiation is generated: () or gauss (). Assuming a dipolar topology of the magnetic field, , with gauss, we get that the region where plasma emission occur must be located at () or ().
However, the theory of plasma radiation does not foresee any high directivity. For this reason this mechanism is not suitable to explain our observations.
5.2 Electron Cyclotron Maser Emission
Following the theory of the ECME, electrons reflected by the magnetic mirrors can develop a pitch angle anisotropy (or loss cone anisotropy), becoming candidates for cyclotron maser emission if the local plasma frequency is relatively small (). The frequency of the maser emission is given by , being the harmonic number and the gyrofrequency. The faster growth rate is for the first few harmonic number () in the extraordinary mode (x-mode). The radiation generated where the magnetic field intensity is has a frequency ; when crossing a more external layer with , it can be suppressed by the gyromagnetic absorption of the thermal plasma. Melrose & Dulk (meldulk (1982)) show that the harmonic is generally suppressed, while the can escape from layers absorbing at higher harmonic numbers. The ECME is confined in a hollow cone of half-angle with respect to the line of the magnetic field, with and the speed of the emitting electrons. The thickness of the hollow cone is . If the maser is emitted in a region of constant magnetic field, the relative bandwidth is . However, if the emission comes from a layer where the magnetic field ranges from to , then the observed bandwidth will be much larger, ranging the radiation from to . In this case, the angle and the thickness of the hollow cone of radiation do not change, depending only on .

5.2.1 The main peaks
We observe that the two main peaks and are beamed at an angle with respect to the axis of the dipole, and have a full width half maximum (FWHM) of about (Fig. 10). This strongly suggests that we are in presence of ECME.
We propose the following scenario: the electrons accelerated in the current sheets out of the Alfvén radius flow toward the photosphere close to the magnetic pole; they are eventually mirrored back by the increasing magnetic field, traveling along field lines almost parallel to the axis of the dipole. After the reflection, they develop a loss cone anisotropy because of the interaction with the thermal plasma, leading to electron cyclotron maser emission. In this hypothesis the angle is just the angle of the ECME theory. Since and , we get .
If the magnetic field of CU~Vir is a dipole, we should expect a symmetry in the ECME with the stellar phase. The absence of any beamed emission at (i.e. at from the direction of the south pole) suggests an asymmetry of the magnetosphere. The presence of a quadrupole component, that has been observed in other MCP stars like HD~32633 and HD~175362 (Mathys mathys (1991)), or of a decentered dipole, as recently proposed for CU~Vir (Hatzes hatzes (1997)), could explain the observed asymmetry of the ECME. In fact, the presence of a quadrupole, as for example shown by Michaud et al. (michaud (1981)) in their figure 1d, can inhibit the wind, and so the radio emission, from the magnetic south pole. The interpretation of an asymmetry in the wind is not new. In fact Brown et al. (brown (1985)), from the behavior of the UV lines of the MCP star HD~21699, inferred that the wind flows from ”only one of the magnetic poles”.

5.2.2 The secondary peaks
The secondary peaks , , and are, like the main peaks and , also circularly polarized. The maximum flux density that they show is about 3 mJy in the Stokes V, as it is possible to see inspecting Fig. 12. Peak lasts for 2 minutes (half power to half power) and a further rise is possible. It has been detect on June 6 at phase 0.5; at the same phase, on June 11, no flux enhancement has been observed, meaning that probably peak is a transient phenomenon. Peak lasts about 3–4 minutes and is followed by the rise of the main peak . Peak is very short in duration, about one minute, and peak is about 4 minutes. While the main peaks and are detected in all the three days of observation, we cannot say if , , and are sporadic impulsive emissions or if they are stable as the main ones. Further observations are needed to clarify this point.
5.2.3 The bandwidth
Our observations have been performed at two bands of 50 MHz separated by 80 MHz. No difference of flux between the two bands has been found. So, the bandwidth of the masing radiation is . Since in the ECME theory , with we expect a bandwidth of about 10 MHz. This apparent incongruence can be explained if the region where the maser emission is generated covers a wide range of magnetic field strength. The observed radiation is the envelope of a continuous series of maser spots along the field lines, the higher frequency being emitted in regions closer to the star, according to . In a dipole ; with gauss, GHz. To be observed at 1.4 GHz, the maser spots are located at , with . On the contrary, we did not observed any coherent emission at 5 GHz, as we will discuss in a following paper. So, no condition for the maser mechanism is expected close to the star. The maser mechanism is efficient at a distance . Probably the electrons are thermalized close to the star, due to a higher density.
5.2.4 Why only right hand circular polarization?
The Stokes parameter V is always positive, that means the radiation is right hand polarized. The theory of the ECME foresees that the radiation is almost entirely polarized in X-mode, as observed for the auroral kilometric radiation (AKR) and for the Jupiter’s decametric emission (DAM) (Wu & Lee wu (1979), Melrose melrose (1976)). In fact, in the x-mode the sense of rotation of the electric vector is the same as the helicity of the emitting particles. Electrons moving in a magnetic field directed toward us are seen to rotate in counter clockwise, as the right hand circular polarization. In a perfectly symmetric configuration, the electrons mirrored outward move in the same direction as the magnetic field lines in the north hemisphere, in opposite direction in the south hemisphere, emitting respectively in right and left hand polarization.
Our data show no LCP enhancement at any rotational phase. This suggests that there is no condition for cyclotron maser emission at 20 cm in the magnetic south hemisphere. Again, this can be imputed to an asymmetry in the magnetosphere of CU~Vir.
6 Conclusions
The discovery of the coherent radio emission from CU~Vir, that can be explained in terms of Electron Cyclotron Maser Emission, opens new prospectives in the field of the magnetic chemically peculiar stars.
An important question that can be put is: is the coherent radio emission at low frequency a common characteristic of the magnetic chemically peculiar stars? Low frequency observations of a sample of MCP stars that present a reversal magnetic field have to be carried out in order to answer this question. Such a survey will certainly put more stringent parameters to draw the physical mechanisms that act in the magnetosphere of the MCP stars.
Further observations on CU~Vir are needed to confirm that the coherent radio emission here reported is stable in time. In particular, a continuous coverage with the rotational phase to better define the angular distribution of the coherent emission is crucial. Moreover, further observations covering several rotational periods are also needed to study the nature of the secondary peaks and to determine whether or not the phases at which they occur are truly random.
The bandwidth of the radiation is found to be larger than 80 MHz. Observations at frequency lower than 1400 MHz are needed to better define the spectrum.
Acknowledgements.
We thank the referee, Dr. S. Drake, for comments and suggestions which enabled us to improve this paper.References
- (1) Abada-Simon M., Lecacheux A., Aubier M., Bookbinder J.A., 1997, A&A 321, 841
- (2) André P., Montmerle T, Feigelson E.D., Stine P.C., Klein K.L, 1988, ApJ 335. 940
- (3) Bastian T.S, 1991, ApJ 370, L49
- (4) Barker P.K., 1986, Magnetic Fields and Winds of the Intermediate Helium Stars. In: Hydrogen Deficient Stars and Related Objects, Hunger K., Schoönberner D., Rao N.K., (eds), Proc. IAU Col. 87. Reidel, Dordrecht, 277
- (5) Brown D.N., Shore S.N. Sonneborn G., 1985, AJ 90, 1354
- (6) Catalano F.A., Renson P., 1998, A&AS 127, 421
- (7) Deutsch A.J., 1952, ApJ 116, 356
- (8) Dulk G.A., 1985, ARA&A 23, 169
- (9) Drake S.A., Abbot D.C., Bastian T.S., Bieging J.H., Churchwell B.E., Dulk G., Linsky J.L., 1987 ApJ 322, 902
- (10) Borra E.F., Landstreet J.D., 1980, ApJS 42, 421
- (11) Hatzes A.P., 1997, MNRAS, 288, 153
- (12) Kusching R., Ryabchinova T., Piskunov N.E., Weiss W.W., Gelbmann M.J., 1999, A&A 348, 924
- (13) Leone F., 1991, A&A 252, 198
- (14) Leone F., Umana G., 1993, A&A 268, 667
- (15) Leone F., Umana G., Trigilio C., 1996, A&A 310, 271
- (16) Lim J., Drake S.A., Linsky J.L., 1996, Rotational Modulation of Radio Emission from the Magnetic Bp Star HR 5624. In: Radio Emission from the Stars and the Sun, Taylor A.R. and Parades J.M. (eds.), ASP Conf Series, Vol. 93, 324
- (17) Linsky J.L., Drake S.A., Bastian T.S., 1992, ApJ 393, 341
- (18) Mathys G., 1991, A&AS 89, 121
- (19) Melrose D.B., 1976, ApJ 207, 651
- (20) Melrose D.B., Dulk G.A., 1982, ApJ 259, 844
- (21) Michaud G., Mégessier C., Charland Y., 1981, A&A 103, 244
- (22) North P., 1998, A&A 334, 181
- (23) Perryman M.A.C., Lindegren L., Kovalevsky J. et al., 1997, A&A 323, L49
- (24) Phillips R.B., Lestrade J-F., Nat 334, 329
- (25) Pyper D.M., Ryabchinova T., Malanushenko V., Kusching R., Plachinda S., Savanov I., 1998, A&A 339, 822
- (26) Shore S.N., 1987, AJ 94, 731
- (27) Shore S.N., Brown D.N., 1990, ApJ 365, 665
- (28) Stȩpień K., 1998, A&A 337, 754
- (29) Stibbs D.W.N., 1950, MNRAS, 110, 395
- (30) Wentzel D.G., 1993, ApJ 407, 380
- (31) Winzer J.E. 1974, Ph.D thesis, University of Toronto
- (32) Wu C.S., Lee L.C., 1979, ApJ 230, 621