HST Observations of Vibrationally-Excited Molecular Hydrogen in Cluster Cooling Flow Nebulae 111Based on observations with the NASA/ESA Hubble Space Telescope, obtained at the Space Telescope Science Institute, which is operated by the Association of Universities for Research in Astronomy, Inc. (AURA), under NASA contract NAS5-26555
Abstract
We report the results of Hubble Space Telescope NICMOS and WFPC2 imaging of emission-line nebulae in the central galaxies of three clusters of galaxies purported to host massive cooling flows, Perseus (NGC1275), Abell 2597, and PKS0745-191. The spectral signature of vibrationally-excited molecular hydrogen has been seen in every galaxy searched thus far that is central to a cluster cooling flow with an optical emission line nebula. With the exquisite spatial resolution available to us with the Hubble Space Telescope, we have discovered that the vibrationally-excited molecular hydrogen gas extends several kpc from the centers of Abell 2597 and PKS0745-191, while the vibrationally-excited molecular hydrogen in NGC1275 appears to be mostly confined to its nucleus, with some extended emission kpc from the center. The molecular hydrogen in Abell 2597 and PKS0745-191 seems to be nearly co-spatial with the optical emission-line filaments in those systems. There may be a tiny jet visible in the 1.6 m image of PKS0745-191. We also find significant dust absorption features in the 1.6 m images of all three systems. The dust lanes are not strictly co-spatial with the emission-line filaments, but are aligned with and perhaps intermingled with them. The morphology of the emission-line systems suggests that the presence of vibrationally-excited molecular hydrogen is not purely an AGN-related property of cluster “cooling-flow” nebulae, and that the optical and infrared emission-line gas, that is, the ionized and vibrationally-excited molecular gas have similar origins, if not also similar energy sources. The infrared molecular hydrogen lines are much too bright to be generated by gas simply cooling from a cooling flow; furthermore, the gas, because it is dusty, likely did not condense from the hot intracluster medium (ICM). We examine some candidates for heating the nebulae, including X-ray irradiation by the ICM, UV fluorescence by young stars, and shocks. UV heating by young stars provides the most satisfactory explanation for the H2 emission in A2597; X-ray irradiation is energetically unlikely and strong shocks ( km s-1) are ruled out by the high H2/H ratios. If UV heating is the main energy input, a few billion solar masses of molecular gas is present in A2597 and PKS0745-191. UV irradiation models predict a significant amount of micron emission line from higher excitation H2 transitions and moderate far infrared luminosities () for A2597 and PKS0745-191. Even in the context of UV fluorescence models, the total amount of H2 gas and star formation inferred from these observations is too small to account for the cooling flow rates and longevities inferred from X-ray observations. We note an interesting new constraint on cooling flow models: the radio sources do not provide a significant amount of shock heating, and therefore they cannot counterbalance the cooling of the X-ray gas in the cores of these clusters.
1 Introduction
The high density of the hot intracluster medium (ICM) at the centers of many clusters of galaxies implies that this central ICM may cool within a Hubble time. The short cooling time of this gas prompted suggestions that the ICM in these clusters cools and flows towards the center, where it subsequently condenses (see Fabian 1994 and references therein for a review.) The central galaxies of clusters suspected to harbor such “cooling flows” frequently display luminous, extended emission line nebulae (e.g., Heckman et al. 1989), which appear to be ionized and at least partially heated by hot, young stars (Voit & Donahue 1997; Cardiel, Gorgas, Aragon-Salamanca 1995, 1998; Hansen et al. 1995; Johnstone, Fabian & Nulsen 1987). The star formation rates inferred from such observations are similar to those in some starburst galaxies (e.g. McNamara 1997). The optical emission-line luminosities from the “cooling-flow” nebulae are strongly correlated (99.94% confidence) with the mass flow rate inferred from the X-ray measurements, albeit with a dispersion spanning up to two orders of magnitude (Heckman et al. 1989). The emission-line nebulae are common, appearing in of X-ray selected clusters of galaxies (Donahue, Stocke & Gioia 1992). The emission-line nebulae in clusters seem to avoid clusters with central cooling times longer than about a Hubble time (Hu et al. 1990). Yet the optical emission line gas itself appears to be dusty (Donahue & Voit 1993; Sparks, Ford & Kinney 1993; Sparks, Macchetto, & Golombek 1989), and thus is not likely to be a direct condensate from the ICM.
The presence of vibrationally-excited molecular hydrogen may be as prevalent as optical emission line nebulae in the central galaxies of cluster cooling flows. All central cluster galaxies with large inferred mass deposition rates and powerful optical emission-line systems observed to date with sufficient sensitivity emit strong molecular hydrogen emission in the 2 micron 1-0 S(1) line (Elston & Maloney, 1992; Elston & Maloney 1994). More recent IR spectroscopic observations of radio galaxies associated with strong cooling flows reveal that these galaxies produce H2 emission while other radio galaxies do not (Falcke et al. 1998; Jaffe et al. 1997). The infrared spectra show H2 vibrational line ratios characteristic of collisionally excited K molecular gas.
Dusty nebular filaments do not only appear in cluster cooling flows. Such structures have also been detected in early type galaxies in small groups (e.g. Goudfrooij & Trinchieri 1998; Singh et al. 1994), and in interacting gas-rich galaxies (Kenney et al. 1995; Donahue et al. in preparation). The characteristics in common with cooling flow optical emission-line filaments are the size scales (kiloparsecs) and the prominent forbidden line and recombination emission ([NII], H). Some of these sources have had recent interactions. Most of these sources also have hot ISM or are embedded in a cluster or group. In none of these objects is the source of the filament energy understood.
This paper is organized as follows. Our targets are described in Section 2. In Section 3 we describe the observations. Section 4 outlines the data reduction and analysis techniques for both Hubble Space Telescope (HST) NICMOS and WFPC2 data including construction methods for isophotal profiles, for continuum subtraction from the emission-line flux, and for absolute flux calibration. In Section 5, we report and discuss the emission line fluxes inside the central 2” of each source. In Section 6, we compare the morphology of the molecular gas to the ionized gas, the 1.6 micron dust, and the radio emission. In Section 7, we investigate the opacity and reddening of dust at multiple wavelengths. We discuss the implications of our results for the source in §8 and for the heating mechanism in §9. We review our conclusions in §10. We also report our 1.6-m photometry for the young clusters in NGC1275 in Appendix A. Luminosities and angular distances are calculated assuming and km s-1 Mpc-1.
2 Sample Selection
Three cluster targets, Perseus, Abell 2597, and PKS0745-191, were chosen for imaging with the Hubble Space Telescope (HST) NICMOS camera in order to study the relationship between the vibrationally-excited molecular hydrogen, the optical line-emitting gas, the dust, and the radio source in the central few arcseconds of X-ray luminous clusters. NGC1275 is in the center of the Perseus cluster, and PKS0745-191 is the name of the radio source in the cluster of the same name, but as a convention, we will refer to the central galaxy in Abell 2597 by the name of its host cluster, and not by the name of its radio source (PKS 2322-122). All three targets are embedded in cooling flows with significant cooling rates. The nuclei of all three targets were known a priori to emit bright infrared H2 lines whose observed wavelengths fall within the bandpasses of narrow-band NICMOS filters. Star formation rates inferred from the blue optical excess in all 3 systems span M⊙ yr-1 (McNamara, 1997). Global target properties are summarized in Table 1.
| Target | Redshift | Scale | kT | ||
|---|---|---|---|---|---|
| ( yr-1) | ( kpc/arcsec) | (keV) | |||
| NGC1275 | 0.0175 | 250 | 0.24 | 6.3 | 14.5 |
| Abell2597 | 0.0852 | 130 | 1.07 | 8.5 | 2.5 |
| PKS0745-19 | 0.1028 | 450 | 1.26 | 9.1 | 46.1 |
NGC1275 is the nearest massive cooling flow, with an inferred cooling rate of M⊙ yr-1 (Edge & Stewart, 1991). It is rather atypical for a cooling flow, however, with an luminous AGN in its center and a foreground, high-velocity system, possibly a colliding galaxy (Hu et al. 1983). Because NGC1275 is known to be a notoriously complex albeit bright, cluster cooling flow system, we also observed Abell 2597 and PKS0745-191, two somewhat more typical cooling flow cluster nebulae that have luminous, unresolved H2 emission. These two cluster galaxies have among the most luminous 1-0 S(1) nuclear emission observed by Elston & Maloney (1994).
In NGC1275, there is a large amount of cold molecular gas – , assuming the debatable standard CO/H2 conversion – most recently mapped in CO by Bridges & Irwin 1998 and Braine et al. 1995. The CO emission was discovered by Lazareff et al. 1989. In contrast, CO from cold molecular gas has not been detected in PKS0745-19 (O’Dea et al. 1994), with an upper limit of , again assuming the standard conversion. McNamara & Jaffe (1994) searched six other cooling flow clusters with comparable mass cooling rates for a trace of cold molecular gas (CO), and found nothing with similar limits. Abell 2597 has not been observed in the radio for CO, but notably, it is the only known cluster radio source other than NGC1275 with H I absorption (O’Dea, Baum & Gallimore 1994).
Specific comments regarding each source follow here.
NGC 1275: NGC 1275 (catalog ) is a complex galaxy system with (Strauss et al. 1992) (1 arcsec = 0.24 kpc h-1, ). It is a Seyfert galaxy (Seyfert 1943), an IRAS galaxy (Strauss et al. 1992), a Markarian galaxy, a blazar, the cD galaxy of the Perseus cluster (Abell 426 (catalog )), a merger system, and a radio source (3C84 (catalog ) or Perseus A (catalog )). It has a giant nebula of luminous optical emission-line filaments (cf. Burbidge & Burbidge 1965) extending kpc from its center. Perseus (catalog ) is the closest example of a cluster of galaxies with a massive cooling flow with (Peres et al. 1998; Mushotzky et al. 1981; Edge & Stewart 1991). Fischer et al. (1987) first discovered vibrationally excited molecular hydrogen in its nucleus.
A2597: The central galaxy of Abell 2597 (catalog ) (, Struble & Rood, 1987), (, 1 arcsec = 1.07 kpc), also known as PKS2322-123 (catalog ), is in the center of a massive cooling flow ( yr-1 (Crawford et al. 1989). It has a tiny double sided radio source (Sarazin et al. 1995) and small blue lobes (McNamara & O’Connell 1993), which are relatively unpolarized and thus are thought to be scattered light or synchrotron emission (McNamara et al. 1999). It has an extensive and luminous emission line nebula (Crawford et al. 1989; Heckman et al. 1989), whose emission lines are inconsistent with being produced by shocks (Voit & Donahue 1997).
PKS0745-191: PKS0745-191 (catalog ) (, Hunstead, Murdoch & Shobbrook 1978); (, 1 arcsec = 1.26 kpc) contains a strong cooling flow, M⊙ yr-1 (Allen 2000; Peres et al. 1998; Edge & Stewart 1991; Fabian et al. 1985), a powerful H source (Fabian et al. 1985), and like Perseus and A2597, excess blue light in the interior few kpc (McNamara & O’Connell 1992; Fabian et al. 1985). It is radio-loud compared to NGC1275 ), with 5-10 times the radio luminosity of NGC1275 at 1.4 GHz (Baum & O’Dea 1991.)
3 HST Observations
High signal-to-noise observations of the molecular hydrogen and continuum were acquired with the HST NICMOS2 camera, with a pixel size of 0.075” and a field of view of , (Thompson et al. 1998) using narrow and broad-band filters. For NGC1275, the narrow band F216N filter allows the observation of the H2 1-0 S(1) line (rest wavelength 2.12 microns). The other two targets were observed in the 1-0 S(3) line (rest wavelength 1.956 m) whose nuclear flux is nearly equal to the 1-0 S(1) flux in these systems (Falcke et al. 1998; Elston & Maloney 1994). This line redshifts into the bandpasses of the F215N and F212N NICMOS filters for PKS0745-191 and A2597 respectively. We obtained broad band F160W images for continuum measurements. The bandpass of the F160W filter (H-band) is sufficiently wide and the emission lines sufficiently weak such that the F160W image is of nearly pure continuum light.
To image the optical line emission at a spatial resolution similar to our molecular-line maps, we acquired HST Wide-Field Planetary Camera 2 (WFPC2) data (Holtzman et al. 1995), both through our own program and from the Hubble Data Archive. The WF cameras have 0.0966” pixels and field of view, while the PC camera has 0.0455” pixels and a field of view. For NGC1275, we retrieved archival WFPC2 data taken with the linear ramp filter (LRF) at 6676Å centered on H and [N II] of the low-velocity system. The LRF has a very narrow bandwidth and is “tuned” to the desired central wavelength by appropriate target placement in the field of view. For A2597 we used archival WFPC2 imaging of [OII]3727 emission through the F410M filter and of H+[NII] emission measured through the F702W filter. The stellar continuum images were taken through the F702W filter for NGC1275 and the F160W filter for A2597. We observed PKS0745-191 through the LRF for an H image. Blue continuum imaging was carried out using the F439W filter. The total exposure times and observational parameters for each observation are presented in Table 2.
| Target | Camera | Filter | Date | Datasets | Exp. time (sec.) |
|---|---|---|---|---|---|
| NGC1275 | NICMOS2 | F216N | 08/15/97 | N46001010 | 1536 |
| F160W | 08/15/97 | N46001020 | 256 | ||
| F160W | 03/16/98 | N3ZB1R010 | 640 | ||
| WFPC2 | FR680N | 09/10/95 | U2S01601T | 600 | |
| F702W | 03/31/94 | U27L1G01T-G04T | 560 | ||
| F702W | 11/16/95 | U2PF0402T-405T | 4500 | ||
| F450W | 11/16/95 | U2P0407T-40AT | 4900 | ||
| ABELL2597 | NICMOS2 | F212N | 10/19/97 | N46003010-3020 | 12032 |
| 12/03/97 | N46004010-4030 | ||||
| F160W | 12/03/97 | N46004ZBQ | 384 | ||
| WFPC2 | F410M | 07/27/96 | U3CU0101T-104T | 2200 | |
| F450W | 07/05/95 | U2PF0203T-204T | 2500 | ||
| F702W | 07/05/95 | U2PF0201T-202T | 2100 | ||
| PKS0745-191 | NICMOS2 | F215N | 10/10/97 | N46002010-2030 | 7168 (3566)aaEffective exposure time for the degraded NICMOS observation in parentheses. |
| 09/06/98 | N46005010 | ||||
| F160W | 10/10/97 | N46002040 | 512 | ||
| WFPC2 | FR680N | 10/11/97 | U460A201R-204R | 3200 | |
| F439W | 10/11/97 | U460A205R,206R | 1000 |
4 HST Data Reduction and Calibration
4.1 Image Reduction
HST NICMOS multiaccum data may present the observer with significant data reduction challenges, which could not be handled within the current standard HST pipeline software called calnica. In the following section we describe our infrared data reduction and calibration process, using tasks in the Space Telescope Science Data Analysis System (STSDAS, v2.1.1), obtained as a standard package in the publically-available Image Reduction and Analysis Facility (IRAF, v2.11.3). The solutions we found may prove a useful guide to readers reducing HST NICMOS data, therefore we describe our reductions in moderate detail, citing the software tasks whenever possible. We assume a convention of naming packages in capitals and tasks in italics. We also estimate the magnitude of the systematic uncertainties arising from imperfect data reduction and calibration.
We calibrated the raw NICMOS data and corrected it for various instrument artifacts following methods which were in development by the NICMOS instrument group at STScI. Images were processed through the first portion of the STSDAS program calnica, producing images which are corrected for dark and bias signals and for nonlinearity. Some additive noise, the dark current “pedestal”, still exists after this correction and must be removed before the flatfielding step to prevent imprinting an inverted response pattern on the final image.
To quantify the zeroth-order pedestal in each quadrant we estimated the mean background signal, excluding sources, which consists of the sky signal plus a constant, quadrant-dependent bias. The initial estimate of the bias level was multiplied by the flatfield and subtracted. This process was done independently for each readout frame and quadrant of the total NICMOS exposure. The median residual was then subtracted from each quadrant, and the root mean square variation of the resulting background was measured. This process was repeated for a range of initial guesses to deduce the value which minimized the root mean square variation of the background and thus, of the influence of the large-scale flatfield pattern. It was necessary to be very careful when subtracting the background from these images, because the outer isophotes of the galaxy also contribute to the large-scale background signal. When the source fills the majority of the frame, separating the bias, sky background, and galaxy light is more difficult. We obtained our best results when we subtracted the pedestal after removing the target galaxy by fitting its surface brightness profile and subtracting the profile from the data.
A residual, noiseless spatial variation, called “shading”, in the bias after dark subtraction remained in only a few of the narrow-band A2597 images, resulting in a position-dependent, low-level background. The bias changes slowly across the field of view, and again, if not removed, it results in an imprint of the flat-field pattern left in the data. The “shading” pattern results because the reference dark image does not precisely reproduce the temperature-dependent dark current if the temperature of the detector varied or was different from that of the reference dark image.
To correct for this small effect, we modelled the background outside the central 7.5” by 7.5” box by median filtering the image with a boxcar size of pixels, and subtracted the resulting median background from the pixels outside the central box region. This procedure, mostly cosmetic, brings out the contrast of the central structures without changing the value of the mean background. The effect of not fully correcting for this additional additive background in the central 7.5” adds an additional systematic uncertainty in the absolute H2 emission-line fluxes for A2597 of after flat-fielding. (Systematic uncertainties in the H2 fluxes arising from calibration are without this effect.)
After we estimated and subtracted the effective dark current, the standard calnica process flatfielded the data, corrected for cosmic rays, and converted the units to counts (or DN) s-1.
The final challenge was to correct for cosmic ray persistence. NICMOS images taken very soon after HST passes through the South Atlantic Anomaly radiation belt are affected significantly by cosmic ray persistence and thus are degraded by noise. The decaying afterglow from energetic cosmic rays persist from one read of the detector to the next, causing the signal from a single cosmic ray event to persist from one read to the next. Two-thirds of our narrow band images of PKS0745 were significantly impacted by persistence. We took significant amounts of off-source data for the narrow-band observations, originally to enable the removal of any significant thermal component at 2 microns. To remove persistant cosmic ray contamination, we modelled the charge decay rate by scaling the off-source images taken later in time and subtracting the scaled image from the initial on-source image. This procedure was iterated until we found a constant value which minimized the root mean square variation of the background. For our affected images, this procedure improved the overall signal to noise by about 30%. Finally, we aligned these processed images and combined them into a single weighted average image.
WFPC2 data are much easier to calibrate, and the standard STSDAS pipeline procedure calwp2, with the standard updated reference files were used to process our data. The linear-ramp-filter (LRF) images were flatfielded with the narrow band filter flat of the nearest available wavelength (filter F673N) (WFPC2 Instrument Science Report 96-06). Images were combined and cosmic rays removed using the STSDAS task crrej.
4.2 Isophotal Fitting and Continuum Subtraction
Isophotal fitting of the NICMOS data was performed for the inner 7” radial region of each galaxy using the STSDAS task ellipse. All parameters (ellipticity, position angle, and center position) were left free to fit the H-band (F160W) continuum. A continuum model was created using the best-fit parameters. A similar ellipsoidal fit was made to the narrow-band data, but with the ellipticity, position angle and centroid fixed to those parameters modelling the continuum data. The difference between the narrow band data and the continuum model, appropriately scaled, provides an estimate of the total amount and extent of the residual H2 emission. The relative scale factor (Table 3, Isophotal Counts Ratio) was determined by matching the galaxies’ isophotal profiles, assuming that at large radii ( 4”-7”) the smooth flux is purely from the galaxy’s stellar component. Since the isophotes should be the same shape at large radii, this last assumption provides a means of assessing the quality of our background subtraction. The background in the narrow-band images consists of three independent quantities: the bias offset, the sky flux, and the continuum. If the background is oversubtracted, the galaxy’s isophotal profile takes a characteristic sharp turn downwards at large radii. By minimizing this “edge”, we were able to fine-tune our background subtraction for images with low signal to noise, and thus improve our ability to subtract the continuum from the narrow band images.
| Target | NGC1275 | A2597 | PKS0745-191 | |
| Redshift | 0.01756 | 0.08520 | 0.1028 | |
| H2 Line Transition | 1-0 S(1) | 1-0 S(3) | 1-0 S(3) | |
| Observed Wavelength () | 2.157 | 2.123 | 2.157 | |
| Continuum Filter | F160W | F160W | F160W | |
| Line Filter | F216N | F212N | F215N | |
| Line Filter FWHM (Å) | 181.6 | 206.8 | 189.1 | |
| (Equation 1) | 1.09 | 1.00 | 1.25 | |
| Nuclear Line FWHM (Å) | 5011Elston & Maloney 1994. | 5011Elston & Maloney 1994. | 5522Falcke et al. 1998. | |
| Isophotal Counts Ratio | 0.056 | 0.060 | 0.055 | |
| Predicted Throughput Ratio | 0.056 | 0.056 | 0.052 | |
| Optical Emission Line | H | H | OII | H |
| Observed Wavelength (Å) | 6678 | 7122 | 4045 | 7237 |
| H/H+[NII] | 0.4433Unpublished Palomar Double Spectrograph spectrum (Donahue). | 0.4144Voit & Donahue 1995. | 0.3855Donahue & Stocke 1994. | |
| Continuum Filter | F702W | F160W | F450W | F439W |
| Line Filter | LRF | F702W | F410M | LRF |
| Line Filter FWHM (Å) | 77.7 | 1381.6 | 219.4 | 84.1 |
| (Equation 1) | 1.00 | 1.08 | 1.09 | 1.00 |
| Nuclear Line FWHM (Å) | 1833Unpublished Palomar Double Spectrograph spectrum (Donahue). | 1544Voit & Donahue 1995. | 1344Voit & Donahue 1995. | 1255Donahue & Stocke 1994. |
| Isophotal Counts Ratio | 0.041 | 0.087 | 0.110 | 0.387 |
| Predicted Throughput Ratio | 0.043 | 0.693**The continuum and emission filters were centered on significantly different wavelengths, thus the flat spectrum assumption breaks down. | 0.112 | 0.169**The continuum and emission filters were centered on significantly different wavelengths, thus the flat spectrum assumption breaks down. |
To test the reliability of this technique of scaling the continuum images, we used the synthetic photometry package SYNPHOT (available in STSDAS within IRAF) to derive the relative flux scale an alternate way: by calculating the expected change in continuum throughput from filter to filter. Using the task bandpar, we were able to estimate the ratio of throughput efficiency for each filter pair for a flat spectrum (in ) source, where the efficiency is defined as the integral over wavelength of the total filter throughput. These values are given in Table 3 (Predicted Throughput Ratio) and show strong agreement with the isophotal predictions, except in the two cases (flagged with asterisks) where the optical continuum filter is of a significantly different wavelength than the emission. In order to desensitize our final results to assumptions regarding the underlying continuum spectra, we based our continuum subtraction on the isophotal profiles.
Because the effects of dust obscuration are much less significant at 1.6m than at shorter wavelengths, we removed the continuum from the WFPC2 emission-line images by fixing the isophotal parameters to match those parameters obtained from the 1.6-m data. For NGC1275, the bandpass of the companion broadband filter also contains the wavelength of the optical emission line of interest, but the filter is wide enough that contamination is only a few percent, and thus the net profile and line fluxes should not be significantly affected.

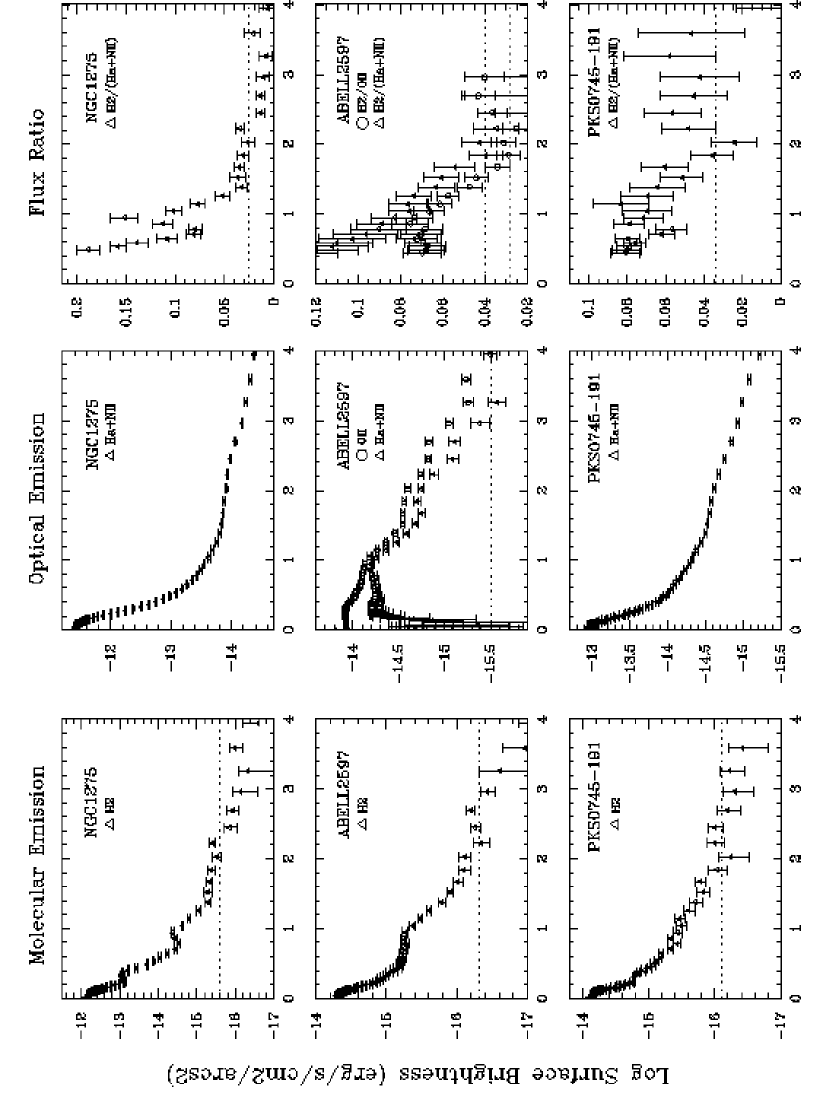
We present the isophotal profiles for each galaxy in Figure 1, with magnitudes per unit sky area provided in arbitrary units. All of the NICMOS narrowband images clearly show H2 line-emission within the central arcsecond of each cooling flow, and all three galaxies show additional extended emission, out to a radius of about 2-3”. The optical continuum for all of the galaxies of course extends beyond the central 8”. We present a morphological comparison of both the ionized and the vibrationally-excited molecular gas in §6.
4.3 Absolute Flux Calibration
We describe here our process for estimating absolute fluxes for the emission line images. Once the residual emission images were created, we converted their count rates to units of absolute flux using the SYNPHOT package. For continuum observations of broadband sources, the standard HST flux calibration provides the correct absolute flux conversion with the overall photometric accuracy better than 5% for the NICMOS data, 2% for the WFPC2 wide and medium band filters, and 3% for the WFPC2 linear ramp filters. A standard method to estimate the flux of a single emission line in () is to assume that the spectrum of the continuum emission is flat (in ), and then to correct for the contribution of the emission line. The following approximation is usually made for HST imaging:
| (1) |
where is the flux in DN sec-1, is the Gaussian width of the filter bandpass, PHOTFLAM is the flux conversion factor for the standard HST flux calibration from the HST data header (units of erg cm-2 Å-1 DN-1), and is a correction factor to account for the position and width of the emission line in the filter bandpass ( when the line falls at the filter center) (HST Data Handbook v3.1, Section 18.2.5). To estimate , we used SYNPHOT to model the instrumental throughput for each filter, we assumed the emission lines to be Gaussian-shaped, and we used the H2 line widths (FWHM) given in Table 3. A DN is “digital number” or a count, and is equal to the number of electrons read out from a pixel multiplied by the detector gain.
We tested the robustness of the standard method by modelling a flat spectrum plus a single emission line first, then calculating the appropriate flux conversion. (See the WFPC2 Instrument Science Report 96-06 describing these methods for the photometric calibration of the LRF’s.) SYNPHOT convolves an emission-line model of a given flux in erg sec-1 cm-2 and the appropriate Gaussian line width with the known throughput of the telescope in each relevant observing mode. SYNPHOT then returns the flux (in DN s-1) that would be expected for each observation. Both methods discussed give similar results for a single Gaussian line, agreeing to within 5% or less.
However, each H observation also included [NII] in its filter bandpass. The ratio of H to the H+[N II] emission for the central 2” of each cluster is reported in Table 3, from ground-based spectroscopy. To determine the net flux of H emission, we had to estimate the contribution from NII in each filter. For A2597, the F702W filter is sufficiently wide that the observed spectroscopic line ratios could be employed to correct the total measured flux for NII contamination. The linear ramp filters used to observe NGC1275 and PKS0745-191, on the other hand, are quite narrow and transmission falls off rapidly away from the filter center, and thus require a more sophisticated approach. To provide the most accurate estimate of pure H, we determined the flux calibration for the specific case of the H[N II] line complex by convolving the appropriate filter and telescope response functions with three Gaussian lines centered at 6548Å, 6563Å, and 6583Å, having the appropriate relative flux ratios, linewidths, and redshifts measured from nuclear spectra for each of the 3 galaxies (Table 3). This correction increases the nominal flux conversion factor by 10% for NGC1275 and PKS0745-191. We then corrected the total measured flux using the spectroscopic [N II]/H line ratios (Table 3).
The sensitivity of our flux calibrations to uncertainties in line widths and to the relative contributions of [N II] and H emission was also tested. The widths of the emission lines could be smaller for off-nuclear regions (H II regions, for example) than they are in the cores of the galaxies. The flux conversion factor for H2 emission decreases by 8%, 1%, and 20% for NGC1275, A2597, and PKS0745-191, respectively, if a FWHM of 5Å rather than 50Å is assumed. For the H line, decreasing the assumed FWHM by a factor of to 2Å results in a 2% flux decrease for NGC1275 and in no change for the other two targets. The [N II]/H ratio assumed in our calculations is an average value from ground-based long-slit observations and could vary spatially. Varying the assumed [N II]/H ratio between 0.5 and 1.5 changes the total (H+[N II]) measured flux very little, altering the total flux of NGC1275 and A2597 by 4% and PKS0745-191 by 1%. However, the inferred H flux could vary by a factor of 2.0 between these two extremes, to be between 60% and 33% of the total measured flux. Therefore, off-nuclear pure H estimates are only good to about a factor of 2. The absolute infrared H2 flux calibration is good to at least 25% off-nucleus where hot dust from the central torus is unlikely to contaminate our measurements, and to approximately a factor of 2 on-nucleus, lacking an estimate for the hot dust contribution. The uncertainties quoted in the following tables do not include these systematic calibration uncertainties, but we take them into account when we compare these data to model predictions.
5 Aperture Photometry
The derived isophotal profiles indicate excess two-micron emission in the central few arcseconds of each galaxy. We know from previous spectroscopy that each of the galactic nuclei produces H2 emission, and that the continuum emission between 1.5 and 2.0 microns is fairly flat. So our absolute photometry in the H-band and 2-micron narrowband filters should allow us to subtract the continuum in the nuclei fairly accurately. We checked this by comparing the continuum scale factor derived from absolute photometry (§4.2) to that derived from matching the galaxy surface brightness profiles at the edges of the NICMOS field of view. Nevertheless, as mentioned in §4.3, our estimates of H2 emission in the nuclei, where the AGN and hot dust from the central torus dominate, can not be precise because of the limitations on our technique.
The net H2 surface brightness was measured from each residual image within concentric annular apertures centered on the galaxy. In Figure 2, the net surface brightness of the H2 emission, the H+[N II] (“optical”) emission, and the molecular to optical flux ratio for the inner 4 arcsec of each galaxy is plotted. Spurious behavior of the flux ratios at radii less than 0.4” is an effect of the NICMOS PSF and its Airy ring. The total H2 fluxes, measured within a radius of 2” are presented in Table 4. The fluxes in these tables have been corrected for Galactic reddening and absorption but not for intrinsic reddening or absorption.
| NGC1275 | A2597 | PKS0745-191 | |
|---|---|---|---|
| Flux H2 (DN s-1) | 176.66.02 | 7.091.23 | 6.731.21 |
| Flux (DN s-1) | 170.06.11 | 10.881.53 | 10.221.22 |
| Flux OII (DN s-1) | 2.930.82 | ||
| Flux H2 erg s-1 cm-2 | |||
| Flux erg s-1 cm-2 | |||
| Flux OII erg s-1 cm-2 | |||
| Lum H2 h-2 erg s-1 | |||
| Lum H+[NII] h-2 erg s-1 | |||
| Lum [OII] h-2 erg s-1 |
NGC1275: For NGC1275, the molecular emission is concentrated in the nucleus of the galaxy. To determine its extent, we compared the radial profile of a typical star with the radial profile of the NGC1275 nucleus in the narrow band image. The measured characteristic radius of the NGC1275 nucleus was only slightly larger than that of the PSF star, implying an intrinsic radial scale of less than 0.09 arcsec (1-1.2 pixels) for the residual emission, corresponding to a physical scale of h-1 pc. The H2 emission line flux of the central source within a 2 arcsecond radius aperture was measured to be , corresponding to an H2 line luminosity of . Faint extended emission is detected up to 2” off-nucleus.
The AGN in NGC1275 is known to be variable, so comparison of photometry from different epochs may not be relevant, but we report earlier flux estimates here. Inoue et al. (1996) measured the total flux of 2m molecular emission in NGC1275 for a 2”x2” region in the center and derived a value of . Using a similar area aperture (), we measured . The ground-based Inoue et al. (1996) observations, done with a 2” by 30” slit, may not have been well-centered on the central source and the conditions were not perfectly photometric. Inoue et al. noted possible variable seeing and/or tracking problems with the standard star. Both problems would also affect flux estimates from a slit observation. They also note a flux deficit with respect to earlier H2 observations by Kawara & Taniguchi (1993) ( in the central 2.5” by 3.0”). Krabbe et al. (2000) report ground-based fluxes of in the central 3”. This discrepancy suggests that our estimate could be contaminated by hot dust continuum from the AGN, contributing almost equal flux as the H2 line to the narrow-band excess on the nucleus. Our off-nuclear surface brightness estimates are consistent with Krabbe et al. (see next section.)
In contrast to the compact vibrationally-excited molecular hydrogen emission, the H line emission completely pervades the PC field of view. Optical line emission through the WFPC2 Linear Ramp Filter (LRF) is detected to the edge of the field; the precise surface brightness of the extended emission is difficult to quantify because the central wavelength of the LRF and the redshift of the emission-line gas varies across the field . The emission-line widths are relatively broad, and the bandpass of the LRF at any position is relatively narrow, thus varying fractions of the [NII] and H line complex are imaged, depending on the position in the field. The location of the nucleus of NGC1275 is such that it is centered on the observed wavelength of H. The H+[N II] emission in an aperture of radius 2” is , and thus is . The ratio of H to 1-0 S(1) H2 line emission in the nucleus of NGC1275 is (, corrected for [NII] contribution and for a contribution of warm dust continuum ranging from 0% to 50% of the estimated 2-micron excess in the nucleus. The ratio is uncorrected for internal absorption.)
A2597: In A2597, the narrow-band infrared images reveal a complex, multi-component structure of vibrationally-excited molecular hydrogen extending over 2 arcseconds north and east of the nucleus. The location of the nucleus is revealed in the 1.6 micron image behind the thick dust absorption feature seen in the optical images. The complex structure of the emission gas is apparent in the differential flux profiles of A2597. The radial surface brightness profile of [O II]3727Å decreases sharply at a radius of 0.3” where a thick dust lane obscures the galaxy’s core. Within an aperture radius of 2”, we derive a total H2 flux of , corresponding to an emission line luminosity of .
We subtracted a scaled H-band image from the F702W image to reveal the emission-line system in H+[NII]. The H image shows the same filamentary structure as does the [OII] image (Koekemer et al. 1999), with an H+[N II] flux of of within 2”, or an H flux of and an [O II] flux of inside 2”, corresponding to optical emission line luminosities of and respectively. The ratio of H to 1-0 S(3) H2 emission in the central 2” is formally , corrected for [NII] but uncorrected for internal absorption.
PKS0745-191: Emission from the H2 gas within the central galaxy of PKS0745-191 is concentrated in the core of the galaxy and in a bright clump just off the nucleus. The total H2 flux within a radius of 2” (or 2.52 kpc) is erg s-1 cm-2, corresponding to an 1-0 S(3) line luminosity of . The total net H+[N II] emission line flux from the same region is , or H alone of . The ratio of H to 1-0 S(3) H2 emission in the central 2” is , corrected for [NII] but uncorrected for internal absorption.
6 Emission Line Maps
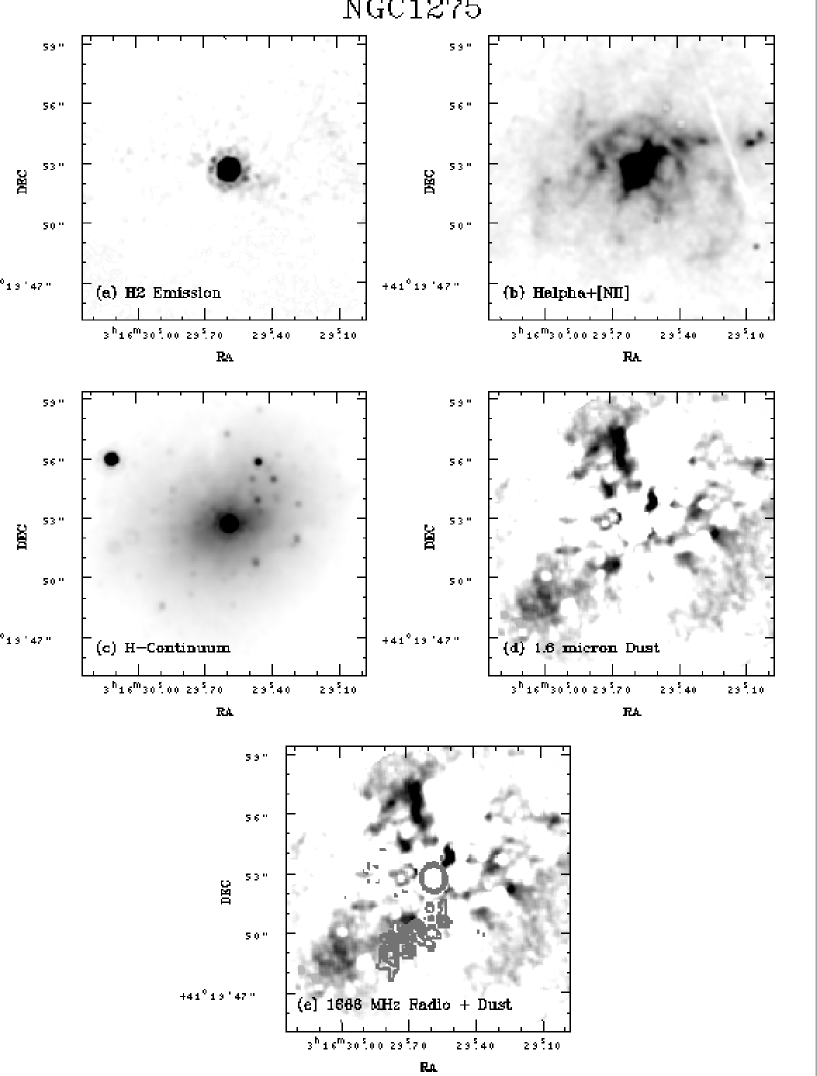

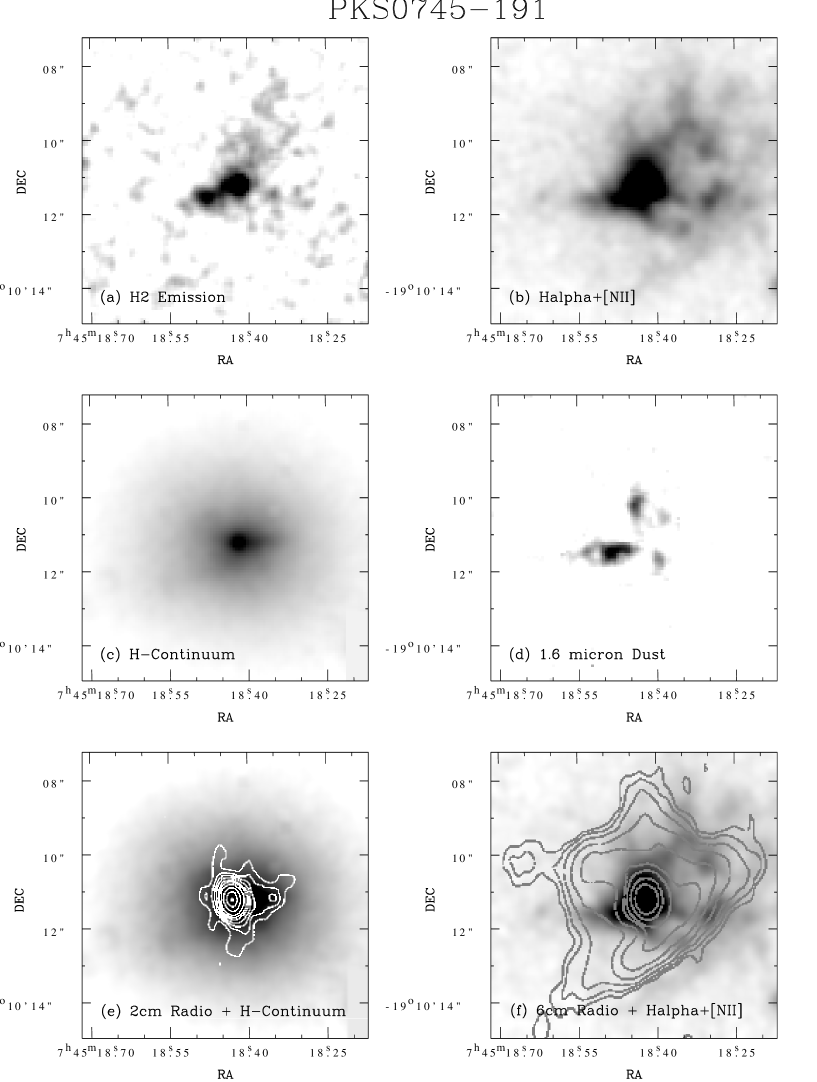
The morphology of the emission from the ionized gas, the vibrationally-excited molecular gas, and the dust absorption were compared for each source. In Figures 3-5, we present side-by-side grey scale comparisons of the molecular hydrogen emission and optical line emission along with the red starlight, the dust, and the radio emission for the central regions of each galaxy. We mapped the obscuration due to dust at 1.6 by dividing each image by its isophotal model and binning the residual. For comparison with radio structures on the same angular scales, we sought radio maps from the literature with angular resolution similar to that of HST. Maps obtained at 666 MHz for NGC1275 (Pedlar et al. 1990), at 8.44 GHz for A2597 (Sarazin et al. 1995), and at 2 cm and 6 cm for PKS0745 (Baum & O’Dea 1991) are contoured over HST greyscale images. All of the images of a given target are plotted at the same angular scale and orientation.
The emission line maps show what the aperture photometry and the radial surface brightness plots only suggested: most of the molecular hydrogen emission from NGC1275 is confined to the nucleus, except for faint wisps to the SW and NE, while the emission from A2597 and PKS0745-191 is clearly extended. The maps reveal that this extended emission is filamentary and traces very similar structures as does the optical line emission. We report a possible jet feature in PKS0745-191. We now discuss each source in turn.
NGC1275: While extended, filamentary H emission fills the central region of NGC1275 (Figure 3b), we detected H2 emission mostly in the nucleus of the galaxy (Figure 3a). The H2 residual image exhibits the pattern of the NICMOS PSF and its first Airy ring, with no structure detected at larger radii. There is a faint trail of emission off to the SW of the nucleus and a small blob east of the nucleus. These features were also seen in ground-based images by Krabbe et al. (2000). We measured similar surface brightnesses. In a 1” by 1” box, the mean surface brightness of the trail feature is , consistent with Krabbe’s estimated for the same feature.
The surface brightness limit for undetected features was computed by masking the obvious point sources in the residual H2 image, and median filtering the residual within a smoothing kernel of an 13 by 13 pixel box. The mean net sky value was DN sec-1 pixel-1, corresponding to a 2 surface brightness threshold of .
H+[N II] emission line surface brightness in the same region were as intense as in a filament 3” west of the nucleus and in a bright feature extending 1” west-northwest of the nucleus. The total amount of H contributing to the emission-line flux is approximately half of the surface brightness in H+[N II]. Therefore, in these bright optical filaments and features, the H/1-0 S(1) H2 line ratio is greater than and , respectively. These line-ratio limits are consistent with line ratios expected from shocked gas in which the molecules have been largely dissociated ( km/sec).
The 1.6 image (Figure 3c) shows a smooth stellar continuum and some dust lanes, along with some of the stellar clusters that were reported in WFPC2 optical observations by Holtzman et al. (1992) We report the IR photometry of the brightest of these clusters in Appendix A. The exposure time for our GO image was only 256 seconds, but this image was improved by co-adding an archival snapshot image of 640 seconds. The residual 1.6 continuum image (Figure 3d) is displayed such that the regions with dust (negative residuals) are grey or black, and the lighter areas are regions with less or no detectable absorption. The absorption map reveals that the central region is embedded in filamentary dust features which wind inward as close as 0.5” from the center. The features do not identically track the morphology of the H emission-line filaments. Some regions of strong dust absorption also seem to have powerful H emission, such as the region just NW of the nucleus, but for the most part the dust features are at best tangled with the ionized gas filaments. The 666 MHz radio contours (Pedlar et al. 1990) show the AGN point source and a feature extending SE parallel to a dust feature.
A2597: The residual H2 emission map (Figure 4a) shows very distinct filamentary structure extending from the nucleus of the galaxy. This extended, filamentary network traces the complex structure found in both the H and the [OII] emission maps (Figures 4bc) derived from archival WFPC2 observations. Several bright filamentary arms extend outward from the nucleus and arc counterclockwise like tiny spiral arms or tidal tails. The brightest knot of H2 emission is in the core of the galaxy. This has no direct counterpart in either of the optical emission images, likely because of substantial dust obscuration of the center of the galaxy. The optical emission profiles for Abell 2597 are rather flat inside 1”, and certainly not as peaked as the molecular line surface brightness, which may imply that dust may be absorbing the optical line emission at least in the central square arcsecond.
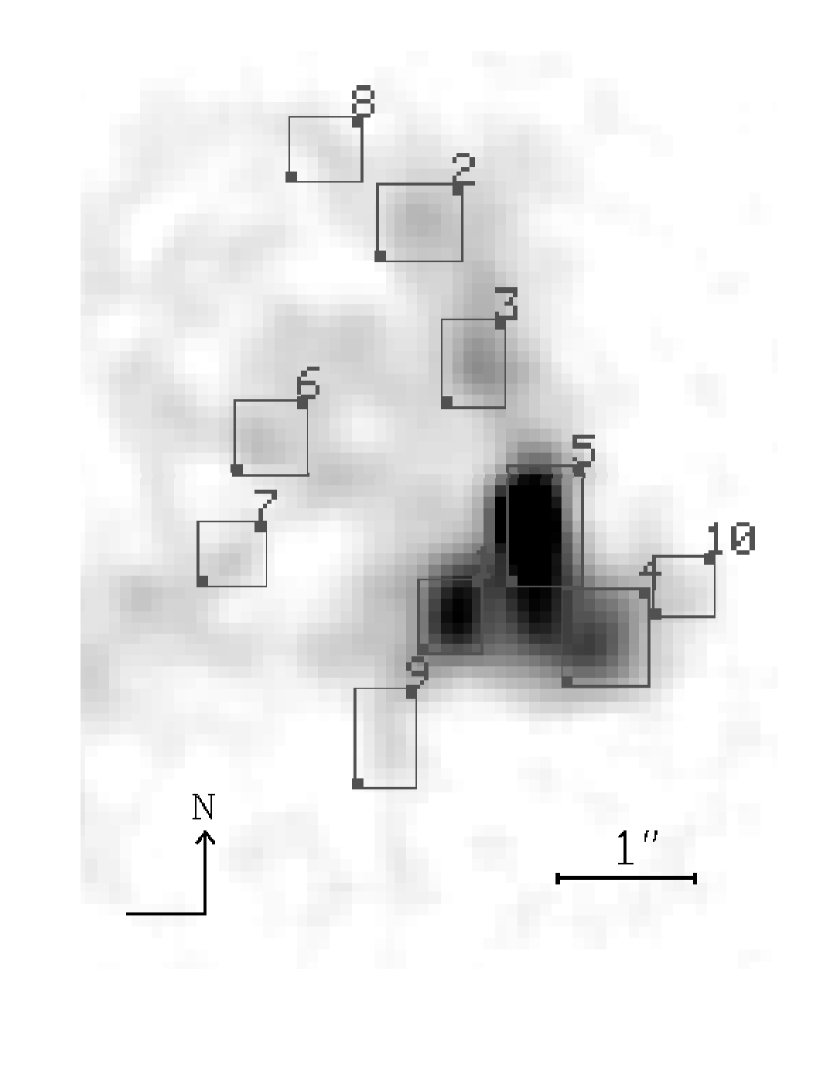
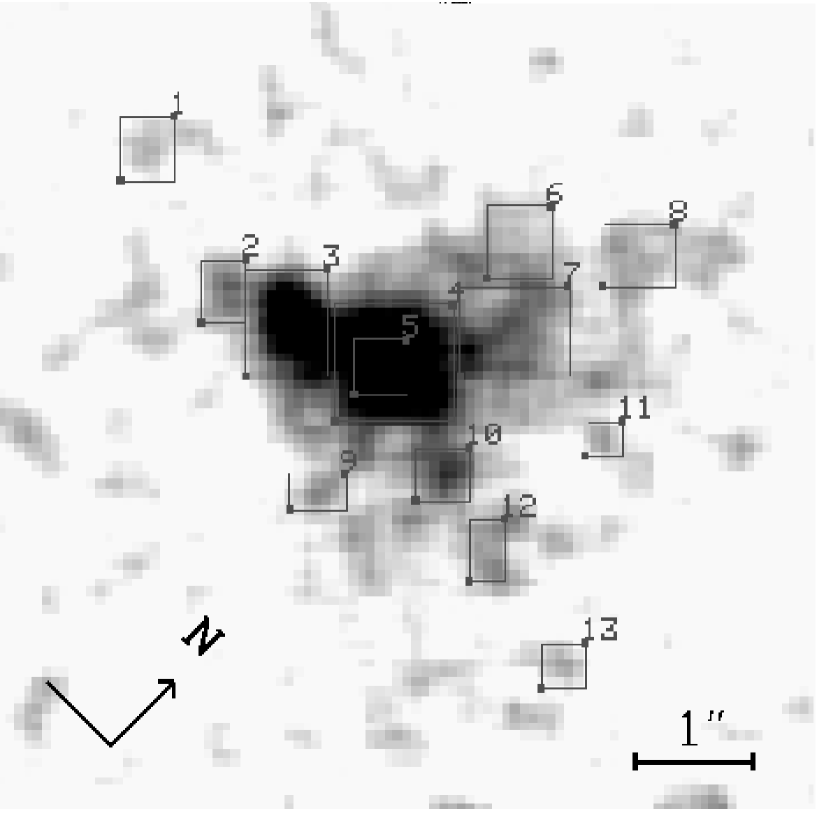
The 1.6 m stellar continuum image (Figure 4e), on the other hand, is quite smooth, with some very faint features which are hot pixels not completely subtracted by processing. The residual 1.6 m absorption image shows little dust absorption (Figure 4f), except for one thick lane extending southeast from the nucleus. This dust lane is offset to the north of the nearby emission arm but is directly adjacent to it. The edges of the radio lobes traces the gas emission and the dust lane extremely well, with the leading edge of each radio lobe aligning precisely with a bright filamentary arm (Figure 4d). These small-scale radio lobes are also correlated with the lobes of blue light, seen best in the F702W isophotal residual image (Koekemoer et al. 1999). The radio source appears to be interacting with the ambient gas and possibly also the dust. This interaction with the ICM may have induced star formation and would thus explain the presence of the blue lobes (McNamara et al. 1993; Koekemoer et al. 1999). In Figure 6, the brightest emission clumps which were found in both the optical and infrared emission-line images are labelled, and we present the flux ratios of these two components in Table 5.
| Clump | Area | H2 | [OII] | |
|---|---|---|---|---|
| arcsec2 | ||||
| 1**Regions with heavy dust obscuration which probably affects at least the observed optical line fluxes. | 0.236 | |||
| 2 | 0.315 | |||
| 3 | 0.270 | |||
| 4 | 0.405 | |||
| 5**Regions with heavy dust obscuration which probably affects at least the observed optical line fluxes. | 0.433 | |||
| 6 | 0.276 | |||
| 7 | 0.203 | |||
| 8 | 0.236 | |||
| 9 | 0.304 | |||
| 10 | 0.203 | |||
| 1**Regions with heavy dust obscuration which probably affects at least the observed optical line fluxes. | ||||
| 2 | ||||
| 3 | ||||
| 4 | ||||
| 5**Regions with heavy dust obscuration which probably affects at least the observed optical line fluxes. | ||||
| 6 | ||||
| 7 | ||||
| 8 | ||||
| 9 | ||||
| 10 |
The core of the ROSAT HRI image of A2597 shows some east-west elongation at the smallest scales resolvable by the HRI () (Sarazin et al. 1995; Pierre & Starck 1998), which may indicate that the ICM of A2597 and the ISM of PKS2322-12 (the central radio source A2597) are interacting within these scales.
PKS0745-191: Clumpy arms of H emission spill from the center of PKS0745-19 (Figure 5b), tracing the emission from the H2 gas (Figure 5a). The brightest molecular emission occurs in the core of the galaxy and in an adjacent knot to the southeast. The H-band continuum image (Figure 5c) is very smooth and shows only a few patches of dust absorption in the negative residual image (Figure 5d). The most significant of the dust features extends eastward from the core and lies directly opposite a linear continuum emission component which appears to be a tiny jet. The 2 cm radio contours from Baum & O’Dea (1991) (Figure 5e) shows a distortion in the same scale and position angle as the putative jet feature. Distorted and extended 6 cm radio contours, also from Baum & O’Dea (1991), (Figure 5f) surround the core of the galaxy but exhibit no clear indications of jets or lobes. The shape of the 6 cm radio source suggests that some interaction may be occuring between the system with the dust feature and the radio source.
In Figure 7, we identify clumps of gas which are present in both the ionized and the molecular residuals, and we calculate the flux ratio of the two components for each clump in Table 6.
| Clump | Area | H2 | ||
|---|---|---|---|---|
| arcsec2 | ||||
| 1 | 0.315 | |||
| 2 | 0.270 | |||
| 3 | 0.731 | |||
| 4 | 1.100 | |||
| 5 | 0.276 | |||
| 6 | 0.405 | |||
| 7 | 0.804 | |||
| 8 | 0.405 | |||
| 9 | 0.197 | |||
| 10 | 0.276 | |||
| 11 | 0.141 | |||
| 12 | 0.225 | |||
| 13 | 0.203 |
7 Dust Extinction
The optical and near-infrared images of all three galaxies show significant dust lane features. These lanes show up as patchy or filamentary absorption against a smooth elliptical distribution of light. By fitting and dividing out the elliptical backgrounds, the quantity of absorption in each waveband can be estimated. The ratio of the absorption in any two bands provides a point on the reddening law for the dust in that system. Using this method, we show that the dust in each of these systems is consistent with a Galactic reddening law.
In the central region of NGC1275, dusty patches significantly obscure the galaxy, and this obscuration is still quite strong at infrared wavelengths m or H-band. A longer WFPC2 R-band exposure from the Hubble Data Archive provided the comparison opacity of the dust features at optical wavelengths. (This exposure saturates the central nucleus, so we did not use it to subtract continuum from the LRF image.) If the underlying stellar emission is smoothly distributed across the galaxy, the ratio of extinctions and could provide one point of the reddening law of the extinction. However, the emission maps created in the previous analysis revealed thick, clumpy patches of H emission. Therefore optical line emission contaminates the continuum estimate of this filter, and the extinction relation derived using this filter might be suspect. For this reason, we also use archival WFPC2 data at B-band (F450W) for the analysis of the dust lanes in NGC1275. Our conclusions using either the B or the R data with the H-band data are similar.
We forced the isophotal fitting parameters (the shapes and the centroids) of the optical images to match that derived for the NICMOS F160W image, except for the normalizations. We then divided the B-band, R-band, and H-band images by their isophotal models to create residual images which map the dust and allow a quanititative extinction estimate in magnitudes. The residual images were binned to resolution, and the detection limit for an absorption feature was determined to be magnitudes at H-band. Assuming the relations for Galactic-type opacity (Cardelli et. al 1989) and , the H-band limit corresponds to a limit of 0.20 magnitudes at B, which we use for a lower cutoff. For reference, extinction ratios for each filter pair were calculated using the infrared and optical Galactic extinction relations with the mean filter wavelength (0.452, 0.687, and 1.593 m at B, R, and H). This gives the result: , , and .
The image in Figure 8(a) is a ratio map of the extinction magnitudes for the residual B- and H-band images, where black represents Galactic-type opacities (), grey scales where the ratio is less than Galactic, and white indicates regions with no dust in either filter. We plot the measured extinction in two ways in Figure 8(b): for each dusty pixel in the image and as a median extinction value, calculated in 0.1 mag bins. Two simple models described in Walterbos & Kennicutt (1988) have been overplotted onto the data. The first of these (Model 1, bold line) shows the expected relation for a uniform mixture of stars and dust. The second model (Model 2) assumes that the dust lane is geometrically thin and that the dust is embedded in a stellar disk, where is the fraction of light in front of the dust. Dashed lines represent varying values of (0.0-0.8), and dotted lines represent varying values of (0.2, 0.4, 0.6, 1.0, ). For infinite optical depth, the expected extinction in the two colors is equal, since only light from sources in front of the dust would be detected.
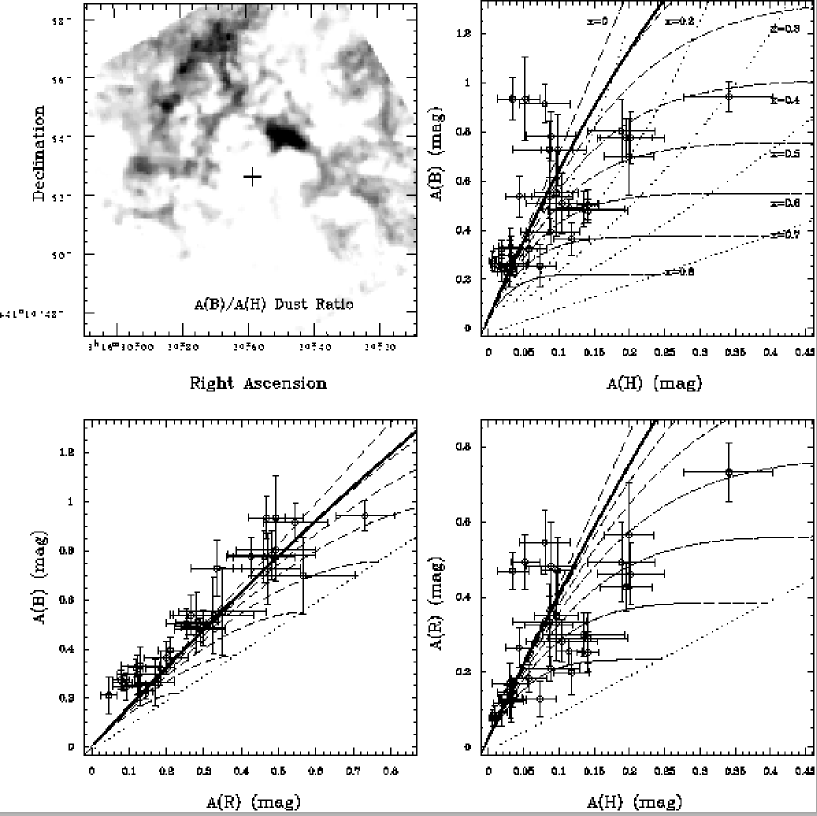
In Figure 8b, we see that Model 1 is an approximation to only some of the data. Model 2 fits some of the points in a range of and . In the image, these points correspond mainly to the large dust feature northeast of the galaxy’s center, where the 1.6 m opacity is the highest (see Figure 5d). The correspondence to Model 2 implies that the dust in the central few arcseconds of NGC1275 is well-mixed with the stars, but not in a uniform manner. Optically thick patches appear to be intermixed with regions showing Galactic-type opacities. These regions are the darkest regions in the grey scale Figure 8(a).
In Figure 8c and 8d, we plot the vs. and vs. extinctions. Contamination due to optical line emission at R-band or B-band changes the intercept of the color plots. Certainly some contamination occurs in the broad R-band filter. Assuming that contamination is , this effect moves data points in Figure 8c to the right and in Figure 8d up by 0.07 magnitudes. A straight-line fit to the vs extinction, allowing for error bars in both directions, reveals a slope of , somewhat less steep than a simple screen of Galactic dust, but consistent with some mixing between stars and dust. A formal intercept of magnitudes is found, which is consistent with our estimate of the contamination in R. Three outlying points, with apparently high extinction in the blue band but very little extinction in the R and H band, lie very near a strong dust feature just NE of the center of the image. Inside this feature lies a very red star cluster (perhaps a globular cluster) which is strongly absorbed at B, but is just visible in H.
The most significant result to be noted from the absorption comparison plots are that the slope of the extinction relation appears to be either the same as, or less steep than, that of a Galactic extinction relation, which is consistent with a heterogeneous mix of stars and Galactic dust. Therefore, we see very little evidence for an unusual dust law in NGC1275. There is a significant amount of dust, which we can see in distinct features even at 1.6 m, but the reddening is consistent with that of normal Galactic-style dust. The NGC1275/Perseus observations do not show the unusually steep slope for the absorption ratios as measured for Abell 1795 by Pinkney et al (1996).
In Abell 2597, spectroscopic determination of from the Balmer line decrement and the assumption of a standard reddening law in the central two arcseconds provided an estimate of an absorption of (Voit & Donahue 1997). Estimating the dust absorption and reddening from existing HST imaging for Abell 2597 is problematic. We have no line-free optical continuum image for Abell 2597. For the strongest absorption feature in the image, a triangular aperture wedged alongside the nucleus, magnitudes and magnitudes, giving a ratio of . This ratio, however, must be suspect. The red filter measurement is strongly contaminated by line emission from the H+[N II] complex (so much so we can use the image to estimate H fluxes). The red “absorption” of this feature may be wrong because our technique for estimating it is not robust to significant amounts of structure, which certainly exists nearby the nucleus of A2597. The observed ratio in this small region is nonetheless consistent with what is expected from optically thin Galactic-style dust, but high resolution, high quality pure optical continuum observations or deep optical spectroscopy are needed for a reliable measurement of dust.
The continuum (F439W) image of PKS0745-191 also does not permit a very accurate measure of the color sensitivity of the absorption in the single dust feature in that source. In the dust bar feature just west of the nucleus, and magnitudes, corresponding to a ratio , less than the expected Galactic ratio of 6.7, but consistent with a dust slab where 80% of the observed starlight lies in front of it.
In summary, we have unambiguously detected the absorption of dust features in all three galaxies. For NGC1275, we have extensive measurements for the prominent dust features in that system, while for A2597 and PKS0745-191, the estimates were possible for only for a single feature in each system. For all three sources, the ratios of the optical to the infared absorption are consistent with Galactic reddening. The dust absorption is consistent with that of rather thick, normal dust clouds lying behind foreground stars.
8 Origins of the Gas
In order to emit in the 1-0 S(1) or 1-0 S(3) vibrational transition line, molecular hydrogen must be vibrationally excited. If it is excited collisionally, it must be relatively warm (K). To infer anything more about this gas, we would like to know where it came from and how it is heated. In the following section we discuss the possible origins of the gas and of the gas morphologies.
8.1 The molecular gas is not part of a cooling flow
The molecular emission lines are far too bright to be from cooling gas (Jaffe et al. 1997). If molecular line emission is responsible for radiating energy from a cooling flow as the gas cools through the temperature 2000K, the fraction of cooling expected from a single H2 infrared lines is about . Estimating the mass cooling rate by
| (2) |
where is the mass of a hydrogen molecule and is the line luminosity in photons per second, we find a mass cooling rate inside the central 2” of tens of thousands of solar masses per year, two orders of magnitude larger than the total cooling flow rates over an entire cluster (Table 1). Specifically, the mass cooling rates implied for NGC1275, A2597, and PK0745-191 would be 18,000, 16,000, and 29,000 yr-1 respectively.
One possible source of the gas, however, could be the intracluster medium (ICM). It is difficult to imagine scenarios where molecule formation would occur readily in the cores of cluster cooling flows (Voit & Donahue 1995), although the possibility has been explored (Ferland, Fabian & Johnstone 1994). Molecular hydrogen formation occurs most readily when dust is present (although there are formation scenarios where dust is not required). Since dust shouldn’t last long in the hot ICM, we don’t expect molecular hydrogen to form in gas that has condensed out of the ICM. Furthermore, the large energy density in X-rays will inhibit both dust and molecule formation (Voit & Donahue 1995). Therefore, this molecular hydrogen is unlikely to be the end product nor direct evidence of a cooling flow.
8.2 Morphologies of the dust and optical and infrared emission-line gas
The emission-line morphologies in these clusters indicate that the H2 gas is closely related to the H emitting gas. The emission-line filaments of H2 align nearly exactly with the emission-line filaments of H. We are unable to tell whether the correspondence extends to lower surface brightnesses, but the highest surface brightness features seem to overlap substantially. The correspondence of the optical and infrared emission-line filament structures suggests, but does not demand, that the heating mechanisms might also be related.
The filaments themselves are concentrated in the central region in bright fuzzy blobs and extend away from the nucleus in delicate tendrils that seem to surround cavities that may have been evacuated by radio sources. Some of the filaments have knots which could be simply brighter parts of the filaments or HII regions which are photoionized by stars. The structure of the extended filament system is suggestive of shocks; however, we know from nuclear emission-line spectroscopy of A2597 (Voit & Donahue 1997) and from stellar continuum analysis of central galaxies in cluster cooling flows (Cardiel, Gorgas, & Aragon-Salamanca 1998b) that hot stars play a significant role in the optical line emission from these galaxies.
The arcsecond-scale radio sources in both Abell 2597 and PKS0745-191, and, to a limited extent, in NGC1275, appear to be interacting with the atomic and vibrationally-excited molecular gas. The radio plasma in these galaxies seems to be affecting and is affected by the atomic and molecular gas.
The dust absorption features of these three galaxies do not align with the emission-line filaments although there is some overlap. The dust features tend to be elongated in the same direction as the emission-line feature, and in some cases, the dust lanes run alongside the emission-line filaments. The conclusion of this morphological observation is that while the emission-line gas itself is known to be dusty based on significant calcium depletion – that is, no or very little [CaII] emission has been observed (Donahue & Voit 1993), there is certainly dusty gas which is not associated with the emission-line filaments, and may be quite distinct from them. This dust seems to be quite normal in NGC1275, A2597, and PKS0745-191 as we showed in §7. Sparks, Ford & Kinney (1993) and Sparks, Macchetto, & Golombek (1989) discovered normal Galactic-style dust in M87 and NGC 4696 (Centaurus) respectively. (In these systems, the emission-line gas and the dust appear to be co-spatial, at least on arcsecond scales.) If the dust properties are consistent with those of Galactic dust, it is unlikely that the dust has been processed by X-rays or is a byproduct of any process whereby the nebular or dusty gas condenses from the hot gas.
It is therefore unlikely that the dust, the ionized emission-line gas, and by association, the warm molecular gas, originated as intracluster material at X-ray emitting temperatures. Sparks et al (1989, 1993) have speculated that a merger event provided the gas, citing the coherent filamentary structure, the quantity of dust, and the angular momentum of the emission-line gas as evidence.
9 Heating the Gas
Our observations allow us to test hypotheses about how the molecular gas might be heated. Vibrationally-excited molecular hydrogen is present in both active galaxies and in starburst galaxies. Therefore, both stars and AGN can vibrationally excite molecular hydrogen. We note that the exact physical process responsible for the excitation is not clear even for starbursts and active galaxies.
The molecular emission from NGC1275 is likely to be dominated by its AGN but that of Abell 2597 and PKS0745-191 is not. Therefore our discussion in this paper will focus on testing explanations for what is heating the molecular gas in these two systems. The point-like morphology of the H2 emission of NGC1275 suggests that it is probably related to nuclear activity. Other Seyferts show nuclear infrared H2 emission on small size scales. NICMOS imaging of nearby Seyfert galaxies by Quillen et al. (1999) revealed resolved or extended 2-m hydrogen line emission from 6 out of 10 Seyferts, coincident with the H+[NII] line emission, and on much smaller physical scales than we observe in Abell 2597 and PKS0745-191 (several 100 pc rather than a few kpc, as observed in A2597 and PKS0745-191). The H2 to H line ratios observed by Quillen et al. (1999) are similar to that of NGC1275.
In contrast, the H2 to H ratios in both the nuclei and in the off-nuclear filaments in A2597 and PKS0745-191 are unusually high, even with the significant uncertainties that are incurred in correcting for [NII] emission and other systematics. Extinction of H relative to H2 may be occurring, and this certainly appears to be the case just eastward of the A2597 nucleus where there is a significant dust feature, H2 emission, and no H. But global source-wide extinction does not appear to be a significant factor in producing the high ratios. (Observations of A2597 Balmer lines suggest reddening consistent with (Voit & Donahue 1997).)
Falcke et al. (1998) finds an H2 to P ratio of 0.50 for PKS0745-191 and 2.02 for A2597. If we scale our H2 observations by these ratios, we can compare this rough estimate of the H/P ratios to that expected for Case B H/P. For K, Osterbrock (1989) predicts 8.3 (see also Brocklehurst 1971), and the ratio ranges between 7.5 - 9.7 for K. Our observed nuclear H/P ratios are for A2597 and for PKS 0745-191. The ratio in A2597 is consistent with Case B recombination with little or no extinction. We note that a far more reliable analysis of the Balmer series for a single deep longslit observation of A2597 by Voit & Donahue (1997) obtains , without the aperture uncertainties inherent in this comparison. The H/P ratio in PKS0745-191 is consistent with a differential absorption between H and P of only 50-60% at the wavelength of H, corresponding to a modest (Hill, Goodrich & Depoy 1996; Seaton, 1979). We conclude that the internal extinction of the emission line gas is not huge, for both sources.
We will thus use the following three pieces of evidence to test the physical models, supplementing with observations at UV, radio, and X-ray wavelengths as appropriate:
-
1.
The morphological similarity between the emission line gas in the optical and in the near infrared for A2597 and PKS0745.
-
2.
The unusually high intrinsic ratios of H2 emission to H emission, both globally and locally in A2597 and PKS0745.
-
3.
The relatively intense surface brightness of H2 emission as measured locally in A2597 and PKS0745.
9.1 X-ray Photoelectric Heating, Conduction, and Mixing Layers
X-rays can be quickly ruled out as a viable universal source of heat for the near-infrared filaments in at least one of the clusters, Abell 2597. X-ray photoelectric heating can excite H2 vibrational lines deep within the cloud. It is a process which can reproduce the H2 to H line ratios, given a sufficient column depth of hydrogen. X-ray irradiation and heating will also destroy H2, but warm ( K) H2 radiates so efficiently in the 1-0 S(1) line that only a small column of H2 ( out of a total hydrogen column of , a molecular fraction of only ) is required to produce the observed surface brightnesses.
We used archival ROSAT HRI images to assess the local X-ray flux in each source. The ROSAT HRI detector acquires a simple image (no spectra) of an X-ray source between keV, with a spatial resolution of . The keV X-ray luminosity as measured from HRI imaging within a circular aperture of ” and a ” box for each target is listed in Table 7. We corrected the observed X-ray luminosities to bolometric X-ray luminosities by assuming the temperatures and Galactic columns (Table 1) and 30% solar metallicities. The ratio of the bolometric X-ray flux to the H2 line flux shows a wide variation, from 7 for A2597 to 400 for PKS0745. We did not attempt to correct the bolometric X-ray flux to H2 line flux ratios for the different sizes of apertures in the two measurements. (Higher spatial resolution images from Chandra would provide a better direct comparison, of course.)
| Name | () | (4” 4” box) | Bol. Corr | |
|---|---|---|---|---|
| NGC1275 | 4.22 | 23 | ||
| A2597 | 4.12 | 8 | ||
| PKS0745 | 8.01 | 360 |
For gas that has been heated to K, the 1-0 S(1) line emits about 0.5% of the absorbed X-ray luminosity. This line is responsible for about 10% of the total H2 line flux, which is in turn responsible for about 10% of the total cooling in an X-ray heated cloud (e.g. Lepp & McCray 1983). About 50% of the absorbed X-ray energy goes into heating the gas (in contrast to photodissociation regions where the efficiency is closer to 0.1%). Typical X-ray/S(1) ratios obtained from X-ray irradiation models (Maloney, Hollenbach & Tielens 1996) are around 2000, since only about 10% of the incident flux is absorbed by clouds with cm-2 columns. The ratio can be smaller for a very steep incident spectrum.
In the case of NGC1275, the AGN may be supplying a significant fraction of the central X-ray luminosity, and therefore, with a steeper spectral component, the predicted ratio between X-ray and 1-0 S(1) flux is lower and closer to that observed. But for Abell 2597, significant X-ray heating of the H2 gas seems highly unlikely given the absence of a significant intrinsic absorption column. Its ratio of 7 within the aperture is far too low for X-ray heating to be energetically possible. PKS0745-191 is closer to the Galactic plane, and therefore its Galactic column and the uncertainty on its intrinsic column is higher. If PKS0745-191 has significant intrinsic absorption, X-ray heating of its H2 gas is remotely possible but not likely. High signal-to-noise Chandra CCD observations would have sufficient angular resolution to test whether there is significant intrinsic absorption of X-rays, using spectra from only the central few arcseconds.
Based on relative observed fluxes, while the local X-ray flux compared to the optical and molecular emission line flux is insufficient to produce the line emission by X-ray heating for Abell 2597, photoelectric heating of the molecular gas by X-rays is remotely feasible in the cluster PKS0745-191. To explore what H/H2 S(1) line ratios one might expect from X-ray heated gas, we have constructed a constant pressure model, using the methods described in Maloney, Hollenbach, & Tielens (1996), where cm-3 K, the incident spectrum is flat (in ) with a cutoff at 8 keV to mimic a thermal spectrum, and a total cloud column of cm-2. A warm (K), weakly ionized () atomic zone is produced near the surface; with increasing column density into the slab the gas undergoes a transition to a molecular phase. The ratio of H to S(1) (including H from the warm atomic zone only) is about 4; including the H contribution from the highly ionized layer at the surface of the slab raises the ratio to 8, comparable to the ratios we observe in these clusters.
We note that the H/S(1) ratio is sensitive to the slope of the continuum below a few hundred eV and the total cloud column density. If the spectrum is much softer than what we assume (that is, if the number of photons between 13.6 and 100 eV is significantly larger than the number of photons between 1 and 8 keV), the H contribution from the fully ionized layer could be much larger. Also, if the total column density of the cloud is cm-2 rather than cm-2, the molecular gas column decreases and the predicted H to S(1) ratio increases to 80.
Therefore, for X-ray heated gas, the predicted H to S(1) line ratios can be tuned to a range of values consistent with what we observe. If these clouds are X-ray heated, therefore, the incident spectrum is probably rather flat (consistent with thermal bremsstrahlung) and the clouds must be thick ( cm-2). But the mechanism is energetically unlikely based on ratios of the observed X-ray luminosities to S(1) emission line luminosities, especially for Abell 2597.
Mechanisms with physical processes similar to those which accompany X-ray heating, but with slightly different sources of energy, have been postulated as energy sources for the optical filaments. Conduction (Sparks et al. 1989) and irradiation by mixing layers (Begelman & Fabian 1990) are models which are not as easily tested by the data in hand, although the lack of coronal line emission (Donahue & Stocke 1994; Yan & Cohen 1995) stongly constrains the parameters of mixing layer models, which rely on local X-ray and UV-emitting gas to heat the filaments.
All three models, conduction, mixing layers, and direct X-ray heating, tap into the thermal energy of the ICM, but only conduction can draw from the vast thermal reservoir not local to the filaments. Determining whether conduction or irradiation by mixing layers could generate sufficient luminosity to explain the observations depends on assumptions about filament geometry, the electron density of the ICM, and, to some extent, the magnetic field strength and structure. For example, a conduction model with modest assumptions about electron densities of cm-3, K, filament surface area that is three times the projected area, and a conduction flux which is 1% the classic saturated flux, predicts there is sufficient energy in these systems to power the optical and infrared line luminosity of the filaments. The line ratios of H2 to H have not been computed for such models, but are likely to be similar to those we derive here for direct irradiation of thick columns of hydrogen by the X-ray emitting ICM. Therefore we cannot rule out conduction or mixing layers as a possible energy source for the molecular emission-line filaments.
9.2 Shocks
The filamentary morphology of the emission is suggestive of shock heating, but not proof. The observed optical line emission from the central 2” of A2597 is inconsistent with shocks being the primary source of the energy (Voit & Donahue 1997), but the molecular emission could arise from a separate process. In the next few paragraphs, we will examine the implications of our observations in the context of shock models (Hollenbach & McKee 1989).
The intrinsic surface brightnesses predicted by the shock models suggest that the preshock densities are between and cm-3, and possibly up to cm-3 for the brightest H systems. If our line of sight passes through multiple shock fronts, the observed surface brightness exceeds the true surface brightness of the working surface of any given shock, and the true preshock densities could be somewhat lower.
Fast shocks produce H/H2 line ratios that are significantly higher than observed, as fast shocks dissociate H2 and have thick ionization regions. The observed H/H2 ratios span in A2597 and in PKS0745-191 (the ratios in PKS0745-191 are a factor of two higher if H is significantly attenuated by dust). For preshock densities of cm-3, the observed ratios constrain the shock velocities to be and km s-1 respectively (Figure 9). If the H production is supplemented by stellar photoionization or any other possible source, the H/H2 ratio from a putative shock is even lower, and thus the velocities of the shocks must be lower.

If low-velocity shocks are producing the H2 emission, the amount of matter being processed by these shocks is enormous, on the order of 10,000 - 100,000 solar masses of shocked gas per year. Also, the turbulent velocities must be significantly greater than the shock velocities in order for such slow shocks to be consistent with the velocity widths of the infrared and optical emission lines ( km s-1.) However, models of radio lobes and the shocks propagating into a uniform medium suggest that in some cases, one might predict extremely slow shocks if the preshock gas is very dense, while the plume of material behind the shock may emit substantially broader optical emission lines (Koekemoer, private communication.)
9.3 UV Fluorescence and Star Formation
9.3.1 Star Formation, H, and Far Infrared Emission
If the H in the central 2” in all three galaxies is generated by star formation, we can infer a lower limit for steady star formation (a lower limit because the H could be absorbed by dust) for the three targets of 2-5 h-2 M⊙ yr-1, scaling tabulated models from Gehrz, Sramek, & Weedman (1983). We explored a standard model with initial mass function slopes of and initial stellar masses between 6-25 solar masses. (We note that these star formation rates fall 1-2 orders of magnitude short of that required to explain the fate of the mass inferred from X-ray observations to cool from the intracluster media.) Much of the radiation generated by star formation in dusty environments is re-emitted in the far infrared. The bolometric (infrared) luminosities predicted from these models, as required to generated the observed H luminosities, are , where the predicted luminosity of NGC1275 is , A2597 is , and PKS0745-191 is , consistent with and not too far below the 2 IRAS upper limits for 4’ diameter apertures centered on Abell 2597 and PKS0745 (Wise et al. 1983). NGC1275 is a FIR source (Moshir et al. 1990) with at 60 microns of . ( of a galaxy at 60 microns is within a factor of several of the total FIR luminosity of the galaxy.) FIR luminosities of A2597 and PKS0745-191 have non-restrictive upper limits of and respectively (Wise et al. 1993). The far-infrared observations of these galaxies are consistent with the conjecture that all of the H may be produced as a result of star formation. We will next test whether this assumption is consistent with the near-infrared observations.
9.3.2 UV Fluorescence, H, and H2 Emission
If the emission is powered by UV fluorescence, the vibrational excitation states are maintained indirectly by absorption of ultraviolet starlight in the Lyman and Werner band systems, followed by fluorescence (e.g. Black & van Dishoeck 1987). We can infer the intrinsic UV intensity by extrapolating from the ionizing flux required to produce the H photons to the UV flux that would be available to excite the vibrational states of H2. If the H emission arises from photoionization, one can estimate the ionizing flux (Å) required to produce it. If these same photoionizing sources also produce the Å photons, then with some assumptions about the shape of the incident spectrum, one can estimate the local intensity of Å flux, which excites the vibrational transitions of H2 gas.
For UV photoionization, 0.45 H photons emerge for every ionizing photon absorbed, and of the incident UV energy between 1130 and 912 Å emerges in a single strong H2 line (this efficiency ranges between ; BvD87). Then a typical power-law spectrum for an AGN produces an H/H2 ratio of (), assuming longward of 912 Å and shortward of 912Å, where (e.g. Shull et al. 1999). An ionizing/UV background dominated by stellar sources can be approximated by inserting a break at 912 Å. A spectrum with a break factor of , where , typical of Galactic UV sources, generates significantly lower H/H2 ratios of , closer to what we observe.
We compare the observed UV flux to that required to produce the H2 emission, or the H2 and H emission, and derive the implied extinction. IUE archival spectra show UV continua between eV for all of three targets. The UV continuum emission from these sources is very compact and essentially unresolved by IUE, and implying an extent less than 3”. In A2597 and PKS0745-191, the UV flux at a rest wavelength of about 1100 Å is Å-1, thus the luminosity per unit wavelength is Å-1. (For NGC1275, the flux of Å-1 translates to a specific luminosity of few times Å-1.)
Using the same spectral shape from Shull et al. (1999) and a break factor of , the observed fluxes implied by the H luminosities from the central aperture are Å-1. These fluxes are consistent with the IUE fluxes if (Seaton 1979).
We can also compare the H2 surface brightness to the lower limit of the UV surface brightness, as estimated from IUE observations. BvD87 define the dimensionless quantity in their models as erg s-1 cm-2 sr-1 between Å. The observed in a 3” by 3” aperture by this definition is for A2597 and PKS0745-191, including a surface brightness correction. ranges from to erg s-1 cm-2 sr-1 in A2597 (values from Table 5), twice those values in PKS0745-191 (Table 6). In fluorescent excitation models, a single bright line of H2 represents about 0.015 of the total amount of infrared line emission, so that erg s-1 cm-2 sr-1. The required to produce such a surface brightness is , with a minimum total hydrogen density of 1000-3000 cm-3 (BvD87, Figure 5). A dust screen with an of only magnitudes from Galactic dust, corresponding to a UV extinction factor of (Seaton, 1979), would be required to reconcile UV continuum observations with that required to produce the H2. The UV extinction implied is consistent with the approximate extinction derived from the Balmer line ratios from the nucleus of A2597 (Voit & Donahue 1997) and from our very rough estimates of the H/P ratios. Therefore, based on current limits on the intrinsic absorption, the observed UV flux from these objects can not rule out UV irradiation by stars on energetic grounds.
To summarize, based on the H/H2 line ratios, we can rule out a power-law source of UV photons heating the gas in A2597 and PKS0745-191 but we cannot rule out stellar UV sources. The line ratios and the energetics are consistent with the possibility that the stars are heating both the ionized gas and the vibrationally-excited molecular gas.
If UV radiation is the major heating source, the fluorescence models, normalized by the amount of stellar UV photons needed to produce the H emission lines, predict that there should be a significant number of vibrational emission lines. Such lines, like 2-1S(3) (2.07 m), 2-1S(1) (2.25 m) do not appear in the spectra of Falcke et al. (1998), but the most significant test comes from the spectral region between 1-2 microns, which should be relatively rich in H2 emission lines if UV fluorescence were important (BvD87). This line region is often obscured by atmospheric line emission, and would be easiest to observe from space (but some windows through to the ground exist for clusters at specific redshifts).
Furthermore, if UV fluorescence is the major heating source, a significant fraction of the UV will emerge as far-infrared radiation from dust. Such a scenario predicts that both Abell 2597 and PKS0745-191 should be moderately strong FIR emitters of , like NGC1275. SIRTF observations of these sources would quickly confirm or disprove this hypothesis.
A significant consequence of UV fluorescence as the most important heating source compared to thermal or shock heated gas is the larger amount of molecular hydrogen required to be present to produce the emission. The difference in mass of molecular hydrogen if the gas is excited by UV and a simple thermal model with K, which would apply in the case of shocks or X-ray heated gas, is a factor of a million. With model 14 of BvD87, which is of an cm-3 cloud with an incident UV flux of , can be produced with M⊙ of H2 , while the same amount of luminosity can be produced from only M⊙ of H2 heated to 2000 K (Model S2, BvD87). For the 1-0 S(1) luminosities from our sources, the H2 masses range from a few billion solar masses for the UV irradiation models to ten thousand solar masses for the thermal models ().
For PKS0745-191, solar masses of H2 is implied, which is very close to the published limits of H2 masses from CO observations assuming the standard CO/H2 conversions by O’Dea et al. (1994). We note the CO/H2 conversion is large and likely not accurate in these environments. NGC 1275 has a uncertain H2 mass, based on CO observations with the standard conversion, of M⊙ (Lazareff et al. 1989), very similar to the M⊙ predicted by the H2 flux and UV excitation models. This correspondence cannot be taken too seriously because of the conversion uncertainty. Abell 2597 does not have published observations of CO emission.
10 Conclusions
We have discovered extended kiloparsec-scale vibrationally-excited molecular hydrogen in the cores of galaxies thought to be in the centers of cooling flows in the clusters Abell 2597, PKS0745-191, and Perseus/NGC1275. The molecular gas was already known to be present in the nuclei, from ground-based spectroscopy, but its structure was unknown. We confirm the extended structure of molecular hydrogen seen in NGC1275 by Krabbe et al. (2000) from the ground. The vibrationally-excited molecular emission appears morphologically very similar to the ionized nebular gas in Abell 2597 and PKS0745-191. We have also discovered dust lanes which are optically thick to 1.6m emission. These dust lanes do not trace the nebular gas, but are also in the central few kpc. NGC1275 has prominent dust lanes at 1.6m. We have shown that the dust reddening in NGC1275 is consistent with that of Galactic dust. We have also, as a byproduct of our observations, obtained H-band (1.6m) photometry of NGC1275 globular clusters. We have been able to map the H/H2 ratios in different positions across A2597 and PKS0745-191.
We examine the possible sources of the vibrationally-excited molecular gas, which cannot have condensed from a cooling flow. We also investigate the source of heat for the vibrationally-excited molecular gas. The source of heat in NGC1275 is likely the central AGN – we cannot discriminate between the possible processes there. For the extended emission in A2597 and PKS0745-191, we can rule out AGN photoionization and fast shocks because the H / H2 ratios are too low. We can rule out X-ray heating for A2597 because of insufficient X-ray intensity local to the filaments. Extremely slow shocks ( km s-1) produce significantly higher H2/H ratios than do fast shocks, consistent with what we observe in A2597 and PKS0745-191, but not very efficiently. In order to produce a constant observed luminosity, tens of thousands of solar masses of gas must be processed by the shocks in each source each year. We conclude that the radio sources are not injecting significant amounts of energy by strong shocks into the interstellar and intracluster medium – at best, the emission line and molecular gas may be pushed around by the radio sources.
UV irradiation by very hot stars, implied by a star formation rate of only a few solar masses per year, is a possibility yet consistent with both the H / H2 line ratios and UV continuum observations by IUE. micron spectroscopy would definitively test this hypothesis because UV-fluorescence produces significant amounts of vibrational lines from excited molecular hydrogen. Also, if UV irradiation is the dominant mechanism, the far-infrared (m) luminosities should be not far below the IRAS upper limits inferred for A2597 and PKS0745-191, , easily detectable by SIRTF observations. Thermally-heated molecular gas very efficiently radiates molecular hydrogen lines so in the case of PKS0745-191, the ambient X-ray gas might heat a small amount of molecular hydrogen. We cannot rule out conduction and turbulent mixing layers as plausible heat sources, although energetically, direct X-ray heating and turbulent mixing layers are unlikely. We conclude that UV irradiation is the most viable heat source for both PKS0745-191 and A2597. If UV fluorescence is the dominant physical mechanism, M⊙ of vibrationally-excited H2 exist in these cluster galaxies, while if the gas is thermally excited by X-rays or conduction, only M⊙ in each galaxy are implied.
These observations provide some insight into the physical processes that may be occurring in the cores of clusters with cooling flows. Vibrationally-excited H2 and dust lanes appear to exist in the same cooling flow clusters with optical emission-line nebulae. The H2 emission is too bright to be produced directly by the cooling flow. The amount of H2 implied to be present is at least a factor of 100 too small to account for a repository of molecular gas that has accumulated over a Hubble time of constant cooling, even if the emission is powered by the UV radiation from star formation. The star formation rate inferred from the H and H2 emission and an assumption of UV-powering is also too small to account for cooling rates of M⊙ yr-1. However, these observations also show that the radio sources in these clusters do not impart a significant amount of shock energy to the emission line gas, and therefore cannot be a significant source of heating to counterbalance the cooling in the centers of cooling flows.
Appendix A Globular Clusters and Dust in NGC1275
The 1.6 micron image obtained in our program, co-added to a similar image taken for a parallel observing program, has yielded near infrared photometry for the NGC1275 star clusters first detected by Holtzmann et al. 1992. We have extracted WFPC2 photometry for the same clusters in order to enable 2-color studies with the “H”-band photometry. Our photometry procedure and results are reported here. We compare the colors obtained for these clusters with those predicted for a young stellar population with a single burst of star formation as a function of time since the burst, and we compare our results to those of optical HST photometry of the same star clusters (Carlson et al. 1998, C98 henceforth).
A.1 Globular Cluster Photometry
The large number of centrally distributed globular clusters in NGC1275 allows an estimate of individual globular cluster colors by comparing photometry with WFPC2 and NICMOS at B, R, and H. We use both our F160W data and archival data (Regan & Mulchaey 1998, Program 7330) to create a summed H-band image. The F450W and F702W archival images from Program 6228 (Carlson et al. 1998; Holtzman et al. 1996, 1992) were deep B and R images of the globular clusters in NGC1275, with exposure times of 4900 and 4500 seconds, respectively.
In Figure 10, we present the 640-second exposure 1.6 m image with the best fit elliptical model subtracted and with globular cluster candidates marked. Compact clusters which were apparent in the NICMOS image and both the F450W and F702W images were chosen for comparison. Aperture photometry was performed using DAOPHOT, with the aperture size chosen to be the radius where the source point spread function (PSF) fades into the noise. This corresponds to 4 pixels for NICMOS (0.30”) and 3 pixels for the PC on WFPC2 (0.14”). Sky values were determined by estimating the mode of background in an annulus from 4-7 pixels for WFPC2 and from 5-8 pixels in NICMOS. We correct the fluxes to apertures by generating the PSF for each filter with Tiny TIM, matching the FWHM of the convolution of the model PSF with a 2D Gaussian to the FWHM of the average globular cluster, and estimating the appropriate flux correction.
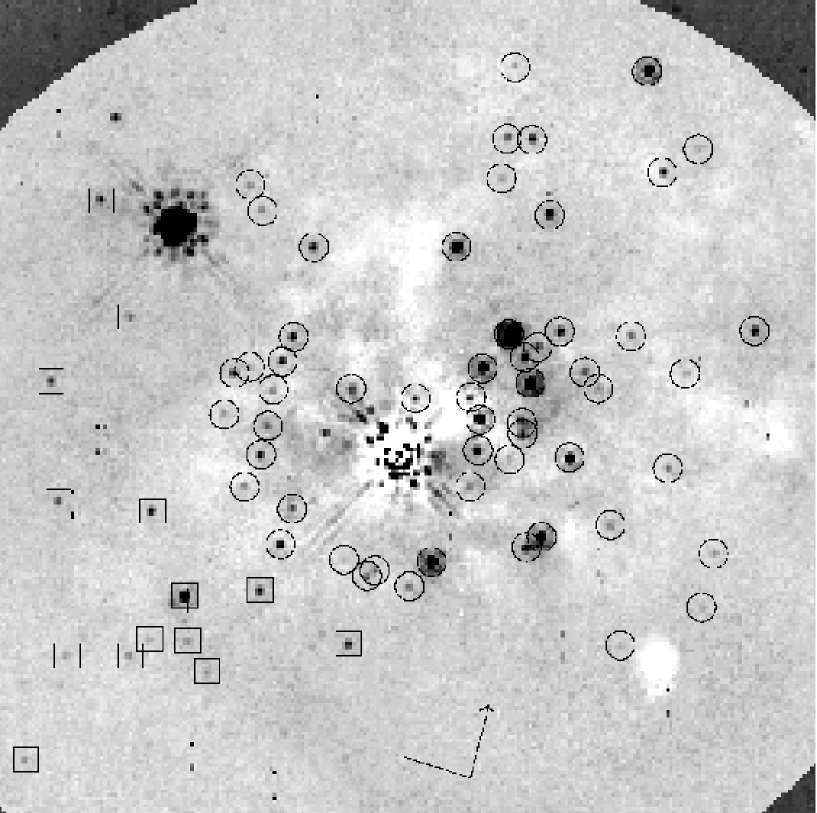
The photometric zeropoints and color transformations were derived using SYNPHOT, allowing us to calculate the total magnitude and color of each globular cluster for Johnson B- and R- photometry and for HST H-photometry. The zeropoint for the WFPC2 data (VEGAMAG) includes an aperture correction from to “infinite” aperture (0.10 mag). The NICMOS data zeropoints, on the other hand, are given for an aperture. To correct to “infinite” aperture, we multiplied the total count rate by 1.15, as recommended by the NICMOS Photometry section on the NICMOS instrument webpage. The zeropoints for each filter are listed in Table 8.
To derive the best Johnson color transformations, the spectral type of the objects must be known in advance. Brodie et al. (1998) compare the spectra of 5 globular clusters in NGC1275 with standard stellar spectra covering a range of spectral types and luminosity classes. The best match to these spectra, early type A dwarfs and class III giants, was used as the model for transforming the HST B and R filters to the Johnson system. The resulting color corrections are negligible, 0.007 and 0.001 mag for each filter respectively. The HST VEGAMAG system was used for the cluster H-band photometry. For reference, the color term required to correct the HST system to the KPNO H-system is +0.034 mag. The corrections used for our photometric calibration are summarized in Table 8.
| Magnitude System | Vega | Aperture | Color |
|---|---|---|---|
| (magnitudes) | Zeropoint | Correction | Correction |
| Johnson B | -0.17 | -0.01 | |
| Johnson R | -0.21 | -0.00 | |
| HST H | -0.08 |
C98 presented an analysis of the compact star clusters in NGC1275 using deep WFPC2 images at B- and R-bands, the same data we retrieved from the archive. They present B-R color vs B magnitude plots for all clusters in the PC and the WFs and separately for clusters in the relatively dust-free southwest portion of the PC. This analysis revealed a bimodal color distribution, with a blue population having (B-R)0=0.4 and a red population with (B-R)0=1.3. The red objects are members of an old globular cluster system, while the blue clusters are a much younger population. The inferred age of the blue star clusters was derived using Bruzual-Charlot (1993) models and the measured B-R colors, indicating a range from 107 to 109 yr.
Because the extinction is so much less at H-band than at B or R, the B-H colors could produce an age estimate less dependent on assumptions about dust. In Figure 11a, we present the photometry of all objects detected at 1.6 m by plotting color against apparent magnitude, assuming Galactic extinction to be 0.71, 0.40, and 0.10 magnitudes at B, R, and H respectively. Following the methods of C98, we tested whether the observed scatter in color was a result of internal extinction. Therefore, for this analysis, we chose clusters from the isophotal residual image which were clearly separate from the dusty regions. These clusters are indicated in Figure 10 and are plotted in Figure 11b.
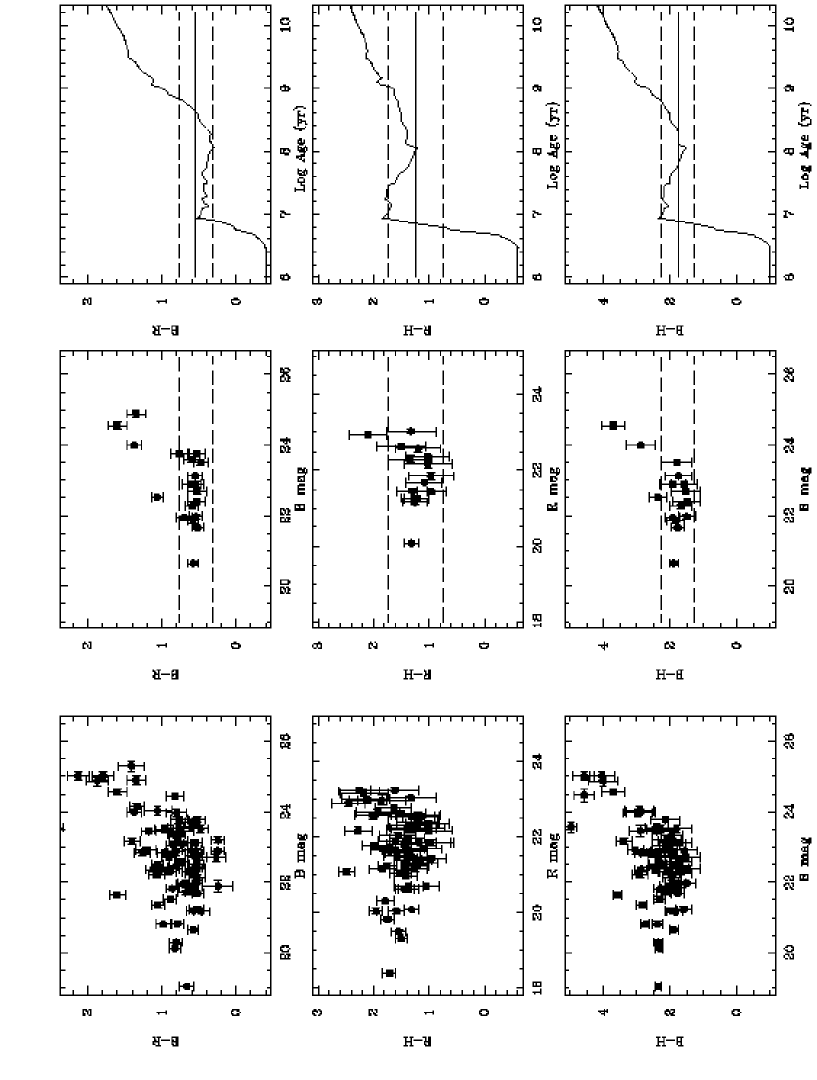
We find that the majority of our selected objects belong to the blue population described by C98, although we do detect a few of the red clusters, which are intrinsically fainter. The dominance of blue population objects is due to the shallower depth of the H-band data, thus limiting our sample to the brighter (and therefore bluer) clusters in the field. By limiting the photometry to dust-free regions of the image, the scatter in the observed (B-R) colors decreases from 0.23 mag to 0.08 mag. This scatter is consistent with the photometric errors, supporting the idea that varying amounts of dust extinction, rather than differences in age, are responsible for the dispersion in the measured colors of each population.
The blue clusters have a typical (B-R) color of 0.5 mag and (B-H) color of 1.7 mag. Figure 11, third column, shows the Bruzual-Charlot (1993) color evolution of a single-burst population, assuming a Salpeter IMF from 0.1 to 125 Mo and a total mass of 1 Mo. Dashed lines indicate the dispersion of the blue cluster photometry, allowing us to infer ages from 107 to 109 yr. The effect of eliminating internal extinction by performing the photometry in the infrared has little effect in constraining the age of these clusters, since the B-R and B-H colors are insensitive within this age range.
Therefore, we confirm the age estimates of C98 by using optical-near infrared colors of the star clusters. We have also demonstrated, by selecting a sub-sample of stellar clusters from the dust-free regions of the infrared image, that the scatter in B-R color is consistent with a scatter in the intrinsic dust absorption and not in cluster properties such as age.
References
- (1) Allen, S. W. 2000, MNRAS, 315, 269.
- (2) Baum S.A. & O’Dea C.P., 1991, MNRAS, 250, 737.
- (3) Begelman, M. C. & Fabian, A. C. 1990, MNRAS, 244, P26.
- (4) Black, J. H. & van Dishoeck, E. F. 1987, ApJ, 322, 412. (BvD87).
- (5) Biretta, J., Baggett, S., & Noll, K. 1996, Instrument Science Report, WFPC2 96-06, (ISR 96-06.)
- (6) Bruzual A., G. & Charlot, S. 1993, ApJ, 405, 538.
- (7) Burbidge, E. M. & Burbidge, G. R., 1965, ApJ, 142, 1351.
- (8) Boehringer, H., Voges, W., Fabian, A. C., Edge, A. C., Neumann, D. M. 1993, MNRAS, 264, L25.
- (9) Braine J., Wyrowski F., Radford S.J.E., Henkel C., Lesch H., 1995, A&A, 293, 315
- (10) Bridges, T. J. & Irwin, J. A., 1998, MNRAS, 300, 967.
- (11) Brocklehurst, 1971, MNRAS, 153, 471
- (12) Brodie, J. P. et al. 1998, AJ, 116, 691.
- (13)
- (14) Cardiel, N., Gorgas, J., Aragon-Salamanca. A. 1995, MNRAS, 277, 502.
- (15) —, 1998a, MNRAS, 298, 977.
- (16) —, 1998b, MNRAS, 302, 491.
- (17) Carlson, M. N., et al. 1998, AJ, 116, 691.
- (18) Crawford C.S., Fabian A.C., Johnstone R.M., Arnaud K.A., 1989, MNRAS, 236, 277.
- (19) Davies, R. I., Sugai, H. & Ward, M. J. 1998, MNRAS, 300, 388.
- (20) Donahue, M., Voit, G. M. 1993, ApJ, 414, L17.
- (21) Donahue, M., Stocke, J. T., & Gioia, I. M. 1992, ApJ, 385, 49.
- (22) Donahue, M. & Stocke, J. T. 1994, ApJ, 422, 459.
- (23) Edge, A. C. & Stewart, G. C. 1991, MNRAS, 252, 414.
- (24) Elston, R. & Maloney, P. 1992, BAAS, 181, 118.11.
- (25) Elston, R. & Maloney, P. 1994, in “Infrared Astronomy with Arrays: The Next Generation”, ed. I. S. McLean (Kulwer: Dordrecht), p. 169.
- (26) Fabian, A. C. 1994, ARAA, 32, 377.
- (27) Fabian, A. C., Arnaud, K. A., Nulsen, P. E. J., Watson, M . G., Stewart, G. C., McHardy, I., Smith, A., Cooke, B., Elvis, M., & Mushotzky, R. F. 1985, MNRAS, 216, 923.
- (28) Falcke, H., Rieke, M. J., Rieke, G. H., Simpson, C., Wilson, A. S., 1998, ApJ, 494, L155.
- (29) Ferland, G. J., Fabian, A. C., Johnstone, R. M. 1994, MNRAS, 266, 399.
- (30) Fischer, J., Smith, H. A., Geballe, T. R., Simon, M., Storey, J. W. V. 1987, ApJ, 320, 667.
- (31) Gehrz, R. D., Sramek, R. A. & Weedman, D. W. 1983, ApJ, 267, 551.
- (32) Goudfrooij, P. & Trinchieri, G., A&A, 330, 123.
- (33) Gredel, R. & Dalgarno, A. 1995, ApJ, 446, 852.
- (34) Hansen, L., Jorgensen, H. E., Norgarrd-Nielsen, H. U. 1995, A&A, 297, 13.
- (35) Heckman, T. M., Baum, S. A., Van Breugel, W. J. M., McCarthy, P. 1989, ApJ, 338, 48.
- (36) Hill, G. J., Goodrich, R. W., & Depoy, D. L. 1996, ApJ, 462, 163.
- (37) Hollenbach, D. & McKee, C. F. 1989, ApJ, 342, 306.
- (38) Holtzman, J. A. et al. 1992, AJ, 103, 6921.
- (39) Holtzman, J. A. et al. 1995, PASP, 107, 156.
- (40) Holtzman, J. A. et al. 1996, AJ, 112, 416.
- (41) Hu, E. M., et al. 1983, ApJ, 275, L27.
- (42) Hu, E. M. 1992, ApJ, 391, 608.
- (43) Hubble Space Telescope Data Handbook, Version 3.1, March, 1998.
- (44) Hunstead, R. W., Murdoch, H. S. & Shobbrook, R. R. 1978, MNRAS, 185, 149.
- (45) Inoue, M. Y., Kameno, S., Kawabe, R., Inoue, M., Hasegawa, T. Tanaka, M. 1996, AJ, 111, 1852.
- (46)
- (47) Jaffe, W. & Bremer, M. N. 1997, MNRAS, 284, L1.
- (48) Johnstone, R. M., Fabian, A. C., Nulsen, P. E. J. 1987, MNRAS, 224, 75.
- (49) Kenney, J. D. P., Rubin, V. C., Planesas, P., Young, J. S. 1995, ApJ, 438, 135.
- (50) Koekemoer, A. M., O’Dea, C. P., Sarazin, C. L., McNamara, B. R., Donahue, M., Voit, G. M., Baum, S. A., & Gallimore, J. F. 1999, ApJ, 525, 621.
- (51) Krabbe, A., Sams III, B. J., Genzel, R., Thatte, N., & Prada. F. 2000, A&A, 354, 439.
- (52) Lazareff, B., Castets, A., Kim, D.-W., Jura, M. 1989, 336, L31.
- (53) Lepp, S. & McCray, R. 1983, ApJ, 269, L560.
- (54) Maloney, P. R., Hollenbach, D. J., & Tielens, A. G. G. M. 1996, ApJ, 466, 561.
- (55)
- (56) McNarara, B. R. & O’Connell, R. W. 1992, ApJ, 393, 579.
- (57) McNamara, B. R. & O’Connell, R. W. 1993, AJ, 105, 417.
- (58) McNamara, B. R. 1997, in Galactic Cluster Cooling Flows, ASP Conference Series, 115, 109.
- (59) McNamara, B. R., & Jaffe, W. 1994, A&A, 281, 673.
- (60)
- (61) McNamara, B. R., Jannuzi, B. T., Sarazin, C. L., Elston, R., Wise, M. 1999, ApJ, 518, 167.
- (62) Mushotzky, R. F., Holt, S. S., Smith, B. W., Boldt, E. A.,& Serlemitsos, P. J. 1981, ApJ, 244, L47.
- (63) O’Dea, C. P., Baum, S. A., Maloney, P. R., Tacconi, L. J., & Sparks, W. B. 1994, ApJ, 422, 467.
- (64) O’Dea, C. P., Baum, S. A., & Gallimore, J. F. 1994, ApJ, 436, 669.
- (65) Osterbrock, D. E. 1989, Astrophysics of Gaseous Nebulae and Active Galactic Nuclei, University Science Books, Mill Valley, CA.
- (66)
- (67) Pedlar, a., Ghatuaure, H. S., Davies, R. D., Harrison, B. A., Perley, R., Crane, P. C., Unger, S. W. 1990, MNRAS, 246, 477.
- (68) Peres, C. B., Fabian, A. C., Edge, A. C., Allen, S. W., Johnstone, R. M., & White, D. A. 1998, MNRAS, 298, 416.
- (69) Pinkney, J. et al. 1996, ApJ, 468, L13.
- (70)
- (71) Pierre, M., Starck, J.-L. 1998, A&A, 330, 801.
- (72)
- (73) Quillen, A., et al. 1999, ApJ, 527, 696.
- (74) Regan, M. W. & Mulchaey, J. S. 1998, BAAS, 193, 6.05.
- (75) Sarazin C.L., Burns J.O., Roettiger K., McNamara B.R., 1995, ApJ, 447, 559.
- (76) Seaton, M. J. 1979, MNRAS, 187, 73P.
- (77) Seyfert, C. K. 1943, ApJ, 97, 28.
- (78) Shull, J. M., Roberts, D., Giroux, M. L., Penton, S. V., Fardal, M. A. 1999, AJ, 118, 1450.
- (79) Singh, K. P., Prabhu, T. P., Kembhavi, A. K., & Bhat, P. N. 1994, ApJ, 424, 638.
- (80) Sparks, W. B., Macchetto, F. & Golombek, D, 1989, ApJ, 345, 153.
- (81) Sparks, W. B., Ford, H., Kinney, A. 1993, ApJ, 413, 531.
- (82) Strauss, M. A., Huchra, J. P., Davis, M., Yahil, A., Fisher, K. B., & Tonry, J. 1992, ApJS, 83, 29.
- (83) Struble, M. F. & Rood, H. J. 1987, ApJS, 63, 543.
- (84)
- (85) Thompson, R. L., Rieke, M., Schneider, G., Hines, D. C., Corbin, M. 1998, ApJ, 492, L95.
- (86) Tielens, A. G. G. M. & Hollenbach, D. 1985, ApJ, 291, 722*.
- (87) Tiné, S., Lepp, S., Gredel, R., Dalgarno, A. 1997, ApJ, 481, 282.
- (88) Voit, G. M. & Donahue, M., 1990, ApJ, 360, L15.
- (89) Voit, G. M. & Donahue, M. 1995, ApJ, 452, 164.
- (90) Voit, G. M. & Donahue, M. 1997, ApJ, 486, 242.
- (91) Voit, G. M., Donahue, M., & Slavin, J. D. 1994, ApJS, 95, 87.
- (92) Wise, M., O’Connell, R., Bregman, J., & Roberts, M. S. 1983, ApJ, 405, 94.
- (93) Yan, L. & Cohen, J. G. 1995, ApJ, 454, 44.
- (94)