High Resolution Observations of X-Ray Absorbers/Emitters
Abstract
We present photoionization and collisional ionization models, and their application to three important fields: (a) the Warm Absorbers/Emitters in type 1 AGN, (b) the Warm Reflectors in Type 2 AGN, and (c) X–ray absorption of background quasars by intergalactic gas. A number of cases are investigated, and the dependences of the main parameters explored.
KEYWORDS: AGN, Ionized Absorber, Ionized Emitter
1. Introduction
Two, apparently distinct, main components are resolved in low resolution X-rays spectra of AGN: (a) the so called “warm absorber” (and possibly emitter), found in half of the Seyfert 1 galaxies observed by ASCA (Reynolds, 1997; George et al., 1998), and (b) the ionized reflector, seen in a number of Seyfert 2 galaxies observed by ASCA and BeppoSAX (i.e. Turner et al., 1997; Comastri et al., 1998; Guainazzi et al., 1999).
Ionized matter, potentially absorbing background quasar radiation, is also expected to be present (maybe under the form of filaments) in the intergalactic space, and its presence has relevant cosmological consequences (Hellsten, Gnedin & Miralda-Escudé, 1998). This matter is expected to produce strong resonant absorption lines in the X-ray band (i.e. “X-ray Forest”), which can be used as powerful diagnostics of the ionization state, and the temperature of this diffuse gas.
2. The Models
Our models for photoionized and collisionally ionized gas (for a detailed presentation see Nicastro, Fiore & Matt, 1999: NFM99; Nicastro, Fiore, Matt & Elvis, in preparation: NFME99), include all the strongest (oscillator strength ) absorption lines as well as permitted, intercombination and forbidden emission lines in the 50 eV to 10 keV band. The ionization structure of the gas is computed by using CLOUDY (vs. 90.04, Ferland, 1996). Resonant absorption is included as in NFM99, while the emission contribution is that predicted by CLOUDY. The lines profile (both in emission and absorption) is the correct voigt profile (NFM99). The geometrical configuration of the absorbing/emitting clouds is properly accounted for by weighting the relative (absorption versus emission) intensity with the covering factor as seen by the central source (for details see NFME99).
3. Warm Absorbers/Emitters in Type 1 AGN
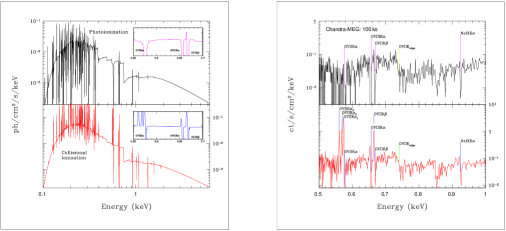
Figure 1a (left panel) shows two spectra reprocessed by: (1) photoionized outflowing and turbulent gas, with km s-1, km s-1, , log NH = 22 (in cm-2), log nH = 10 (in cm-3), log U = 0.5, and equilibrium temperature of K (upper panel); (2) gas with the same dynamical/geometrical parameters and densities, but with log U = -0.2 and K (lower panel). In the latter case the gas is not in photoionization equilibrium: the temperature is kept higher by an external source of heating (as suggested in the case of the “truly-warm” absorber of NGC 5548: Nicastro et al., 1999). The value of U in the non-equilibrium case (lower panel) has been chosen to give OVII-OVIII relative abundances similar to the pure photoionization case. We note that the emissivity of the gas is strongly enhanced in the non-equilibrium case, and the OVIIK triplet is now clearly visible. The right panel (Fig. 1b) shows 100 ks Chandra-MEG simulations of the models of Fig. 1a. The 2-10 keV source flux is of 1 mCrab erg s-1 cm-2. The Chandra-MEG, clearly resolves most of the 0.5-1 keV absorption and emission lines by highly ionized Oxygen and Neon, and allows one to measure their relative intensity and width. The OVIIK triplet is clearly resolved in the spectrum reprocessed by gas with K.
4. Warm Reflectors in type 2 AGN
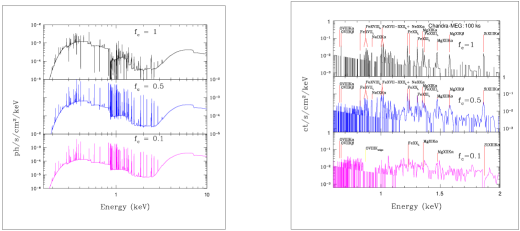
Figure 2a (left panel) shows the same photoionzation model as in the upper panel of Figure 1a, except the direct nuclear continuum is now obscured by a column of neutral gas of N cm-2 (Seyfert 2-like). Only the Warm-Reflector is visible in this case. The three cases correspond to three different values of the covering factor of the warm medium as seen by the central (obscured) source. Figure 2b (right panel) shows 100 ks Chandra-MEG simulations of the models in Fig. 2a. The 2-10 keV source flux is of 1 mCrab. The Chandra-MEG resolves most of the predicted 0.5-2 keV emission lines by O, Ne, Mg, Si and Fe highly ionized.
5. Absorption Line Diagnostics of Hot Intergalactic Plasma
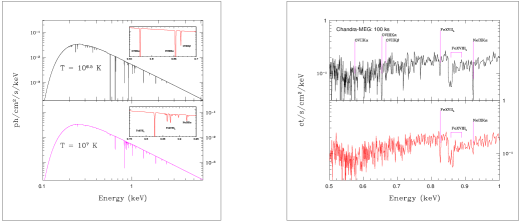
Figure 3a (left panel) shows two spectra of a bright background quasar transmitted by diffuse hot gas with log N (in cm-2), log nH = -3 (in cm-3), and two different temperatures: log T = 6.5 (upper panel), and log T = 7 (lower panel). Highly ionized oxygen produces the strongest absorption features from the K plasma, while L absorption lines by FeXVII-XVIII are imprinted on spectra transmitted by the hotter gas. Figure 3b (right panel) shows 100 ks Chandra-MEG simulations of the models of Figure 3a. The 2-10 keV flux of the background quasar is of 1 mCrab. The Chandra-MEG resolves most of the predicted 0.5-1 keV absorption lines, and clearly allows one to distinguish the two considered cases: the intensities of OVII-VIII K and NeIX K absorption lines are a very powerful diagnostics.
6. Conclusions
We have presented our photoionization and collisional ionization models, and briefly discussed three different applications to as many important astronomical fields. Simulations with the Chandra-MEG of each of these cases have been shown.
ACKNOWLEDGEMENTS
F.N. thanks H. Netzer and I.M. George for the useful discussions during the meeting. This work has been partly supported by the NASA grant NAG5-2476.
REFERENCES
Comastri A. et al., 1998, MNRAS, 259, 443.
Ferland G.J., 1996, CLOUDY, Version 90.04
George I.M. et al., 1998, ApJS, 114, 73.
Guainazzi M. et al., 1999, MNRAS in press (astro-ph/9905261).
Hellsten U., Gnedin N.Y. & Miralda-Escudé J., 1998, ApJ, 509, 56.
Nicastro F., Fiore F. & Matt G., 1999, ApJ, 517, 108.
Nicastro et al., 1999, ApJ, submitted.
Nicastro F., Fiore F., Matt G. & Elvis M., 1999, in preparation.
Reynolds C.S., 1997, MNRAS, 286, 513.
Turner T.J., George I.M., Nandra K. and Mushotzky R.F., 1997, ApJS, 113, 23.