High Resolution X-Ray Spectra of Capella: Initial Results from the Chandra High Energy Transmission Grating Spectrometer
Abstract
High resolution spectra of the active binary Capella (G8 III + G1 III) covering the energy range 0.4-8.0 keV (1.5-30Å) show a large number of emission lines, demonstrating the performance of the HETGS. A preliminary application of plasma diagnostics provides information on coronal temperatures and densities. Lines arising from different elements in a range of ionization states indicate that Capella has plasma with a broad range of temperatures, from , generally consistent with recent results from observations with the Extreme Ultraviolet Explorer (EUVE) and the Advanced Satellite for Cosmology and Astrophysics (ASCA). The electron density is determined from He-like O vii lines, giving the value at ; He-like lines formed at higher temperatures give only upper limits to the electron density. The density and emission measure from O vii lines together indicate that the coronal loops are significantly smaller than the stellar radius.
1 Introduction
The active binary Capella ( Aurigae, HD 34029, HR 1708) was observed with the High Energy Transmission Grating Spectrometer (HETGS) on the Chandra X-Ray Observatory (CXO). We present a first analysis of the spectra with the goals of demonstrating the HETGS performance, and of applying plasma diagnostics to infer physical parameters of the Capella corona. A complementary analysis of the corona of Capella based on high resolution spectra obtained using the CXO Low Energy Transmission Grating Spectrometer (LETGS) has been presented by Brinkman, et al. (2000). Further analysis of diagnostic emission lines from these and other Chandra grating data of Capella are underway with the goal of obtaining refined temperature-dependent emission measures, abundances, and densities, leading to a self-consistent determination of the coronal structure.
The Chandra HETGS:
The High Energy Transmission Grating assembly (Markert et al., 1994; Canizares, et al., 2000) consists of an array of periodic gold microstructures that can be interposed in the converging X-ray beam just behind the Chandra High Resolution Mirror Assembly. When in place, the gratings disperse the X-rays according to wavelength, creating spectra that are recorded at the focal plane by the linear array of CCDs designated ACIS-S. There are two different grating types, designated MEG and HEG, optimized for medium and high energies (partially overlapping in spectral coverage). The HETGS provides spectral resolving power of -1000 for point sources (corresponding to a line FWHM of about 0.02 Å for MEG, and 0.01 Å for HEG) and effective areas of 1-180 over the wavelength range 1.2-30 Å (0.4-10 keV). Multiple overlapping orders are separated using the moderate energy resolution of the ACIS detector. The HETGS complements the LETGS, which is optimized for lower energy X-rays. (For detailed descriptions of the instruments see http://chandra.harvard.edu).
Preliminary analysis of in-flight calibration data including those presented here indicates that the HETGS is performing as predicted prior to the Chandra launch. The spectral resolution is as expected and effective areas are within 10% of the expected values except from 6–12Å where there are systematic uncertainties of up to 20%. Ongoing calibration efforts will reduce these uncertainties.
The Coronal Structure of Capella:
Capella is an active binary system comprised of G1 and G8 giants in a 104 d orbit at a distance of 12.9 pc. The G1 star rotates with an d period (Hummel et al., 1994). Capella has been studied by many previous X-ray telescopes, including Einstein (Holt et al., 1979; Swank et al., 1981; Mewe et al., 1982; Vedder and Canizares, 1983; Schmitt, et al., 1990), EXOSAT (Lemen et al., 1989); ROSAT (Dempsey et al., 1993), Beppo-SAX (Favata et al., 1997), and ASCA (Brickhouse et al., 2000). The fundamental parameters of Capella, some activity indicators, and primary references may be found in Strassmeier, et al. (1993).
The corona of Capella appears intermediate in temperature, being cooler than those of RS CVn stars such as HR 1099 or II Peg, but significantly hotter than a less active star like Procyon. X-ray observations obtained at low to moderate spectral resolution are generally consistent with emission from an optically thin, collisionally dominated plasma with two temperature components (Swank et al., 1981; Schmitt, et al., 1990). Spectra obtained by the Extreme Ultraviolet Explorer (EUVE) have provided more discriminating temperature diagnostics, showing plasma over a continuous range of temperatures, with the peak emission measure near (Dupree et al., 1993; Schrijver et al., 1995; Brickhouse et al., 2000). Simultaneous measurements using EUVE and ASCA spectra did not require emission from plasma hotter than (Brickhouse et al., 2000). EUVE observations show variability by factors of 3 to 4 in lines formed above (Brickhouse et al., 2000; Dupree et al., 2000).
Dupree et al. (1993) have estimated plasma electron densities in the range from to from lines of Fe xxi formed near , implying that the scale of the emitting volume is , although Griffiths and Jordan (1998) question the reliability of this diagnostic. Brickhouse et al. (2000) use EUV lines of Fe xviii to constrain the optical depth in the strong X-ray emission line, Fe xvii 15.014, to .
From high-resolution UV spectra from the Hubble Space Telescope, Linsky et al. (1998) concluded that both stars have comparable coronal emission, based on measurements of the Fe xvii (1354Å) coronal forbidden line, and that the plasma is magnetically confined. Thus the “corona” of Capella is actually a composite of two “coronae.”
2 Observations and Data Processing
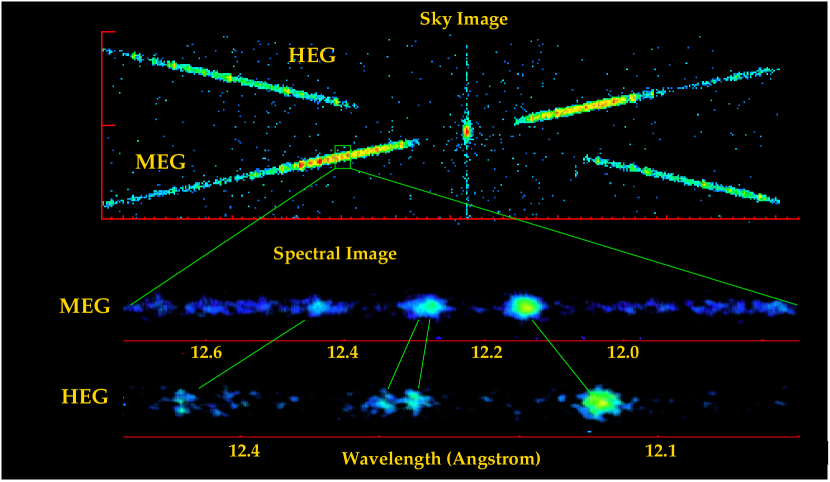
We combined data from three HETGS observations (from 1999 August 28, September 24 & 25) for a total exposure of 89 ks. Data were processed with the standard Chandra X-Ray Center software (versions from July 29 (R4CU3UPD2) and December 13 (CIAO 1.1)). The image of the dispersed spectrum is shown in Figure 1. Each photon is assigned a dispersion angle, , relative to the undiffracted zero-order image. The angle is related to the order, , and wavelength, , through the grating mean period, , by the grating equation, . The spectral order is determined using the ACIS-S CCD pulse height for each photon event (with wide latitude to avoid sensitivity to variations in CCD gain or pulse height resolution). The positive and negative first orders were summed separately for HEG and MEG for all observations and divided by the effective areas to provide flux-calibrated spectra (Figure 2). listed in Table 1. the Fe xvii line strength is, within the uncertainties, identical to that observed in 1979 with the Einstein crystal spectrometer by Vedder and Canizares (1983), while the O viii line is roughly half the previous value.
3 Coronal Diagnostics
Emission Measure Distribution:
Some properties of the coronal temperature structure can be deduced from a preliminary analysis of the spectrum. The data warrant a full analysis of the volume emission measure distribution with temperature, , ( in which is the electron density of plasma at temperature which occupies the volume, ), which will be the subject of a future paper.
As Table 1 illustrates, the spectrum contains lines from different elements in a range of ionization states, demonstrating that the emitting plasma has a broad range of temperature. Further evidence of multi-temperature emission comes from two line ratios. First, ratios of H-like to He-like resonance lines, O viii/vii, Mg xii/xi, and Si xiv/xiii indicate ionization ratios corresponding to = 6.55-6.60, 6.75-6.85, and 6.95-7.00, respectively. Second, the He-like ions provide temperature-sensitive ratios involving the resonance (), forbidden () and intersystem () lines (Gabriel and Jordan, 1969; Gabriel, 1972; Pradhan & Shull, 1981; Smith et al., 1998). For the observed O vii, Mg xi, and Si xiii lines, the ratio corresponds to temperatures , , and , respectively, using the theoretical models of Smith et al. (1998, in the low density limit). In both cases, the ratios indicate that the corona has a broad range of temperature.
An approximate upper envelope to the true distribution is given by the family of curves formed by plotting the ratio of line strength to corresponding emissivity for a collection of lines. For a given element, its abundance affects only the overall normalization of the envelope of all lines from that element. For this initial analysis, we assumed Solar abundances (Anders and Grevesse, 1989), which is consistent with previous analyses except possibly for Ne (Brickhouse et al., 2000).
The VEM envelope of Figure 3, indicatates that plasma must be present over nearly a decade in temperature. The absence of lines from He-like and H-like ions of Fe provides an upper limit to the above . Although the envelope does not trace closely the peaked distribution derived from EUV lines, such a distribution is not excluded,
Density Diagnostics:
The He-like ratio is primarily sensitive to density Using the theoretical line ratios of Smith et al. (1998), our measured O vii ratio of implies an electron density within the range –. Similarly, the Mg xi and Si xiii ratios of and give upper limits near and , respectively. We note that our ratio for O vii is somewhat lower than that obtained by Brinkman, et al. (2000) from LETGS spectra. The HETGS and LETGS observations were not simultaneous; however, based on evidence from prior EUVE observations (Dupree et al., 2000), we would be surprised if this difference represented actual changes in the mean coronal plasma density. Instead, we suggest that this results from different treatements of the continuum plus background, which particularly affects the strength of the intercombination line.
4 Discussion
These X-ray data confirm that Capella’s corona contains plasma at multiple temperatures in the accessible range from to , and set stringent constraints on the amount of plasma hotter than at the time of this observation. These properties are generally consistent with the results found with EUVE and ASCA (Brickhouse et al., 2000) and the line strengths are close those seen 20 years earlier by Vedder and Canizares (1983).
The preliminary results presented here have implications for the structure of Capella’s corona: they suggest that the characteristic dimensions of the coronal loops at are small compared to the stellar radius, . For simple semi-circular loops of constant circular cross-section of radius , we use the measured density and for oxygen to estimate loop heights , where is the ratio of to loop length in units of 0.1, and is the number of loops. Detailed loop modeling of (van den Oord et al., 1997) also required compact structures, though variable cross-section loops were needed to increase the proportion of hot to cool plasma.
References
- Anders and Grevesse (1989) Anders, E., & Grevesse, N., 1989, Geochimica et Cosmochimica Acta 53, 197.
- Brickhouse (1996) Brickhouse, N. S. 1996, in Proc. IAU Colloq. 152, Astrophysics in the Extreme Ultraviolet, ed. S. Bowyer & R. F. Malina, (Dordrecht: Kluwer), 105.
- Brickhouse et al. (2000) Brickhouse, N. S., Dupree, A. K., Edgar, R. J., Liedahl, D. A., Drake, S. A., White, N. E., & Singh, K. P. 2000, ApJ, 387.
- Brinkman, et al. (2000) Brinkman, A.C., et al., 2000, ApJ, (submitted)
- Brown, et al. (1998) Brown, G.V., Beiersdorfer, P., Liedahl, D.A., et al., 1998, ApJ, 502, 1015.
- Canizares, et al. (2000) Canizares, C.R. et al. 2000 in preparation
- Dempsey et al. (1993) Dempsey, R.C., Linsky, J.L., Schmitt, J.H.M.M., and Fleming,T.A.,1993, ApJ,413,333
- Dupree et al. (1993) Dupree, A.K., Brickhouse, N.S., Doschek, G.A., Green, J.C., and Raymond, J.C., 1993, ApJ, 418, L41
- Dupree et al. (2000) Dupree, A.K., Brickhouse, N.S., and Sanz-Forcada, J., 2000, in preparation.
- Favata et al. (1997) Favata, F., Mewe, R., Brickhouse, N. S., Pallavicini, R., Micela, G., & Dupree, A. K. 1997, A&A, 324, L37
- Gabriel (1972) Gabriel, A. H. 1972, MNRAS, 160, 99
- Gabriel and Jordan (1969) Gabriel, A. H., & Jordan, C. 1969, MNRAS, 145, 241
- Griffiths and Jordan (1998) Griffiths, N.W., Jordan, C., 1998 ApJ, 497, 883
- Holt et al. (1979) Holt, S. S., White, N. E., Becker, R. H., Boldt, E. A., Mushotzky, R. F., Serlemitsos, P. J., & Smith, B. W. 1979, ApJ, 234, L65
- Hummel et al. (1994) Hummel, C. A., Armstrong, J. T., Quirrenbach, A., Buscher, D. F., Mozurkewich, D., & Elias II, N. M. 1994, AJ, 107, 1859
- Lemen et al. (1989) Lemen, J. R., Mewe, R., Schrijver, C. J, & Fludra, A. 1989, ApJ, 341, 474
- Linsky et al. (1998) Linsky, J.L., Wood, B.E., Brown, A., & Osten, R.A., 1998, ApJ, 492, 767
- Markert et al. (1994) Markert, T.H., Canizares, C.R., Dewey, D., McGuirk, M., Pak, C.S., & Schattenburg, M.L., 1994, Proc. SPIE, 2280, 168
- Mewe et al. (1982) Mewe, R. et al. 1982, ApJ, 260, 233
- Pradhan & Shull (1981) Pradhan, A. K. and Shull, J.M 1981, ApJ, 249, 821
- Saba et al. (1999) Saba, J.L.R., Schmelz, J.T., Bhatia, A.K., and Strong, K.T., ApJ, 510, 1064.
- Schmitt, et al. (1990) Schmitt, J.H.M.M., Collura, A., Sciortino, S., Vaiana, G.S., Harnden, F.R., Jr., and Rosner, R., 1990, ApJ, 365, 307.
- Schrijver et al. (1995) Schrijver, C.J., Mewe, R., van den Oord, G.H.J., and Kaastra, J.S. 1995, A&A, 302, 438.
- Smith et al. (1998) Smith, R. K., Brickhouse, N. S., Raymond, J. C., & Liedahl, D. A. 1998, in Proceedings of the First XMM Workshop on “Science with XMM”, ed. M. Dahlem (Noordwijk, The Netherlands)
- Strassmeier, et al. (1993) Strassmeier, K.G., Hall, D.S., Fekel, F.C., and Scheck, M., 1993, A&AS, 100, 173
- Swank et al. (1981) Swank et al., 1981, ApJ, 246, 214
- van den Oord et al. (1997) van den Oord, G.H.J., Schrijver, C.J., Camphens, M., Mewe, R., & Kaastra, J.S., A&A, 326, 1090
- Vedder and Canizares (1983) Vedder, P.W., Canizares, C.R., 1983, ApJ, 270, 666
| Line | aaTheoretical wavelengths of identification, in Å. | FluxbbObserved flux is the tabulated Flux in . The systematic uncertainty is less than 10% except in the range from 6–12Å where it is up to 20%. | cc is the integrated line counts in 89 ks. | dd is the temperature (in K) of maximum emissivity. |
|---|---|---|---|---|
| Fe xxv | 1.85 | 7.8 | ||
| S xv | 5.040 | 33 | 110 | 7.2 |
| S xv | 5.060 | 16 | 55 | 7.2 |
| S xv | 5.100 | 26 | 85 | 7.2 |
| Si xiii | 5.680 | 25 | 93 | 7.0 |
| Si xiv | 6.180 | 48 | 472 | 7.2 |
| Si xiii | 6.650 | 182 | 1228 | 7.0 |
| Si xiii | 6.690 | 47 | 374 | 7.0 |
| Si xiii | 6.740 | 121 | 834 | 7.0 |
| Al xii | 7.750 | 16 | 204 | 6.9 |
| Mg xii | 8.419 | 152 | 1947 | 7.0 |
| Mg xi | 9.170 | 348 | 2818 | 6.8 |
| Mg xi | 9.230 | 63 | 618 | 6.8 |
| Mg xi | 9.310 | 190 | 1425 | 6.8 |
| Ne x | 10.240 | 92 | 740 | 6.8 |
| Ni xxii | 10.791 | 62 | 426 | 7.0 |
| Ne xeeBlend; entry for sum of two components | 12.132 | 929 | 4171 | 6.8 |
| Fe xviieeBlend; entry for sum of two components | 12.134 | 6.8 | ||
| Fe xixeeBlend; entry for sum of two components | 13.515 | 530 | 1587 | 6.9 |
| Fe xixeeBlend; entry for sum of two components | 13.524 | 6.9 | ||
| Fe xvii | 15.013 | 3043 | 7476 | 6.7 |
| Fe xvii | 15.272 | 1119 | 2919 | 6.7 |
| Fe xviii | 15.641 | 410 | 938 | 6.8 |
| O viii | 16.003 | 898 | 1885 | 6.5 |
| Fe xvii | 16.796 | 2004 | 3669 | 6.7 |
| Fe xvii | 17.071 | 2641 | 4554 | 6.7 |
| Fe xvii | 17.119 | 2443 | 4191 | 6.7 |
| O viii | 18.967 | 2634 | 2810 | 6.5 |
| O vii | 21.600 | 967 | 396 | 6.3 |
| O vii | 21.800 | 255 | 102 | 6.3 |
| O vii | 22.100 | 736 | 249 | 6.3 |
| N vii | 24.779 | 549 | 327 | 6.3 |