Spectroscopic Gravitational Lens Candidates in the CNOC2 Field Galaxy Redshift Survey
Abstract
We present five candidate gravitational lenses discovered spectroscopically in the Canadian Network for Observational Cosmology Field Galaxy Redshift Survey (CNOC2), along with one found in followup observations. Each has a secure redshift based on several features, plus a discrepant emission line which does not match any known or plausible feature and is visible in multiple direct spectral images. We identify these lines as Ly 1216 or [O ii] 3727 emission from galaxies lensed by, or projected onto, the CNOC2 target galaxies. Einstein radii estimated from the candidate deflector galaxy luminosities indicate that for two candidates the lines are probably [O ii] from projected galaxies (consistent with the detection of H as well as [O ii] in one of them), but that in the remaining four cases the lines could be Ly from lensed galaxies. We estimate that only [O ii]-emitting galaxies are expected to project onto target galaxies in the original CNOC2 sample, consistent with three or four of the six candidates being true gravitational lenses.
1 Introduction
Gravitational lensing of one galaxy by a foreground galaxy can provide unique insight into the mass distribution of the deflector galaxy and the morphology of the source galaxy when the lensed emission extends over a range of radii (Kochanek 1995; Kochanek et al. 2000a). Radially extended emission occurs in the form of full or partial Einstein rings which are formed when the background galaxy is of order 1 arcsec in size, comparable in size to the inner (diamond) caustic of a typical deflector galaxy. Miralda-Escude & Lehar (1992) pointed out that a large population of optical Einstein rings should exist if the background density of faint galaxies is high enough. The first such (partial) optical Einstein ring was discovered in a spectroscopic survey of 0.4 early-type galaxies (Warren et al. 1996, 1999), and another has since been discovered in the same survey (Hewett et al. 1999). The main advantage of spectroscopic galaxy-galaxy lens searches is that the source and deflector redshifts, and thus the basic lensing geometry, are determined upon discovery (though further observations are needed to obtain the exact lens morphology and possibly additional confirmation of the objects’ lensing natures). In contrast, galaxy-galaxy lens candidates selected from direct imaging can suffer from confusion with morphologically complex galaxies even when high resolution images are available (Ratnatunga et al. 1999), and while radio-selected lenses have high-resolution discovery images, they often suffer from faint optical counterparts which make redshifts difficult to obtain (Tonry & Kochanek 2000).
In this paper we present a sample of candidate gravitational lenses identified spectroscopically during the Canadian Network for Observational Cosmology Field Galaxy Redshift Survey (CNOC2) and a subsequent followup project. Each consists of a putative deflector galaxy (the CNOC2 target galaxy) whose flux dominates the spectrum and yields a secure redshift, plus a discrepant emission line from a putative source galaxy lensed by, or projected onto, the target galaxy. Existing broadband imaging shows no firm morphological evidence for lensed emission, but high-resolution narrowband imaging should reveal that the real gravitational lenses among these candidates are full or partial Einstein rings. We assume =100 km s-1 Mpc-1 (=1), =0.2 and =0.
2 Data
The CNOC2 dataset is discussed in Yee et al. (2000) and only relevant details are summarized here. imaging and spectroscopy were obtained using the Multi-Object Spectrograph (MOS) on the Canada-France-Hawaii Telescope (CFHT). The survey covers a total area of 5434 arcmin2 divided among four patches on the sky, each of which is a mosaic of 17 to 19 contiguous MOS fields of size 9′8′. Spectroscopy was obtained for two slit-masks per field (denoted A and B), with two exposures per mask (each typically 20 minutes long for the A masks and 40 minutes for the B masks), east-west slits of width 13 and minimum length 105, and typically 100 objects per mask. The final rebinned 1-D spectra cover 4390 to 6292 Å at 4.89 Å/pixel and resolution 14.8 Å. They are thus capable of detecting Ly at and [O ii] at . In addition, followup red spectroscopy was obtained in 1999 August to measure the Balmer decrements of a subset of CNOC2 galaxies with known redshifts (Morris et al. 2000). These spectra cover 5000 to 9000 Å at 5 Å/pixel and resolution 17 Å. Redshifts were determined by cross-correlation with a set of three templates: one absorption-line (spectral class Scl=2; E galaxy), one emission+absorption (Scl=4; Sbc galaxy), and one emission-dominated (Scl=5; Scd galaxy). The choice of template to use, and thus the spectral class and redshift assigned to the galaxy, was made after a visual review which usually involved examining the direct and spectroscopic images and the final 1-D spectra. The CNOC2 catalog used in this paper (2000 April version) contains 6130 spectroscopically identified galaxies.
3 Selection of Spectroscopic Lens Candidates
During the visual redshift assignment review for five CNOC2 targets and one followup target, we noted the presence of a strong unidentified emission line discrepant from the adopted redshift. The redshifts for these targets were determined from multiple spectral features and have , where is the SNR of the redshift correlation peak (Yee et al. 1996). Figure 1 shows the observed spectra of the candidate lenses (in all our discussions we present the candidates in decreasing order of deflector galaxy redshift). Each candidate’s ID number is its CNOC2 catalog number (Yee et al. 2000), consisting of a four-digit patch code plus a six-digit field+object code after a decimal point. All of the discrepant lines are significant detections and are present in both exposures of each mask in which they were observed. The possible causes of spurious lines (including zeroth order emission, cosmic rays, spatially and spectrally adjacent slit overlaps, and flatfield residuals) are ruled out in each case by visual inspection of the two-dimensional (2-D) spectroscopic images. When the spectra are examined in the rest frame of the target galaxy, none of the discrepant lines match the wavelength of any emission line seen in the 719 local galaxies studied by Sandage (1978), nor the wavelength of any feature which mimics an emission line as empirically observed in the CNOC2 absorption-line galaxy spectra. Also, in the five of these six objects with more than one observed emission line, the wavelength ratios of the lines do not match any known or reasonable pair of UV or optical lines at any (but see §4.3.2 below). Thus, these objects are best described as candidate gravitational lens systems, having one set of spectral features plus a discrepant emission line which is almost certainly either [O ii] or Ly (see discussion in Warren et al. 1996). Table 1 and Table 2 give the spectroscopic and photometric parameters, respectively, for these candidate lenses.
Figure 2 shows the observed spectra of the candidate lenses in the putative deflector galaxy rest frame. Five of the six lens candidates have emission lines at the deflector galaxy redshift in addition to the discrepant emission line. For targets such as these where the redshift was determined from an emission line template, it is relatively easy to spot even weak discrepant emission lines during the visual redshift assignment review. However, it is possible that discrepant but weak emission lines were ignored during this step if the redshift was assigned from an absorption line template. Thus the final 1-D spectra for all 2350 galaxies with redshifts assigned from the absorption line template or the emission+absorption line template were re-examined by eye for discrepant emission lines. No additional candidates were found with confirmed lines as strong as in the original five CNOC2 candidates. Therefore we are confident that in the CNOC2 database there are no other candidate spectroscopic lenses with discrepant lines as strong as these five ( ergs cm-2 s-1 or equivalent width Å) and with observed wavelengths visible in CNOC2.
It is worthwhile to note that we found only one strong candidate among objects with purely absorption line spectra, despite the fact that such objects are typically bulge-dominated galaxies which are more efficient lenses than disk-dominated galaxies. We feel this is probably not a significant result for several reasons. First, our sample is only six objects. Second, morphologically most of them appear to be bulge-dominated (§4.3). Third, the distribution of spectral classes of our candidate deflector galaxies reflects not only lensing efficiency but also the fraction of each spectral class in the primary CNOC2 spectroscopic sample (25% absorption line objects, 20% emission+absorption and 55% emission line). Fourth, Schade et al. (1999) find [O ii] emission in one-third of a sample of 1 galaxies classified as bulge-dominated using images.
Assuming the discrepant line is Ly, none of the candidates exhibit a significant Lyman break or significant emission from Ly/O vi 1034, N v 1240, O i 1302, C ii 1335 or Si iv/O iv] 1400. This is not surprising, since some of these emission lines are only strong in AGN and since star-forming galaxies can have extremely strong Ly relative to their continua (Stern et al. 2000).
4 Discussion
The five candidate lenses from the original CNOC2 survey form a unique sample from a survey with well-understood selection effects (the sixth lens was identified from an ongoing and thus statistically incomplete survey, and is excluded from the following discussion). The selection biases for these lens candidates are: the deflector galaxy must give a secure redshift; the source galaxy must be at for Ly or for [O ii]; and the source galaxy must have an emission line strong enough to be visible.111The bias toward deflector galaxies with secure redshifts means that a system with a source at and a deflector at could have been misidentified as an [O ii] emission-line galaxy in the CNOC2 database. We now attempt to account for these biases and estimate the number of projected [O ii]-emitting galaxies (foreground or background to the CNOC2 target galaxies) which could contaminate the lens sample from the original CNOC2 survey. We defer a discussion of the expected number of lenses in the survey to §4.4.
4.1 Estimated Number of Projected [O ii]-emitting Galaxies
Since we cannot yet definitively identify the discrepant lines observed in these objects as arising from lensed galaxies, we now consider the possibility that they are [O ii] from galaxies seen in projection along the line of sight. We adopt 1313 (4.694 10-4 arcmin2) as the area within which a galaxy would have to be projected to produce a discrepant line in our spectra, since we use 13 wide slits and the typical seeing is better than 10. The spectral profiles along the slits and the imaging data on individual objects discussed in §4.3 rule out larger projected separations. The expected number of chance projections in the CNOC2 sample which might explain these objects is then just this area times the surface density of galaxies which have properties consistent with the putative [O ii] emitters. The imaging data discussed in §4.3 rules out projected galaxies with magnitudes comparable to the target galaxies. We adopt bright magnitude limits for potential projected galaxies 25 fainter than the target galaxy (i.e. ten times lower flux). A conservative faint magnitude limit can be estimated by assuming the discrepant line flux comes from an object whose [O ii] rest-frame equivalent width (REW) is 100 Å, the maximum value observed even in starburst galaxies (but see Stern et al. 2000). The galaxy surface density in these magnitude ranges (typically ) is 10.22 arcmin-2 on average. Since is required for [O ii] 3727 to be seen in CNOC2, we multiply by a correction factor , the fraction of galaxies predicted to have . These predictions are taken from the model of Gladders & Yee (2000a), which uses extrapolated CNOC2 luminosity functions (Lin et al. 1999) to simultaneously fit numerous observational constraints. On average, . We also need to multiply by an additional correction factor , the fraction of galaxies in these magnitude and redshift ranges with [O ii] emission strong enough to match the observations. This fraction depends on magnitude since fainter galaxies must have higher [O ii] REW to explain the observed line flux. Even at our assumed bright magnitude limit, the required [O ii] REW is 25 Å. Approximately 35% of galaxies with have [O ii] REW25 Å in the sample of Hogg et al. (1998), but only 2% have REW100 Å. We assume averaged over our magnitude ranges.
We use all these numbers to estimate the total number of galaxies which could explain the observed discrepant emission lines. We obtain total chance projections using the formula with CNOC2 galaxies with redshifts, arcmin2/galaxy, candidate projected galaxies/arcmin2, and . Using Poisson statistics with this mean, we estimate that there is only a 3% chance that all five candidates from the original CNOC2 survey are projections.
A firm upper limit to the number of projected [O ii]-emitting galaxies can also be made from the CNOC2 data itself. We calculate independently by measuring, in the appropriate magnitude range , the surface density of all galaxies times the fraction of CNOC2 targets with redshifts from emission or emission+absorption line templates. This method yields an estimate of total chance projections, higher than above but within the uncertainties. This is expected to be an overestimate because it does not account for the fact that some of these galaxies have weak [O ii] which would not be detected at a significant level if the galaxy was projected atop a brighter galaxy.
4.2 Estimated Einstein Radii
The cross-section for lensing scales as (Blandford & Narayan 1992). Thus the estimated Einstein radii of our candidate deflector galaxies can be used as a consistency check on the probability of detecting such lenses. For a singular isothermal sphere, the Einstein radius , where is the central dark matter velocity dispersion in units of 225 km s-1 and and are the angular diameter distances to the source from the observer and the deflector (lens) galaxy, respectively (Kochanek et al. 2000b). Kochanek (1994) found that for a sample of local early-type galaxies, , where is the luminosity corresponding to . We use these two equations to calculate for our candidate lenses for each possible discrepant line identification for each object. However, to ensure that our galaxies’ values are directly comparable to those of the Kochanek (1994) galaxies, we need to make two corrections to the values in Table 2 before using them in these equations. The Kochanek (1994) galaxies are local ellipticals with insignificant levels of blue light from star formation, but our galaxies have considerable blue light, as seen in their spectra and indicated by their spectral and SED classes. The lensing cross-section will be overestimated directly in proportion to the fraction of excess blue light. To account for this bias, we recomputed by normalizing to the observed band flux and assuming an SED class of 0.38, equal to the earliest type observed among the candidates. We then correct for the passive evolution observed in the population of galaxies with early-type SEDs in CNOC2. This is parametrized as (Lin et al. 1999), with from an analysis of the full CNOC2 sample using evolving GISSEL models to define the galaxy SED types (Lin et al. 2000). The now represent our best estimates of the magnitudes the “old population” light in these galaxies would have at , and we use them to calculate (Ly) and ([O ii]). The results are given in Table 2 and discussed in the next section.
4.3 Notes on Individual Candidates: Projections or Lenses?
Since the cross-section for lensing scales as , lenses with small are much rarer than lenses with large . Our survey is sensitive to lenses of any (unlike imaging surveys for morphologically selected lenses), but we are still sensitive to this cross-section bias against the existence of small- lenses. Given this bias, our estimated values are about as large as expected for galaxies which are acting as gravitational lenses, except for 2148.150598 and 0223.110191. These objects have inferred masses too low to have a high probability of lensing. This finding of one or two probable superpositions from lensing probability considerations agrees well with the estimate of total chance projections (in the original CNOC2 survey) of objects which could explain the discrepant emission lines (§4.1). This agreement suggests that the other candidate lenses are probably real gravitational lenses. Further confirmation is clearly necessary, but in the meantime in this section we outline the probable natures of the individual candidates.
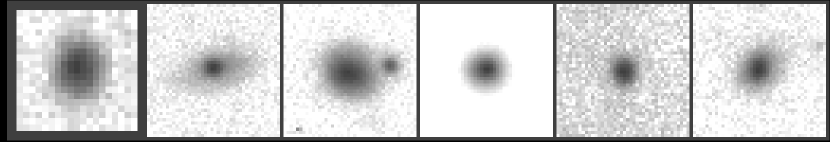
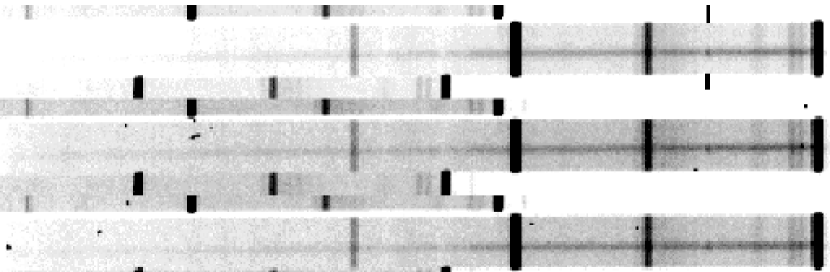
We also discuss the spectra and morphology of each candidate lens. The seeing in the relevant direct and spectroscopic images is between 08 and 11. However, the MOS imaging has a coarse pixel scale and significant defocusing across the chip, resulting in image quality and resolution that is not particularly good in general. Where possible, we instead discuss the morphology of our lens candidates on higher quality V, R, and z′ images obtained using the CFH12k mosaic CCD camera on CFHT as part of the Red-Sequence Cluster Survey (Gladders & Yee 2000b; Gladders et al. 2000). These images are at least a magnitude deeper than the CNOC2 imaging, have better seeing (0608 FWHM), and are better sampled (02/pixel). We also make use of data obtained at the WHT (Hoekstra et al. 2000) which is deeper than the MOS data but of comparable seeing and sampling. Figure 3 shows images of the the six lensing galaxies (all from CFH12k except for the image of 0920.180194). Figure 4 shows an example of our two-dimensional spectra.
4.3.1 0920.180194 (CNOC2 J092123.3+363613)
Morphology and Spectrum:
This candidate lens appears slightly asymmetric in the direct MOS images. The deflector galaxy redshift is secure from [O ii] emission plus CN and Ca H+K absorption. In the spectral image, the discrepant emission line is less spatially extended than the [O ii] line, but about as extended as the continuum emission. Spectra for this object were taken through only one mask. The apparent broad line in the blue is a flatfield artifact.
Discrepant Line Identification:
The discrepant line is either lensed Ly or projected [O ii], but probably the former (see the first paragraph of section §4.3). Lensed [O ii] can be ruled out because if the discrepant line is in fact [O ii] 3727, its redshift is lower than that of the CNOC2 target galaxy whose spectral features dominate the observed spectrum. Projected Ly can be ruled out in this and all other cases of potential Ly emission except 2148.150598, since discrepant line emission is seen at a projected spatial separation of less than from the center of the putative deflector galaxy continuum. For Ly emission to be seen at this observed position, it must be lensed (Blandford & Narayan 1992).
4.3.2 0223.191225 (CNOC2 J022336.4000602)
Morphology and Spectrum:
[O ii] emission plus Ca H and H absorption provide a secure deflector galaxy redshift for this target. The discrepant emission line is present in spectra obtained with two different masks on two different nights. Note that the wavelengths of the two emission lines visible in the spectrum (Figure 1) match the expected ratio for [N i] 5199 and [He ii] 4686 at , but this AGN identification is extremely unlikely since no [O iii] or H is seen when they should be at least 10 times stronger (Osterbrock 1989), and since it does not explain the observed Ca H and H absorption. As with 0920.180194, if the discrepant emission line is in fact [O ii] 3727 its redshift is lower than that of the CNOC2 target galaxy whose spectral features dominate the observed spectrum, and thus this system would have to be a superposition rather than a lens. The CFH12k Rz′ images of this field (§4.3) show that this is a disk galaxy with a prominent bulge. The galaxy is asymmetric in the image: the disk emission is stronger to the W of the bulge than the E and the bulge appears offset to the N of the disk, probably due to an inclination effect. Since the discrepant line lies blueward of the band, this asymmetry cannot be identified as arising from it alone (and vice versa).
Discrepant Line Identification:
The discrepant line is either lensed Ly or projected [O ii] but probably the former (see the first paragraph of this section). As with 0920.180194, lensed [O ii] can be ruled out because if the discrepant line is [O ii] it is from a galaxy with a lower redshift than the CNOC2 target galaxy.
4.3.3 1447.111371 (CNOC2 J144958.6+085447)
Morphology and Spectrum:
This candidate lens has a close neighbor galaxy of unknown redshift located 22 to the W and 09 to the N. The deflector galaxy redshift is secure from [O ii] emission plus CN, H8, and Ca H+K absorption. The discrepant emission line is present in spectra obtained with four different masks on two different nights. There appears to be a variation in the strength of the line relative to the [O ii] emission line and the continuum in one of the observations, but a ratio of that spectrum to the others shows that the variation is within the expected noise level. If the discrepant line is [O ii], the velocity separation from the CNOC2 target galaxy would be 4000 km s-1. On the CFH12k VRz′ images of this field (§4.3), the candidate appears elongated E-W in the nuclear regions, somewhat different from the NE-SW major axis of the outer regions. This is confirmed by the WHT images (§4.3). The elongation may be intrinsic (e.g. a bar) or from a very close (1″) projected neighbor.
Discrepant Line Identification:
If the discrepant line is [O ii], it is almost certainly not from a lensed galaxy since in that case. Thus the line is either lensed Ly or projected [O ii].
4.3.4 2148.130358 (CNOC2 J215031.8053504)
Morphology and Spectrum:
On the CFH12k VRz′ images of this field (§4.3), this candidate lens is circularly symmetric with no signs of any morphological peculiarity. The deflector galaxy redshift is secure from Ca H+K and G-band absorption. The discrepant emission line is present in spectra obtained with two different masks on two different nights. Its strength relative to the continuum is the same in both.
Discrepant Line Identification:
The estimated for this system is large enough that the discrepant line must be from a lensed galaxy regardless of whether it is Ly or [O ii].
4.3.5 0223.110191 (CNOC2 J022552.1000018)
Morphology and Spectrum:
This candidate lens was identified in the CNOC2 red spectroscopy followup. The discrepant line has the highest flux and equivalent width in our sample. The deflector galaxy redshift was originally obtained only from [O ii] but is confirmed by H, [O iii], and H in the followup spectroscopy. The discrepant line is confirmed to be [O ii] at by the detection of H at the same redshift (visible in Figure 2, redward of H from the CNOC2 target galaxy). On the CFH12k Rz′ images of this field (§4.3), the object is compact but nonetheless more extended in the NNE-SSW direction than other nearby compact objects and probable point sources. The object is too compact to draw any further conclusions.
Discrepant Line Identification:
Since lensing probability goes as , the small value of means that the discrepant line is probably from a projected galaxy rather than a lensed galaxy. It is also worth noting that the high REW of the discrepant [O ii] line suggests that the system contributes half of the observed luminosity even if its [O ii] REW is 100 Å, the maximum typically seen (§4.1).
4.3.6 2148.150598 (CNOC2 J215057.9055139)
Morphology and Spectrum:
On the CFH12k VRz′ images of this field (§4.3), this faint galaxy is slightly asymmetrically extended to the SE at essentially all isophotes. This is confirmed by the WHT images (§4.3). From visual inspection of the available images, however, it does subjectively appear to be a single galaxy rather than a close projection. The deflector galaxy redshift is less secure than the others, being based on strong [O iii] 5007 plus weak [O iii] 4959 and H emission, but the value of the cross-correlation is above the cutoff for CNOC2 emission line galaxies. Also, the two strong lines do not match any pair of known emission lines. The discrepant emission line is present in spectra obtained with two different masks (but on the same night). The relative strengths of the two observed emission lines agree very well between the two observations. The apparent line at 4444 Å (observed) is spurious.
Discrepant Line Identification:
Given the small estimated for this object, the discrepant line here is very probably either Ly from a projected galaxy or [O ii] from a projected galaxy. The first possibility is unlikely: the projected galaxy is estimated to have , at which the surface density of Lyman-break galaxies is only 14 deg-2, of which only 50% have Ly in emission (Steidel et al. 1999a). The line flux of 5.4 10-17 ergs cm-2 s-1 would also be rather high for an unlensed galaxy. Steidel et al. (1999b) do find 3 galaxies of comparable Ly flux in a 78 arcmin2 narrowband survey, but the redshift targeted was one at which the observed field was known to be overdense in Lyman-break galaxies by a factor 6. Thus we conclude that the discrepant emission line in 2148.150598 is most likely projected [O ii] at . The slightly asymmetric morphology of this source lends a posteriori support to this conclusion, although a priori we did not believe it indicated a projected galaxy.
4.4 Projections or Lenses?
Estimating a robust expected number of lenses in the CNOC2 survey requires a complicated calculation that would produce only an uncertain estimate. This is because the magnification of a lens (and thus the surface density of the faint galaxy population which could be responsible for our candidate lenses) depends very sensitively on the impact parameter between the source and deflector galaxies. Our observed lensing frequency from the original CNOC2 survey is 1 good lens candidate per 15002000 galaxies to . This is a lower limit due to limited line detectability and redshift coverage. The correction for limited line detectability will be at least a factor of two, since only 50% of galaxies show Ly in emission (Steidel et al. 1999b). We ignore lensed galaxies since higher- lenses dominate the lensing cross-section (cf. the values of ([O ii]) and (Ly) in Table 2). The correction for limited redshift coverage is complicated since the source magnitude and the lensing cross-section are correlated with the source redshift, but it is also likely to be at least a factor of two for the following reason. CNOC2 is sensitive to source galaxies only over a redshift range of (), again ignoring the less common lenses. There is an adjacent redshift range of similar at lower redshifts where CNOC2 should have detected a similar number of lenses if it had had the appropriate spectral coverage, since our observed candidate deflector galaxies have roughly the same Einstein radii for source galaxies at such redshifts. In other words, the lensing probabilities for source galaxies at those lower redshifts — whose line emission would be detectable in data of CNOC2 quality, unlike emission from objects at redshifts higher than those to which CNOC2 is sensitive, which is likely to be too faint to be detected — are roughly the same as for the redshifts observable in CNOC2. Our resulting estimated lens frequency of 1 in 400500 is consistent with the approximately 1 in 600 frequency of radio rings in the MGV survey (Miralda-Escude & Lehar 1992).
5 Conclusion
In the course of the CNOC2 field galaxy redshift survey and subsequent followup, we have identified six spectroscopically-selected gravitational lens candidates. Each exhibits a firm redshift from multiple spectral features, plus a discrepant emission line. Ly or [O ii] 3727 are the only reasonable identifications for the discrepant lines. Based on the estimated Einstein radii of the putative deflector galaxies, four of the discrepant lines are more likely to be lensed Ly than lensed [O ii], and the remaining two are unlikely to be lensed Ly or lensed [O ii] and are therefore probably [O ii] from projected galaxies. In one case the [O ii] identification is confirmed by the detection of H. We estimate that there should be only chance projections of objects which could explain the observed discrepant emission lines in the original CNOC2 sample. Thus there is only a 3% chance that all five of the original CNOC2 survey candidates are projections, and it is likely that three or four of our six candidates are real gravitational lenses.
Galaxy-galaxy lenses can be used to constrain the mass distributions of the deflector galaxies. While our sample is small, only two such systems have previously been reported (Warren et al. 1996; Hewett et al. 1999). Unlike Warren et al. (1996), we do not preselect for red, early-type deflector galaxies and thus the two samples may probe the masses of different galaxy types. In addition, more galaxy-galaxy lenses are needed to search for rare but valuable cases where two or more galaxies at different redshifts are lensed by the same object. Such systems may be able to simultaneously constrain and since all lensed sources must share the same relation between angular size distance and redshift (Link & Pierce 1998).
Further observations of these systems are therefore warranted. High spatial resolution narrow-band imaging can provide the surface brightness distributions of the lensed emission, needed to constrain the deflector galaxy mass distributions. Forthcoming integral field spectroscopy should confirm the discrepant lines, determine the emission line region morphologies, estimate the velocity dispersion of the deflector galaxies, reveal if the discrepant emission lines have the redward-asymmetric profile common to Ly at high redshift, and possibly detect other emission or absorption lines from the source galaxies such as H/[O iii] at low redshift or C iv at high redshift. For high- source galaxies, near-IR spectroscopy can study the rest-frame optical emission lines to constrain masses from the observed linewidths, to compare star formation rate estimates from Ly, [O ii] and H, and to compare line ratios with star-forming galaxies at lower redshifts.
References
- Blandford & Narayan (1992) Blandford, R. D. & Narayan, R. 1992, ARA&A, 30, 311
- Bruzual A. & Charlot (1996) Bruzual A., G. & Charlot, S. 1996, preprint
- Coleman et al. (1980) Coleman, G. D., Wu, C.-C., & Weedman, D. W. 1980, ApJS, 43, 393
- Gladders & Yee (2000a) Gladders, M. D. & Yee, H. K. C. 2000a, in preparation
- Gladders & Yee (2000b) —. 2000b, to appear in “Cosmic Evolution and Galaxy Formation: Structure, Interactions and Feedback” (astro-ph/0002340)
- Gladders et al. (2000) Gladders, M. D., Yee, H. K. C., & Hall, P. B. 2000, in preparation
- Hewett et al. (1999) Hewett, P. C., Warren, S. J., Willis, J. P., Bland-Hawthorn, J., & Lewis, G. F. 1999, in to appear in “Imaging the Universe in Three Dimensions”, ed. W. van Breugel and J. Bland-Hawthorn (astro-ph/9905316)
- Hoekstra et al. (2000) Hoekstra et al., H. 2000, in preparation
- Hogg et al. (1998) Hogg, D. W., Cohen, J. G., Blandford, R., & Pahre, M. A. 1998, ApJ, 504, 622
- Kochanek (1994) Kochanek, C. S. 1994, ApJ, 436, 56
- Kochanek (1995) —. 1995, ApJ, 445, 559
- Kochanek et al. (2000a) Kochanek, C. S., Falco, E. E., Impey, C. D., Lehar, J., McLeod, B. A., Rix, H. W., Keeton, C. R., Munoz, J. A., & Peng, C. Y. 2000a, ApJ, 535, 692
- Kochanek et al. (2000b) —. 2000b, ApJ, in press (astro-ph/9909018)
- Lin et al. (1999) Lin, H., Yee, H. K. C., Carlberg, R. G., Morris, S. L., Sawicki, M., Patton, D. R., Wirth, G. D., & Shepherd, C. W. 1999, ApJ, 518, 533
- Lin et al. (2000) —. 2000, in preparation
- Link & Pierce (1998) Link, R. & Pierce, M. J. 1998, ApJ, 502, 63
- Miralda-Escude & Lehar (1992) Miralda-Escude, J. & Lehar, J. 1992, MNRAS, 259, 31P
- Morris et al. (2000) Morris, S. L., Lin, H., Carlberg, R. G., Sawicki, M., & Hall, P. 2000, in preparation
- Osterbrock (1989) Osterbrock, D. E. 1989, Astrophysics of Gaseous Nebulae and Active Galactic Nuclei (Mill Valley: University Science Books), 357
- Ratnatunga et al. (1999) Ratnatunga, K. U., Griffiths, R. E., & Ostrander, E. J. 1999, AJ, 117, 2010
- Sandage (1978) Sandage, A. 1978, AJ, 83, 904
- Schade et al. (1999) Schade, D., Lilly, S., Crampton, D., Ellis, R., Le Fevre, O., Hammer, F., Brinchmann, J., Abraham, R., Colless, M., Glazebrook, K., Tresse, L., & Broadhurst, T. 1999, ApJ, 525, 31
- Steidel et al. (1999a) Steidel, C. C., Adelberger, K. L., Giavalisco, M., Dickinson, M., & Pettini, M. 1999a, ApJ, 519, 1
- Steidel et al. (1999b) Steidel, C. C., Adelberger, K. L., Shapley, A. E., Pettini, M., Dickinson, M., & Giavalisco, M. 1999b, ApJ, 532, 170
- Stern et al. (2000) Stern, D., Bunker, A. J., Spinrad, H., & Dey, A. 2000, ApJ, in press (astro-ph/0002239)
- Tonry & Kochanek (2000) Tonry, J. L. & Kochanek, C. S. 2000, AJ, 119, 1078
- Warren et al. (1996) Warren, S. J., Hewett, P. C., Lewis, G. F., Møller, P., Iovino, A., & Shaver, P. A. 1996, MNRAS, 278, 139
- Warren et al. (1999) Warren, S. J., Lewis, G. F., Hewett, P. C., Møller, P., Shaver, P., & Iovino, A. 1999, A&A, 343, L35
- Yee et al. (1996) Yee, H. K. C., Ellingson, E., & Carlberg, R. G. 1996, ApJS, 102, 269
- Yee et al. (2000) Yee, H. K. C., Morris, S. L., Lin, H., Carlberg, R. G., Hall, P. B., Sawicki, M., Patton, D. R., Wirth, G. D., Ellingson, E., & Shepherd, C. W. 2000, ApJS, 131, in press (astro-ph/0004026)
| Discrepant | Discrepant | IAU | ||||||||||
|---|---|---|---|---|---|---|---|---|---|---|---|---|
| Peak | Line | Line Rest | Line | EW | Nomenclature | |||||||
| ID | Scl | (if Ly) | (if O ii) | Observed | at | Flux | (Å) | Object Name | ||||
| 0920.180194 | 0.56502 | 25 | 4.67 | 4 | 3.26302 | 0.39051 | 25 | 5183 | 3313 | 0.600.05 | 18.5 | J092123.3363613 |
| 0223.191225 | 0.51142 | 18 | 5.06 | 5aaClassified as Scl=4 in one of two independent spectra. | 3.17764 | 0.36266 | 30 | 5077 | 3558 | 1.200.12 | 20.1 | J022336.4000602 |
| 1447.111371 | 0.39545 | 18 | 5.21 | 5bbClassified as Scl=4 in one of four independent spectra. | 3.33820 | 0.41503 | 42 | 5274 | 3778 | 1.300.08 | 14.5 | J144958.6085447 |
| 2148.130358 | 0.37396 | 19 | 6.08 | 2 | 3.96494 | 0.61946 | 12 | 6037 | 4395 | 2.470.05 | 10.5 | J215031.8053504 |
| 0223.110191 | 0.30311 | 20 | 11.26 | 5 | 0.80581 | 12 | 6731 | 5163 | 4.490.15 | 55.8 | J022552.1000018 | |
| 2148.150598 | 0.10589 | 17 | 3.26 | 5 | 3.96509 | 0.61951 | 12 | 6038 | 5457 | 0.540.06 | 9.0 | J215057.9055139 |
Note. — Each candidate’s ID number is its CNOC2 catalog number, consisting of a four-digit patch code plus a six-digit field+object code after a decimal point. All redshifts are measured from cross-correlation on the average of all available individual spectra. Redshift uncertainties for and (whether Ly or [O ii]) are given in units of 0.00001 in . values are explained in §3. Spectral classes (Scl) are 2 for absorption lines, 4 for emission+absorption, and 5 for emission-dominated. In cases of multiple spectra, spectral classes are taken from the spectrum with the highest . Wavelengths of the discrepant lines are given in Å. Line fluxes are in cgs units of 10-16 ergs cm-2 s-1. Equivalent widths (EW) are measured in the observed frame relative to the putative deflector galaxy continuum emission. The IAU nomenclature object names provide RA and DEC in the J2000 system, and should be preceded by the acronym CNOC2, e.g. CNOC2 J092123.3363613.
| ID | U | err | B | err | V | err | R | err | I | err | SED | (Ly) | ([O ii]) | |
|---|---|---|---|---|---|---|---|---|---|---|---|---|---|---|
| 0920.180194 | 21.46 | 0.09 | 21.64 | 0.05 | 20.82 | 0.04 | 19.89 | 0.04 | 19.16 | 0.04 | 1.71 | 21.11 | 102 | |
| 0223.191225 | 22.61 | 0.17 | 22.46 | 0.09 | 21.30 | 0.04 | 20.22 | 0.04 | 19.44 | 0.04 | 0.91 | 20.51 | 087 | |
| 1447.111371 | 21.48 | 0.11 | 21.52 | 0.05 | 20.66 | 0.04 | 19.94 | 0.04 | 19.33 | 0.04 | 2.01 | 20.04 | 076 | 004 |
| 2148.130358 | 21.74 | 0.11 | 21.69 | 0.04 | 20.25 | 0.04 | 19.15 | 0.03 | 18.40 | 0.04 | 0.38 | 20.51 | 113 | 052 |
| 0223.110191 | 22.09 | 0.14 | 22.42 | 0.07 | 21.70 | 0.05 | 21.02 | 0.07 | 20.32 | 0.07 | 2.08 | 18.30 | 029 | |
| 2148.150598 | 21.69 | 0.12 | 22.10 | 0.05 | 21.52 | 0.07 | 21.36 | 0.05 | 20.72 | 0.10 | 3.31 | 15.77 | 015 | 013 |
Note. — Each candidate’s ID number is its CNOC2 catalog number, consisting of a four-digit patch code plus a six-digit field+object code after a decimal point. SED classes are derived by fitting spectral templates to the UBVRI photometry (Yee et al. 2000). All values between 0.5 and 4.5 are allowed, with 0, 1, 2, 3 being Coleman et al. (1980) E/S0, Sbc, Scd, and Im templates respectively, and 4 being a very blue vigorously star-forming GISSEL template (Bruzual A. & Charlot 1996). values are calculated using these SED classes, normalizing to all the available photometry instead of only one band (Lin et al. 1999). (Ly) is the estimated Einstein radius if the putative lensed emission line is Ly, and ([O ii]) is the estimated Einstein radius if the putative lensed emission line is [O ii] 3727 (see §4.2). No ([O ii]) is calculated for 0920.180194 or 0223.191225 because the discrepant line lies blueward of the deflector galaxy [O ii] line, so if the discrepant line is [O ii] in those cases it must arise from a foreground galaxy. No (Ly) is calculated for 0223.110191 because its discrepant line is confirmed to be [O ii] by the detection of H at the same redshift.