Correlation Function of Galaxy Groups
Abstract
We use the Updated Zwicky Catalog of galaxies (Falco et al. 1999) to generate a catalog of groups, by means of a friend-of-friend algorithm. The groups identified have 4 or more members and a surrounding density contrast, . They cover the region , spanning over the radial velocity range of 2000 km s-1 15000 km s-1. The total sample (hereafter GUZC) comprises 517 groups. The correlation length of the total sample is well fitted with a power law with parameters and for values of , declining to homogeneity at larger scales.
Three subsamples defined by the range of group virial masses were used to have their clustering properties examined throughout the autocorrelation function. We find an increase of the amplitude of the correlation function according to the group masses which extends the results of the relation for galaxy systems at small . We obtain (), (), and () for mass ranges , and respectively.
For completeness we have also analyzed a sample of groups obtained from the Southern Sky Redshift Survey (da Costa et al.1998) in the range of virial masses to compare the results with those obtained from GUZC. The correlation function of this sample can be fitted with a power law with parameters and .
keywords:
cosmology: large-scale structure of universe — galaxies: clustering — galaxies: statistics1. Introduction
The two point correlation function, , has been widely used to analyze the clustering properties of galaxies and galaxy systems (Peebles (1993) and references therein). Clusters and groups of galaxies can be used as suitable tracers of the large scale structure of the universe. In fact, several works have characterized the clustering properties of rich clusters of galaxies (see for instance Croft et al. (1997) and Abadi et al. (1998)) concluding that the cluster autocorrelation function has a similar shape than the galaxy correlation function with a larger amplitude. The clustering properties of groups of galaxies were analyzed by Jing & Zhang (1988) for the CfA groups (Geller & Huchra (1983)), by Maia & da Costa (1990) for the SSRS group catalog (Maia et al. (1989)), and by Ramella et al. (1990) for groups of the CfA slices (Huchra et al. (1990)) where a significant lower amplitude of is detected for these systems when compared to rich clusters, as expected in hierarchical scenarios of structure formation in the universe. However, the typical values found for the correlation length, , for the groups examined by these authors are significantly different, perhaps due to the small size, and the different selection criteria of the samples examined. In a more detailed work Trasarti-Battistoni et al. (1997) examine how the different criteria of assignment of galaxies into groups affect the determination of . They claim that the differences found in previous works may be due to the distinct values of the density contrast adopted to generate the catalogs of groups, which resulted in groups with distinct physical properties.
Groups have lower richness and higher space density than the APM, Abell or X-ray selected clusters, allowing a detailed analysis of the behavior of the at such regimes of space density. It worths to be mentioned that the relation between and the mean intergroup separation, , for values of lesser than has not been extensively explored. Moreover, the predictions of current hierarchical models differ from the universal scaling law proposed by Bahcall and West (1992) at large scales (Abadi et al. (1998) and Croft et al. (1997)), as well as at the smaller scales where this work is focused.
In this paper we analyze two new samples of groups of galaxies, the first one, taken from the Updated Zwicky Catalog (UZC) by Falco et al. (1999) which contains redshift information for galaxies of the Catalog of Galaxies and Clusters of Galaxies (Zwicky et al. (1961-68)). The other group catalog, is derived from Southern Sky Redshift Survey (SSRS2) by da Costa et al. (1998). Both samples resulted, mainly, from the effort of the ON and CfA redshift surveys in the past 20 years, but since UZC and SSRS2 come from distinct galaxy catalogs, we treat both as independent samples, thus avoiding the mixture of each one biases, also allowing us, a cross-check of results.
Section 2 describes how the groups were defined and which are their general properties. In section 3 we analyze the clustering properties of these groups using the autocorrelation function. A brief summary of our conclusions is presented in section 4.
2. Groups in the Updated Zwicky Catalog - GUZC and Southern Sky Redshift Survey - GSSRS2
The recent release of the UZC of galaxies (Falco et al. (1999)), containing 19,369 objects with and with 96% of completeness in redshift, and the SSRS2 (da Costa et al. (1998)), containing 5369 galaxies with which covers a region of 1.70 sr of the southern celestial hemisphere. The large area of sky covered, the relative fainter magnitude limit, and the very good completeness in redshift of both catalogs, make them a powerful resource to perform statistical analysis of the galaxy properties in the nearby Universe. We used the UZC and SSRS2 to generate new catalogs of groups of galaxies to investigate their clustering properties by means of the correlation function. The algorithm adopted for the construction of the catalog of groups of galaxies is basically the one described by Huchra & Geller (1982). Since we are interested in ”real physical systems”, the adopted friends-of-friends algorithm (described below), searches for possible group member galaxies, keeping a fixed surrounding density contrast () relative to the mean density of galaxies in the catalog. A was adopted because it was demonstrated by Ramella et al. (1997) to be the best compromise in identifying as many physical loose groups as possible and including all systems with high velocity dispersion, but avoiding contamination of the catalog by pseudo-groups as well as groups with interlopers (see also discussion by Nolthenius and White (1987) and Maia & da Costa (1990)).
A search for companions around galaxies is carried out taking into account projected separations satisfying
and with line-of-sight velocity differences,
In the above expressions , and are the radial velocities of the galaxies, and their angular separation. The quantities and are search parameters scaled according to the expressions below in order to take into account the variation in the sampling of the galaxy luminosity function, , with distance
where
is the selection parameter at a fixed fiducial radial velocity, . is scaled in the same way as .
To generate the UZC groups (GUZC), the adopted values for and were and 350 km s-1 respectively; the apparent magnitude limit, , and km s-1 Mpc-1. The groups present a surrounding , for a Schechter (1976) luminosity function adopted for the total sample, parameterized by galaxies mag-1 Mpc-3, and (Ramella et al. (1997)).
The SSRS2 groups (GSSRS2) are obtained with the same , but for values for and and 350 km s-1 respectively. The apparent magnitude, , while the luminosity function is parameterized by galaxies mag-1 Mpc-3, and (Marzke et al. (1998)).
We have also computed the virial masses of the groups combining the virial radius and the velocity dispersion which provide suitable estimates of group masses (Ramella et al. (1997)). According to the same authors, several groups with 3 or 4 members may be unreliable, although we should expect a low degree of contamination by pseudo-groups (as small as 10%) by adopting .
The resulting group catalogs contain systems with at least 4 members and mean radial velocities, 15,000 km s-1 (GUZC), and 12,000 km s-1 (GSSRS2) consisting in the largest sample of groups of galaxies homogeneously selected to the present. For analysis purposes, we removed groups in regions of galactic latitude and declination for GUZC and for the GSSRS2 we only considered groups within the following limits: and (southern galactic cap) and and (northern galactic cap). This choice provides a sample free of strong obscuration from the Galaxy and also avoids possible lack of homogeneity in the Falco catalog due to the not complete coverage of the Zwicky catalog in part of those regions. For both them, very rich groups containing more than 40 galaxies were also removed, to avoid the presence of rich clusters in our analysis. In addition to the above criteria, those groups with 2,000 km s-1 were also discarded from the analysis, to prevent any significant contribution of the group peculiar velocities in the measured redshifts which were used to determine their distances.
The projected distribution of the GUZC (panel a) and GSSRS2 (panel b) groups in equatorial coordinates is shown in figure 1. Histograms of the distributions of and group mass () for the systems of the GUZC (panel a) and GSSRS2 (panel b) are presented in figures 2 and 3 respectively. The velocity distribution of groups is similar to the one for galaxies, and a more detailed examination of the estimated masses for groups between 2000 km s-1 and 5000 km s-1 confirms the reliability of this determination, in the sense that groups with lower masses are made up of few bright galaxies or, if they have a large number of members, they also contain a higher fraction of intrinsically less luminous objects.
3. Analysis
The lower richness and higher space densities of GUZC and GSSRS2 groups, compared to the APM or X-ray selected clusters allow the evaluation of the dependence of with to be examined for higher regimes of spatial densities in order to extend the available data of this relation and to compare with the law (Bahcall and West (1992)).
The spatial correlation function is computed using the estimator given by Peebles (1993)
where and are the number of real and random pairs of groups at separation and and are the number of objects in the data and random catalogs, respectively. We use an equal weighting of each data/random point for simplicity given that error bars in our samples are significantly larger than the expected differences between the estimates of from different weighting schemes according to the analysis by Ratcliffe et al. (1998). The catalogs of random groups where generated within the same volume as the real groups, with a velocity distribution corresponding to the best third-degree polynomial fit to each distribution. The choice on the actual group distribution rather than that for the galaxies, is motivated by the fact that even though both present similar behavior, by using the group distribution it is possible to avoid biases caused by the distribution of galaxies in low density regions devoid of richer groups. Errors were derived from the bootstrap resampling technique developed by Barrow et al. (1984) with 30 bootstrap samples.
We estimated for three samples, taking into account different intervals of group masses, , which represents, also, three distinct values. In order to deal with reasonable number of systems in the subsamples, the adopted mass limits are: , (397 groups, sample 1); , (268 groups, sample 2); and , (167 groups, sample 3). The lower limit in the first sample corresponds to the typical mass of the group with four members, the upper limit in the three samples was chosen to avoid groups with masses greater than the estimated mass of the Virgo cluster, (Ramella et al. (1997)).
The estimated for the total sample of GUZC groups is shown if figure 4. The correlation function gives a positive signal up to and it has a similar shape to the one for the galaxies. The results for the three constrained subsamples are shown in figure 5, 6 and 7 for the range of masses corresponding to samples 1, 2 and 3 respectively. By the inspection of figures 4, 5, 6 and 7 it is possible to notice that the behavior of for all the four samples is consistent with a power-law. The amplitude of the correlation function presents a tendency to increase, as far as we have a predominance of more massive groups. We have used the Levenbergh-Marquardt method, which takes into account errors with minimum non-linear least-squares, to estimate the best fitting parameters and in the power-law approximation . We obtain (), (), and () for subsamples 1, 2 and 3 respectively.
In order to test the stability of the estimates of the correlation function against the existence of possible fake groups, we have removed from the total sample those groups with four members and mass exceeding (48 groups). These massive groups with few members are subject to suspicion and could strongly contribute to the expected 10% fraction of pseudo-groups as discussed by Ramella et al. (1997). The correlation function for this restricted sample () is indistinguishable within errors from that of the total sample, indicating that fake groups are not likely to generate strong systematic effects in our sample.
Using the same procedure we have computed for the 104 groups in the GSSRS2 with the results displayed in figure 8. The best fitting parameters are h and . Due to the small number of objects in this sample we have not attempted divisions into subsamples.
A comparison of our results with those obtained by Jing & Zhang (1988), Maia & da Costa (1990), Ramella et al. (1990), and Trasarti-Battistoni et al. (1997) is presented in Table 1. The and values they have found, are different when compared to the one we have found for the total sample. The possible causes of the differences may be related to the small number of objects in the previous samples, to the minimum number of member galaxies assigned to groups, and also to the different adopted for the definition of groups, which results in the determination of groups with distinct physical properties. The different characteristic depths of the samples may also play an important role in the range of fitting . In particular the samples analyzed by Jing & Zhang (1988) and by Maia & da Costa (1990), which retain most of those characteristics described above, are the ones which present the most discrepant results.
We have estimated the values of for the subsamples in two different ways: (a) we compute the abundance of systems using Bahcall and Cen (1993) mass function, in the corresponding range of masses and estimate . (b) we consider that the GUZC and GSSRS2 catalogs are bona-fide complete out to 5000 km s-1 and we fit a homogeneous distribution in the range 2000 km s-1 5000 km s-1 . Taken into account Ramella et al. (1997) we expect the loss of groups at 5000 km/s with at least 4 members less than 20%, so the second method should also provides a reliable estimate of .
The resulting values for GUZC are: Mpc for the total sample, while Mpc, Mpc and Mpc for subsamples 1, 2 and 3 respectively. For the GSSRS2, Mpc in the range of masses . The numbers in square brackets correspond to the estimates using method (b). Both methods give consistent values of , provided that the typical uncertainties in are Mpc.
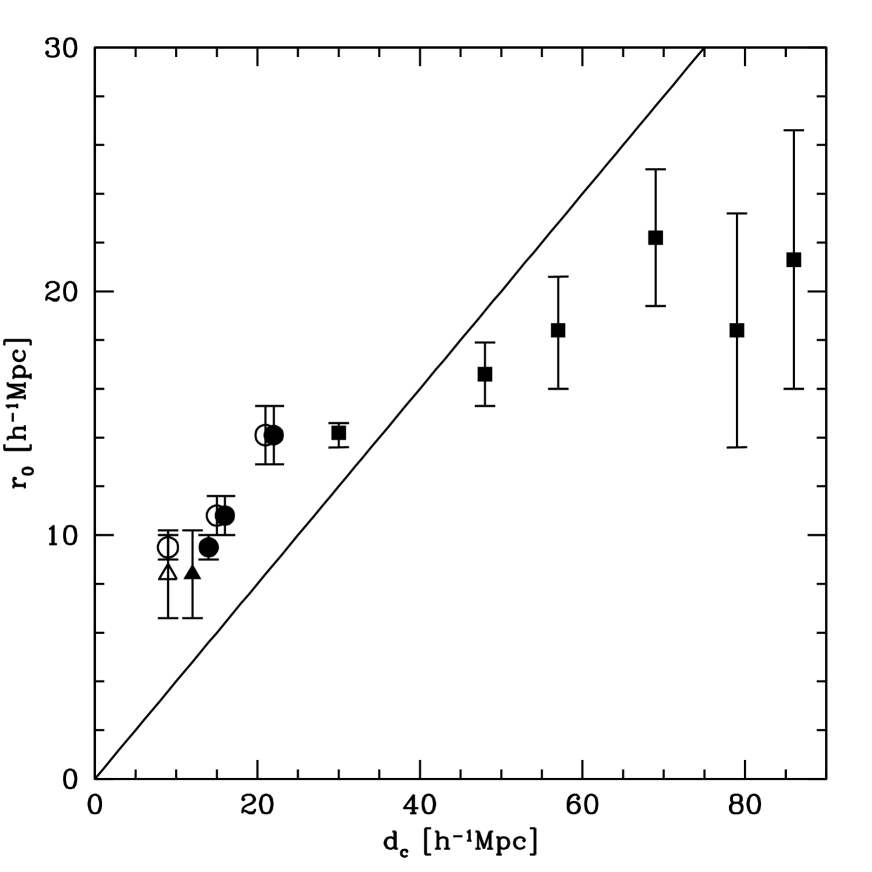
In figure 9 we plot the derived values of as a function of for the different samples of groups considered. Also, are plotted in this figure the results for APM clusters according to Croft et al. (1997). All the group sets present values higher than the universal scaling law by Bahcall and West (1992) in contrast to the clusters which have a lower amplitude than predicted by this law. Meanwhile, it is noticeable in this figure the shape of the relation is similar to that expected in hierarchical models for structure formation such as a cold dark matter scenario discussed by Croft et al. (1997).
4. Conclusions
We have analyzed the two point correlation function for two new catalogs of groups of galaxies. The GUZC catalog is the largest homogeneous sample to the present and provides a suitable data set to analyze the clustering properties of systems of galaxies of low richness. The group correlation function, for the total sample of groups, is well fitted to a power-law of the form , with and h-1 Mpc for values of Mpc. A similar analysis for GSSRS2 catalog produces h-1 Mpc and . These results differ from the findings of other authors mainly due to the different groups characteristics of the samples analyzed.
The results for subsamples of groups with different group mass intervals, show the tendency for higher values of at the small mean intergroup separations examined, when compared with the universal scaling law proposed by Bahcall and West (1992).
Correlation functions of APM clusters (Croft et al. (1997)), X-ray confirmed Abell clusters (XBACs, Abadi et al. (1998)) and the results for groups presented in this paper strongly argue for a hierarchical scenario of structure formation in the universe such as cold dark matter models.
This paper was partially supported by CONICET, SeCyT UNC and Fundación Antorchas, Argentina. MAGM acknowledges CNPq grant 301366/86-1.
NOTE ADDED IN PROOF
After this paper was submitted to ApJ, Girardi et al. (2000) examined of groups relative to the one for galaxies using the UZC and SSRS2 catalogs of galaxies. They find similar results to ours for a volume-limited sample of 139 groups (Mpc; ).
References
- Abadi et al. (1998) Abadi, M.G., Lambas, D.G. & Muriel, H. 1998, ApJ 507, 526.
- Bahcall and Cen (1993) Bahcall, N.A. & Cen, R. 1993, ApJ 407, L49.
- Bahcall and West (1992) Bahcall, N.A. & West, M. 1992, ApJ 392, 419.
- Barrow et al. (1984) Barrow, J.D., Bhavsar, S.P. & Sonoda, D.H. 1984, MNRAS 210, 19P.
- Croft et al. (1997) Croft, R.A.C., Dalton, G.B., Efstathiou, G., Sutherland, W.J. & Maddox, S.J. 1997, MNRAS 291, 305.
- da Costa et al. (1998) da Costa, L.N., Willmer, C.N.A, Pellegrini, P.S., Chaves, O.L., Rite, C., Maia, M.A.G., Geller, M.J., Latham, D.W., Kurtz, M.J., Huchra, J.P., Ramella, M., Fairall, A.P., Smith, C., & Lipari, S. 1998, AJ 116, 1.
- Falco et al. (1999) Falco, E.E., Kurtz, M.J., Geller, M.J., Huchra, J.P., Peters, J., Berlind, P., Mink, D.G., Tokarz, S.P., & Elwell, B. 1999, PASP 111, 438.
- Geller & Huchra (1983) Geller, M.J., & Huchra, J.P. 1983, ApJS 52, 61.
- Girardi et al. (2000) Girardi, M., Boschin, W., da Costa, L. N., 2000, A&A 353, 57.
- Huchra & Geller (1982) Huchra, J.P., & Geller, M.J. 1982, ApJ 257, 423.
- Huchra et al. (1990) Huchra, J.P., & Geller, M.J., de Lapparent, V., & Corwin, H. 1990, ApJS 72, 433.
- Jing & Zhang (1988) Jing, Y. & Zhang, J. 1988, A&Ap 190, L21.
- Maia & da Costa (1990) Maia, M.A.G. & da Costa, L.N. 1990, ApJ 349, 477.
- Maia et al. (1989) Maia, M.A.G., da Costa, L.N., & Latham, D.W. 1989, ApJS 69, 809.
- Marzke et al. (1998) Marzke, R.O., da Costa, L.N., Pellegrini, P.S., Willmer, C.N.A., & Geller, M.J. 1998, ApJ 503, 617.
- Nilson (1973) Nilson, P. The Uppsala General Catalog of Galaxies, Ann. Uppsala Astron. Obs. B & 6, Ser. V:A Vol 1.
- Nolthenius and White (1987) Nolthenius, R., & White, S.D.M. 1987, MNRAS 225, 505.
- Peebles (1993) Peebles, P.J.E., Principles of Physical Cosmology, Princeton University Press, 1993.
- Ramella et al. (1990) Ramella, M., Geller, M.J., & Huchra, J.P. 1990, ApJ 353, 51.
- Ramella et al. (1997) Ramella, M., Pisani, A., & Geller, M.J. 1997, AJ 113, 483.
- Ratcliffe et al. (1998) Ratcliffe, A., Shanks, T., Parker, Q.A. & Fong, R., 1998, MNRAS 296, 173.
- Schechter (1976) Schechter, P.L. 1976, ApJ 203, 297.
- Trasarti-Battistoni et al. (1997) Trasarti-Battistoni, R., Invernizzi, G., & Bonometto, S.A. 1997, ApJ 475, 1.
- Zwicky et al. (1961-68) Zwicky, F., Herzog, E., Karpowicz, M., & Kowal, C. 1961-1968. Catalog of Galaxies and Clusters of Galaxies, 6 vols. (Pasadena: California Institute of Technology).
| Sample | # of groups | |||
|---|---|---|---|---|
| Total Sample | [] | |||
| Sample 1 | [] | |||
| Sample 2 | [] | |||
| Sample 3 | [] | |||
| GSSRS2 | [] | |||
| Jing & Zhang (1988) | ||||
| Maia & da Costa (1990) | ||||
| Ramella et al. (1990) | ||||
| Trasarti-Battistoni et al. (1997) |