The evolution of disk galaxies
Estudiamos la evolución de galaxias de disco utilizando modelos evolutivos con condiciones iniciales y de frontera asociadas al escenario de formación jerárquico. Nos concentramos en predecir la historia de formación estelar, la evolución de tamaño y brillo superficial y la evolución de las relaciones de Tully-Fisher. Presentamos comparaciones con observaciones disponibles.
Abstract
We study the evolution of disk galaxies using galaxy evolutionary models with initial and boundary conditions linked to the hierarchical formation scenario. We focus our attention on predictions of the star formation history, size and surface brightness evolution and the evolution of the and band Tully-Fisher relations. Comparisons with available observational data are presented.
keywords:
galaxies: evolution— galaxies: disk0.1 Introduction
In the last decade, our understanding of galaxy formation and evolution grew dramatically thanks to the coming out of a theoretical framework for structure formation within the cosmological context (the inflation-inspired cold dark matter scenario, CDM), and to the great observational progress, in particular the imagery and spectroscopy of high redshift galaxies. Nevertheless, the fundamental questions of galaxy formation and evolution still await answers. The symbiosis of theory and observations is crucial in this field in order to connect what we “see” at different redshifts with the evolution of a given population of galaxies.
Most of the galaxies observed in the local universe are disk galaxies. An important question is how the structural, dynamical and luminosity properties of this population of galaxies evolved and how much they contributed in the past to global quantities such as the star formation (SF) rate and luminosity per unit of volume. Were the galaxy disks smaller and their surface brightness (SB) higher than at present? Which is the SF history of disk galaxies? Were these galaxies brighter and bluer in the past? Did the luminosity-velocity (Tully-Fisher) relation change in the past? A powerful theoretical tool for studying these questions related to the evolution of local and global properties of disk galaxies is the combination of inductive (backward) galaxy evolutionary models with initial and boundary conditions calculated from the hierarchical formation scenario (Avila-Reese, Firmani, & Hernández 1998; Avila-Reese & Firmani 2000; Firmani & Avila-Reese 2000). In this paper, we present some of the evolution predictions of these (seminumerical) models and we discuss them in light of the available observational data.
0.2 Disk galaxy evolutionary models in the hierarchical scenario
Disk galaxies are dynamically fragile objects. This is why, at a first approximation, we obviate the disk major mergers in their evolution and considering that disks grow inside-out gently with a gas accretion rate proportional to the hierarchical mass aggregation rate. A major advantage of our seminumerical models is that we follow locally the overall evolution of individual disks in centrifugal equilibrium, including star formation (SF) and feedback in the disk ISM, and luminosity evolution. At each epoch, the growing disk is characterized by a local infall rate of fresh gas, a gas and stellar surface density profile, a local SF rate, a color profile, and a rotation curve (including the dark matter component). The disks form with the baryon mass fraction within the growing dark halos. The angular momentum of each collapsing mass shell is calculated using the spin parameter obtained in numerical and analytical works. The local SF is induced by a gravitational instability (Toomre) criterion and it is self-regulated by an energy balance in the ISM along the vertical disk direction. The efficiency of SF in this model is almost independent of the mass (luminosity).
The main physical factors which influence most of the local and global properties of our model galaxies and their correlations are the mass, mass aggregation history (MAH), and spin parameter . These factors and their statistical distribution are related to the cosmological initial conditions. For a quick review of the main disk galaxy properties and correlations predicted at for a typical CDM model, see Avila-Reese et al. 2000; the results in detail are presented in the papers mentioned above.
0.3 Evolutionary predictions
0.3.1 Star formation rate and luminosity evolution
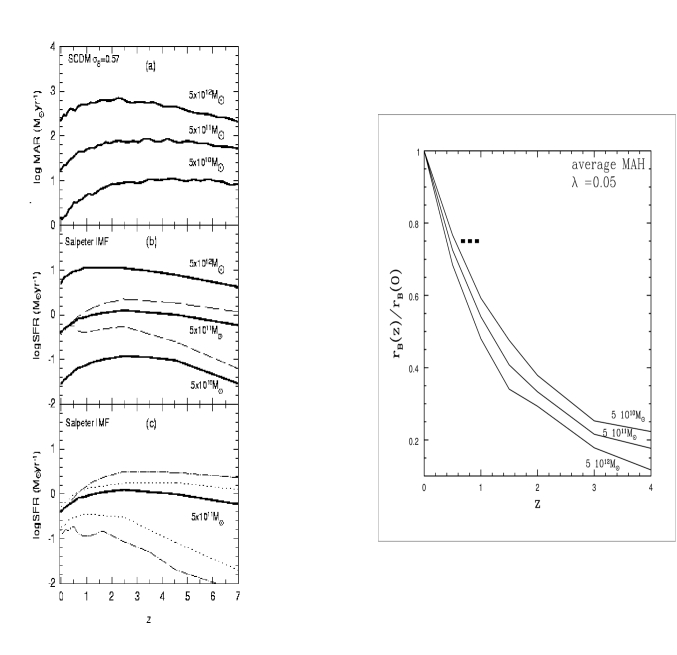
The SF rate in our hierarchical models is driven by both the gas accretion rate determined by the MAH and the disk surface density determined by . In Fig. 1(a) and 1(b) we show the average hierarchical mass aggregation rate of halos of different masses and the corresponding SF rates histories for , respectively; less massive galaxies assemble faster than the massive ones. The correlation between MAH and SF history is evident. In Fig. 1(b) we also show the SF histories for models with two extreme MAHs —early active and extended MAHs (upper and lower dashed lines)— and . The influence of on the SF history is clearly seen in Fig. 1(c) where we plotted models with (upper short- dashed line) and (lower short-dashed line) and the average MAH in both cases. The upper and lower dot-dashed lines correspond to extreme models with an early active MAH and and with an extended MAH and , respectively.
A strong prediction of our disk galaxy models, due mainly to the hierarchical MAHs, is the shape of the SF rate history with a gentle maximum at for most of the cases, and a relatively quick fall towards the present by factors on the average. From an observational study for large disk galaxies (), Lilly et al. (1998) have found the SF rate to decrease likely a factor between and (h=0.5). For our corresponding models, since the SF rate decreased a factor on average. However, for models with small , i.e., very high SB galaxies, this factor is . It is possible that galaxy samples at different redshifts suffer from a significant SB selection effect since disk galaxies, as our and other model results show, change the SB distribution with (Bouwens & Silk 2000). Therefore, the factor Lilly et al. (1998) find could be biased towards HSB galaxies in agreement with our galaxy models.
Deep field studies show that the global (cosmic) SF history per unit of volume from to 0.7 increased by a factor and by more than a factor of 10 up to the maximum which is attained at (e.g., Madau, Pozzetti, & Dickinson 1998 and the references therein). If our models actually describe the evolution of normal disk galaxies which dominate the global SF rate today, then the increment of a factor detected at could not have been produced only by disk galaxies. Other galaxy populations had to contribute to the global SF rate in the past (e.g., Babul & Fergurson 1996).
Since the band luminosity is a tracer of young and intermediate stellar populations, its evolution should be similar to the SF history. We find indeed that increases towards the past and more quickly for the less massive galaxies. At , is times larger than at for a galaxy. The integral colors of the galaxy models become bluer towards the past; on average from to , decreases by mag. Less massive galaxies undergo more color evolution; this is because they attain the peak in SF rate before than massive galaxies.
0.3.2 Size and surface brightness evolution
Disk size and SB evolution are natural in the hierarchical formation scenario. In the right panel of Fig. 1 we show the evolution of the band scale radius for average models of 3 different masses, using the flat CDM (h=0.7) cosmology. The size evolution is slightly more pronounced for more massive galaxies. In this figure we also plot a rough observational estimate by Lilly et al. (1998). According to theses authors, for large disk galaxies has grown not more than since .
Size evolution implies SB evolution. Lilly et al. (1998; dashed line), after correcting for some selection effects, found that the average SB of their large disk galaxies sample has grown mag at with respect to . Similar results were obtained by e.g., Forbes et al. (1996), Vogt et al. (1997), Roche et al. (1998). The last authors conclude that the deep field observations of disk galaxies can be better explained by luminosity and size evolution models. For our hierarchical models, we find slightly more pronounced SB evolution than the observations. In a more recent observational work, Simard et al. (1999) have found that galaxies from to seem to increase their average SB by mag. However, these authors concluded that if the selection effect due to comparing low luminosity galaxies in nearby redshift bins to high luminosity galaxies in distant bins is allowed for, then no discernible evolution remains in the SB of bright disk galaxies. Using the same data of Simard et al., Bouwens & Silk (2000) have derived an increase in the SB of mag. This difference is because the last authors have introduced corrections for SB selection bias that they find to be important due to the strong evolution in the SB distribution of disk galaxies. Certainly, the disk size and SB evolution are important tests for the hierarchical formation scenario.
0.3.3 Dynamics: evolution of the and band Tully-Fisher relations
The linking of the resolved photometric and spectroscopic data to dynamical data is crucial for the understanding of the evolution and physics of a given population of galaxies. In our hierarchical models, the mass of the galaxy grows faster than the maximum rotation velocity ; this is because the dense inner parts of the dark halo are not significantly affected by the “secondary” mass infall. The dark halos, and, therefore, the disks, obey a tight relation between mass and maximum circular velocity (see e.g., Avila-Reese et al. 1998,1999). For our CDM cosmology, we find that the disk stellar mass-maximum rotation velocity relation, , at has a slope . This relation is proportional to the band Tully-Fisher relation (TFR). The slope remains almost constant with . The coefficient decreases with , i.e., as we said above, while the mass significantly decreases towards the past, decreases only a little. We find that at , is times smaller than at or, that is the same, the zero-point of the band TFR is mag higher.
In the band, the TFR evolves in an opposite way: although the disk mass ( luminosity) decreases with , increases as we have seen in . This is because SF is more active in the past. The slope of the band TFR slightly decreases with (less massive galaxies evolve more quickly than massive ones; in particular, increases more with for the former than for the latter). Assuming the slope constant with , for our CDM model, we obtain that the zero-point of the band TFR at is mag lower than at (taking into account HSB and LSB galaxies), i.e. is times larger.
From the observational point of view, several efforts were made in order to acquire internal kinematic (Vogt et al. 1997 and more references therein) and galaxy-galaxy lensing (Hudson et al. 1998) data for disk galaxies at high redshifts. From these works it is still difficult to draw conclusions regarding the evolution of the band TFR. Since the interpretation of the results is sensitive to the cosmological model assumed, just in order to evaluate the data from several of these works, we used the critical model () with h=0.5. The results of Vogt et al. (1997) show that the zero-point of the band TFR, from to the average redshift of the sample , has changed by mag; for the Hudson et al. (1998), Simard & Pritchet (1998) and Rix et al. (1997) samples, 0.35, and 0.25, and and mag, respectively. As one sees, these works seem to be at odds with one another. The samples used in the last two papers are dominated by small, actively star-forming galaxies, while in the two first papers, normal spiral galaxies dominate. Thus, we may compare our model results with those of Vogt et al. and Hudson et al. papers. For the SCDM cosmology (with and h=0.5), mag at (in fact, the theoretical evolution of the TFR is similar for both the SCDM and CDM models). This strongly disagrees with observations in a h=0.5 cosmology. For low density or flat with cosmological constant models with h, the observational data are in better agreement with the models. In particular, in the flat CDM cosmology (h=0.7), the data of Vogt et al. give only a slightly larger value for than our models (i.e., the observed zero-point at is slightly less bright than our hierarchical models predict).
In conclusion, we find that the hierarchical formation scenario (for CDM-like models) offers robust initial and boundary conditions for disk galaxy evolution. However, the evolution of disk sizes and the zero-point of the band TFR seems to be too exagerated with respect to some observational data. We stress that analytical approaches should take into account that the zero-point of the “structural” and band TFRs evolve in a different way.
References
- [1] Avila-Reese, V., Firmani, C., & Hernández, X. 1998, ApJ, 505, 37
- [2] Avila-Reese, V., & Firmani, C. 2000, Rev.Mex.AA, 36, N.1, 23
- [3] Avila-Reese, V., Firmani, C., Klypin, A., & Kravtsov, A.V. 1999, MNRAS, 310, 527
- [4] Avila-Reese, V., Firmani, C., Klypin, A., & Kravtsov, A.V. 1999, in “Cosmic Evolution and Galaxy Formation: Structure, Interactions and Feedback”, eds. J.Franco et al., ASP Conf. Series, in press (astro-ph/0002309)
- [5] Babul, A., & Ferguson, H.C. 1996, ApJ, 458, 100
- [6] Bouwens, R.J., & Silk, J. 2000, (astro-ph/0002133)
- [7] Firmani, C., & Avila-Reese, V. 2000, MNRAS, 315, 457
- [8] Forbes, D.A., Philips, A.C., Koo, D.C., & Illingworth, G.D. et al. 1996, ApJ, 462, 89
- [9] Hudson, M.J., Gwyn, D.J., Dahle, H., & Kaiser, N. 1998, ApJ, 503, 531
- [10] Lilly, S.J. et al. 1997, ApJ, 500, 75
- [11] Madau, P., Pozzetti, L., & Dickinson, M. 1998, ApJ, 498, 106
- [12] Rix, H.-W., Guhathakurta, P., Colless, M., & Ing, K. 1997, MNRAS, 285, 779
- [13] Roche, N. et al. 1998, MNRAS, 293, 157
- [14] Simard, L., & Pritchet, C.J. 1998, ApJ, 505, 96
- [15] Simard, L. et al. 1999, ApJ, 519, 563
- [16] Vogt, N. et al. 1997, ApJ, 479, L121