What do the UV Spectra of Narrow-line Seyfert 1 Galaxies tell us about their BLR?
Abstract
We study the UV spectra of narrow-line Seyfert 1 (NLSy1) galaxies and compare them with “normal” AGN. Similar to their optical lines, the NLSy1s show narrower UV lines. They are also characterized by weaker CIV 1549, CIII] 1909, and stronger AlIII 1857 emission. These UV line properties add to the optical and X-ray properties known to be part of the Boroson & Green eigenvector 1. We show that the steep soft-X-rays, which characterize the NLSy1s SEDs, change the equilibrium of the two phase cloud-intercloud medium resulting in somewhat higher BLR cloud densities, lower ionization parameter and larger BLR radii. These modified conditions can explain the unusual emission line properties we find in NLSy1.
Using a specific model of an accretion disk with corona presented by Witt, Czerny & Życki, we also show that the steep soft and hard-X-ray continua can be explained if the ratios are larger than in “normal” Seyfert1/QSO strengthening earlier suggestions that the is the physical parameter driving this eigenvector.
1 Introduction
Narrow-line Seyfert 1 galaxies (NLSy1), first suggested as a distinct class of AGN by Osterbrock and Pogge (1985), are characterized by Balmer lines whose FWHM is smaller than typical Seyfert 1 galaxies i.e. 500 FWHM 2000 km s-1, slightly broader than the forbidden lines. On the other hand they are clearly different from Seyfert 2 galaxies since the ratio of OIII] 5007 to H is 3, i.e. below the limiting value found by Shuder and Osterbrock (1981) to discriminate between Seyfert 1 and Seyfert 2 galaxies. In NLSy1 strong Fe II optical multiplets and higher ionization iron lines (e.g.FeVII]6087Å and FeX] 6375Å) are often present. These are usually seen in Seyfert 1 and not in Seyfert 2 galaxies.
Many NLSy1s have an unusually strong big blue bump (BBB) which, when compared to typical Seyfert 1 and QSO BBBs, is shifted towards higher energies, sometimes even out of the optical/UV range (at least one object actually peaks in the soft X-ray band: RE J1034+396, Puchnarewicz et al. 1995). Its high frequency tail is clearly seen in soft X-rays and these objects have generally steeper soft X-ray continua than is “typical” for Seyfert 1 galaxies (Boller, Brandt & Fink 1996), meaning that they have a stronger soft-X-ray excess over the hard X-ray power law. The intrinsic hard-X-ray continua of NLSy1s are also generally steeper (Brandt, Mathur, Elvis 1997) than in typical Seyfert 1s. The NLSy1s are usually only weakly absorbed in the soft X-rays (Boller, Brandt & Fink 1996) and in many cases both the UV flux and soft X-ray flux are strongly variable.
NLSy1 objects are generally radio-quiet and their radio powers are typical of those found in other Seyfert galaxies (Ulvestad, Antonucci & Goodrich 1995).
There is no widely adopted view on the basic reason why the continua of NLSy1 galaxies are different from classical Sy1. The two most probable explanations of the stronger big blue bumps in these objects are pole-on orientation (Puchnarewicz, Mason, Córdova 1994, Wilkes 1998), and higher accretion rate relative to the mass of the central object (e.g. Boller, Brandt, Fink 1996; Wandel 1997, Czerny, Witt & Życki 1997, Pounds, Done & Osborne 1995). Steeper hard X-ray spectra and strong permitted FeII lines are possibly a secondary effect of the atypical shape of the soft-X-ray continuum (Pounds, Done & Osborne 1995, Brandt, Mathur & Elvis 1997; Wilkes, Elvis and McHardy 1987, Shastri et al 1993).
Wilkes et al. (1999), studying a sample of low redshift quasars and Sy1s, and their relations between optical/UV emission lines and the continuum, found that the four NLSy1 in their sample show smaller equivalent widths of CIII] and CIV lines than typical AGN (EW(CIV) 40Å for NLSy1, while 30Å EW(CIV) 200Å for other AGN). In this paper we investigate in detail the UV line properties of a sample of NLSy1 objects to determine whether the weakness of the carbon lines is typical of these objects, constituting an additional property which distinguishes them from “normal” Sy1 galaxies. We investigate the physical conditions of the BLR which may explain these systematic differences. We also discuss the possibility that these objects have luminosities close to their Eddington luminosity.
2 UV line measurements
2.1 The sample
From the currently known set of NLSy1 (Boller, Brandt & Fink 1996, Greiner et al. 1996, Puchnarewicz et al. 1992, Puchnarewicz et al. 1994, Brandt, Fabian & Pounds 1996, Grupe et al. 1996 , Moran et al. 1996, Brandt - private communication, Wilkes et al. 1999) we have defined a subset of 11 objects (Table 1) for which UV spectra are available either from the HST (5 objects) or IUE archives. The IUE spectra were taken from Lanzetta et al. (1993), and the reduced HST spectra from Dobrzycki (private communication, see also Bechtold et al. 2000).
2.2 Line parameters
We have measured the EW (Table 2), line ratios (Table 3) and line widths (FWHM; Table 4) of all prominent UV lines: Ly 1216, CIV 1549, CIII] 1909, SiIII] 1892, AlIII 1857, SiIV+OIV] 1400 blend, and MgII 2798.
The EW and FWHM of IUE spectra were measured using the splot task in IRAF: the EW by fitting a linear continuum to the data and integrating across the observed emission line (keystroke ‘e‘), the FWHM by measuring the width at half the flux in the line peak above the continuum. The same procedure was applied when the line parameters in the HST spectra were measured, although a different program findsl (provided by Aldcroft, Bechtold & Elvis 1994), specially written to handle the HST data, was used. The line parameters presented in Tables 2,3,4 have been corrected for absorption: for weak absorption by using a linear fit across the absorption line, for strong absorption (as in PG 1351+560 and PG 1411+442) by assuming a symmetric emission line profile and reflecting the unabsorbed wing about the peak.
As has been noted by Vestergaard & Wilkes (2000), CIII] is blended with FeIII UV34 1914 line, which should be taken into account especially when the CIII] line is weak. In three spectra (IZw1, PG 1211+143, Mrk 478), where the FeIII UV34 was clearly visible, we subtracted this line (modeled as a Gaussian centered at =1914Å rest frame) from the CIII] blend.
2.3 Comparison of NLSy1 with “normal” AGN
In this section we compare the UV line properties of NLSy1 with Seyfert 1 galaxies and quasars. Fig. 1a shows the EW of Ly, CIV and MgII of our NLSy1 sample (shaded areas) compared to the sample of Seyfert 1 galaxies (dotted line) from Wu at al. (1983) (their sample includes three NLSy1: IZw1, Mrk 478, IIZw136 which we excluded here) and low redshift quasars from Wilkes et al. (1999), Corbin & Boroson (1996), and radio-loud quasars from Baldwin, Wampler & Gaskell (1989), combined and denoted by a dashed line. The EW of CIV and MgII lines are significantly smaller in NLSy1 than in the broad line Seyfert 1 galaxies and quasars. The K-S test yielded a 0.001 chance that the EW of CIV and MgII in NLSy1s and Sy1s are drawn from the same population. For Ly the chance was 0.02. When compared to QSO the significance remained strong for CIV () and MgII (), while for Ly the distributions are similar (). The smaller EW of the carbon and MgII lines cannot be due to a simple continuum increase, as this would effect the EW of all lines equally, while EW(Ly) is not significantly smaller.

As can be seen from Table 3 the CIV/Ly (mean 0.250.09), CIII]/Ly (mean 0.050.05) and the MgII/Ly (mean 0.050.03) ratios are smaller compared to those typically observed in Seyfert 1 galaxies (Wu et al. 1983 give observed ranges: 0.35-2.01, 0.03-0.39, 0.07-0.63 respectively) and quasars (observed range: 0.3-1.04, 0.15-0.3, 0.15-0.35). To show this more clearly Figure 2 shows the CIII]/Ly vs CIV/Ly line ratios for NLSy1 in our sample (denoted as filled squares) with the Seyfert 1 sample (denoted as circles) and quasars from Laor et al. (1995), Christiani & Vio (1990), Wilkes et al. (1999) and narrow line quasars from Baldwin et al. (1988).
As the lines in NLSy1 are narrow, we can clearly resolve the components of the CIII]+SiIII]+AlIII blend (especially in the HST data, in the IUE data the S/N is often too low). From Table 3 it is also clear that the SiIII] line in most of the NLSy1 is very strong compared to the CIII] line. Also the SiIV+OIV] blend is strong compared to CIV (mean SiIV+OIV]/CIV ratio in NLSy1 is 0.490.26, larger than the mean ratio of 0.3 in quasars from Francis et al. 1991). However, the SiIV+OIV]/Ly ratio is in the range of normal AGN, indicating that the large SiIV+OIV]/CIV ratio is due to weaker CIV emission. The AlIII doublet in NLSy1 is rather strong (equivalent width few Å - see Table 2).
Although broader than H the UV lines in NLSy1 are narrow compared to other AGN. In Table 4 and Fig. 1b we compare our objects with samples of low redshift quasars from Corbin & Boroson (1996) and Wilkes et al. (1999), and with a radio-loud sample from Baldwin, Wampler & Gaskell (1989).


3 Discussion
We will now investigate what the line strengths and line ratios tell us about the physical properties in the BLR clouds of NLSy1 (Section 3.1). Then we will discuss the continuum properties of NLSy1 (Section 3.2) and investigate what they indicate about their central engine. In conclusion we show how the deduced differences between the central engines of NLSy1 and “normal” AGN can explain their different, observed emission line spectra.
3.1 Physical properties of the BLR clouds in NLSy1
More than ten years ago Gaskell (1985) noticed that Seyfert 1 galaxies with narrow H lines of FWHM 1600 km s-1 show lower H equivalent widths than typical Seyfert 1. He interpreted this finding as a result of collisional destruction of H in the higher density BLR clouds in these objects. Although we do not study the optical spectra of NLSy1 in this paper, we will now investigate whether the UV spectra lead to a similar conclusion.
Rees et al. (1989) calculated the line intensities for different BLR cloud densities at constant column density ( cm-2) and ionization parameter (). They found that optically thick lines such as hydrogen and carbon lines have a fairly constant intensity up to a certain density, above which these lines become thermalized and their intensity drops considerably. For hydrogen lines, CIV and MgII this critical density is cm-3. For the semi-forbidden lines CIII] and SiIII] it is around cm-3 and cm-3 respectively. The Ly and CIV lines are usually strong coolants at densities smaller than these critical values, but as the density increases and these lines become thermalized, other high-excitation lines such as CIII 977 and AlIII 1857 take over the cooling.
In the previous section we showed that the UV spectra of NLSy1s, when compared to “normal” Seyfert 1 and QSO galaxies, show weaker carbon and MgII lines. Although the wavelength of our spectra does not cover the range of CIII , the AlIII 1857 doublet is clearly seen (where the S/N is high enough) and is especially strong in IZw1 (see Table 2). All these line properties suggest that in NLSy1 objects the BLR clouds have higher densities than the BLR clouds in “normal” AGN. We will estimate how much higher by studying the line ratios in the following section.
a) The line ratios
The CIII] and CIV to Ly ratios are often used as a density indicator. This is because the carbon lines are collisionally excited (hence sensitive to density), while Ly is not (note however that Mathur et al. 1994 showed that for large ionizing parameters, , where , CIII] ceases to be a density indicator). These line ratios are also a sensitive function of the ionization parameter U, therefore we investigate the relation of these line ratios to density and U.
We have calculated line ratios using the photoionization code CLOUDY (version 80.07, for reference see Ferland 1991). First as an input ionizing continuum we took a standard AGN continuum (table agn; Mathews & Ferland 1987). With this continuum, the observed lines were only reproduced with higher densities in the CIII] than the CIV emitting clouds. This requires a steep increase in cloud density with radius, which is contrary to expectations and seems unrealistic. Then we used the spectral energy distribution (SED) of the NLSy1 PG 1211+143 as the ionizing continuum. Although no detailed study of the SEDs of NLSy1s has been made and is beyond the scope of this paper, PG 1211+143 is typical of those studied to date with , where (Wang, Brinkmann & Bergeron 1996; where typical NLSy1 slopes are in the range 1.5 to 3.5 - see Boller, Brandt & Fink 1996) and (i.e. slope measured between 1 m and 2500Å, where typical NLSy1 values are 0.4 to 2.8 - see Lawrence et al. 1997). The IR to hard X-ray SED of this object was taken from Elvis et al. (1994) and is reproduced here in Fig. 3. The SED was linearly interpolated between the observational points in the optical/UV region. The EUV continuum was determined by a linear interpolation between the lowest energy point in the X-ray range and the highest in the UV, providing a conservative (i.e. low) estimate of the number of EUV photons. We investigated a range of cloud densities ( cm-3, well within the range of the applicability of the photoionization code CLOUDY111“The hydrogen and atoms and ions of helium are treated in the code as 10-level atoms. The treatment of the heavy elements is not as complete as hydrogen and helium, but a 3-body recombination is included as a general recombination process. […] The physical high-density limit is set by the approximate treatment of the three-body recombination-collisional ionization ( cm-3) for the heavy elements and the approximate treatment of line transfer”. - see Ferland (1991).) and ionization parameters (, where is the value for the “standard” BLR - Davidson & Netzer 1979). The metal abundances were assumed to be solar and the cloud column density 1023 cm-2. The calculated line ratios are plotted in Fig. 4, where the observed line ratios for our NLSy1 are denoted by horizontal lines. The CIV/Ly ratio (Fig. 4a) depends very strongly (more than any other line ratio) on the value of the ionization parameter as well as on the density of the BLR clouds. Small values of the ionization parameter () are clearly favored by our data, for which densities of the order of 1011 cm-3 to 1012 cm-3 are needed to produce the low observed CIV/Ly ratios. For the same, small ionization parameter the observed CIII]/Ly ratios indicate densities between cm-3 and 1011 cm-3 (see Fig. 4b), which are smaller than the cloud densities inferred from the CIV/Ly ratios. This strongly suggests that the CIII] and CIV lines are formed in different clouds, which implies a stratified BLR. This is as expected from the results of reverberation mapping (e.g. NGC 5548 Korista et al. 1995, NGC 7469 Wanders et al. 1997, Fairall 9 Rodrigues-Pascual et al. 1997) which show that the CIV and Ly line fluxes vary with a smaller time delay, relative to the UV continuum, than the CIII] lines, indicating that CIV, Ly emitting clouds lie nearer to the central engine than the CIII] emitting clouds. The density of the CIV and Ly emitting line region is typically estimated (e.g. Peterson et al. 1985) to be 1011 cm-3, while the CIII] region is 109.5 cm-3. Thus the density of the CIV, Ly emitting clouds in our NLSy1s is comparable or somewhat ( 10 times) larger than in normal AGN.


To further constrain the density of the CIII] emitting clouds, we need to investigate its ratio to a line which is formed in the same clouds for example SiIII]. For the density of the emitting gas inferred from the SiIII]/CIII] line ratio is between 109.5 cm-3 and 1010.5 cm-3 (see Fig. 4c, we omit here PG 1411+442, which is a BAL QSO and has cm-3). The ratio of SiIII]/CIII] is larger than the typical value of seen in quasars (Laor et al. 1995) for all objects (except for BAL QSO PG 1411+442; see Table 3 and Fig. 4c) This high ratio is probably the result of the suppression of CIII] while SiIII] remains strong, due to the smaller critical density for CIII] ( cf. cm-3 for SiIII], see Section 3.1a).
In Fig. 4d we present the observed and calculated SiIV+OIV]/Ly ratios. For the clouds have density of the order of 1011 cm-3 to 1012 cm-3, similar to the range for CIV and Ly emitting clouds.
The MgII/Ly ratio, on the other hand, is very small, and cannot be reproduced by clouds with small ionization parameter even when the column density, , is varied over the range - cm-2. Only larger than standard ionization parameters, in the range to , can produce the observed ratios (Fig. 4e). This may indicate that the MgII lines do not form in the same region as the other BLR lines. We will return to this problem in the next section.
To summarize the results of this subsection we conclude that the unusual UV line ratios in the NLSy1 objects can be explained if the BLR clouds have 10 times lower ionizing parameters () and a few times (10) higher densities (n(H) 1011-12 cm-3 for Ly, CIV, SiIV emitting clouds and 109.5-10.5 cm-3 for CIII], SiIII] emitting clouds) than normal AGN. The BLR is clearly stratified with CIV, Ly, SiIV producing clouds lying closer to the central engine, while CIII] and SiIII] emitting clouds lying predominantly further out. The MgII emission cannot be produced by the same cloud population, suggesting that these lines form in a different region.
Although clouds with a wide range of properties are likely to exist in the broad-line region, it was shown by Baldwin et al. (1995) and Korista et al. (1996), that each emission line is most efficiently produced in gas with the optimum parameters for that line. These are the so called locally optimally emitting clouds or LOCs. Thus our modeling derives the parameters of the LOCs for each line so that the line fluxes and ratios provide a good approximation to a detailed multi-zone model of the BLR (see Baldwin et al 1995, Korista et al. 1996 and our Table 3), which is beyond the scope of this paper.
b) The weak MgII problem
The MgII line is surrounded on both sides by FeII emission. As the FeII emission in NLSy1s is usually very strong (Boller, Brandt & Fink 1996), it is possible that the wings of MgII disappear in the stronger iron bumps. This effect could lead to an underestimation of the MgII emission of up to a factor of two in the strongest FeII sources (such as IZw1 - see Vestergaard and Wilkes 2000). However, even if our measurements were underestimating the MgII emission by such a large factor, the real MgII/Ly ratio would still be much smaller than that observed in quasars or in the lower end of the range for Seyfert 1s (see Table 3). The ionization parameter U inferred from the observed line ratio would be (see Fig. 4e), still larger than that inferred from the other emission lines.
Thus we conclude that the MgII emitting clouds have a different value of the ionization parameter, and are formed in a physically different region of the BLR (consistent with the different time lags shown by Ly, CIV and MgII lines in NGC 5548). Photoionization models predict that MgII is either formed in a partially ionized zone (PIZ) of the BLR clouds or in a low ionization region (LIL) separate from the high ionization region (HIL) where the Ly, CIV, CIII] lines are formed (Collin-Souffrin et al. 1988). If the MgII line is formed in a PIZ it is possible that the stronger BBB in NLSy1s will push the ionization front further back into the cloud, resulting in a smaller PIZ and weaker MgII emission, than for objects with a “normal” BBB.
However, the weaker MgII emission is not consistent with the stronger FeII optical emission observed in NLSy1, which in photoionization models is predicted to be formed in the same region (PIZ, Krolik & Kallman 1988, LIL, Collin-Souffrin et al. 1988). This inconsistency suggests that the FeII emission is instead generated in a different region from MgII. The observations of line variability in NGC 5548 (Sergeev et al. 1997) showed that the FeII optical multipets have a very long time lag of several hundred days, while the MgII has a 30-50 day time lag, also implying that these lines are formed in different regions. The FeII lines may be produced in the outer regions of the accretion disk as suggested by Dumont & Collin-Souffrin (1990) or in a separate, mechanically heated region closely related to the compact radio source as in Collin-Souffrin, Hameury & Jolly (1988) (hence the observed anti-correlation of FeII emission and radio flux).
3.2 High luminosity to the Eddington luminosity ratio
It has been suggested by a number of authors that NLSy1 galaxies as a class have systematically higher ratios of their luminosity to the Eddington luminosity, i.e. they have systematically lower masses in a given luminosity range than Sy1 galaxies and QSOs (Pounds, Done & Osborne 1995, Wandel 1997). This suggestion was made based on the analogy with the Galactic black hole candidates. We will address this suggestion now.
3.2.1 Continuum properties
One of the current explanations of the soft-X-ray excess in AGN is reprocessing of the hard X-rays by partially ionized, optically thick matter, probably in the accretion disk. The model describes well the soft X-ray continuum of low-luminosity, flat Seyfert galaxies, but has problems with fitting the steepest spectra (see Fiore, Matt & Nicastro 1997), which characterize NLSy1. The steep can instead be explained by emission from the innermost part of an accretion disk which is then Comptonized by an optically thin, hot corona surrounding the disk (Czerny & Elvis 1987; Laor et al. 1997).
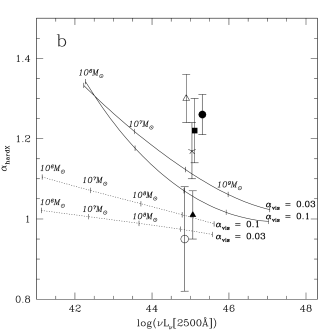
Theoretical models which can explain both the presence of the BBB and the hard X-ray emission are based either on radial or horizontal stratification between the hot optically thin and cold, optically thick accretion flow (Wandel & Urry 1991, Shapiro, Lightman & Eardley 1976, for a review see Wandel & Liang 1991). In this paper we use the model of an accretion disk corona (ADC) by Witt, Czerny & Życki (1997), where the corona itself accretes and generates energy through viscosity, and the division of the flow into optically thin and optically thick regions results from the cooling instability discussed by Krolik, McKee and Tarter (1981). Such a model is able to predict the fraction of the energy generated in the corona instead of adopting this quantity as a free parameter. The model is fully defined by 3 parameters: the mass of the central black hole (), the accretion rate or the ratio of the luminosity to the Eddington luminosity () and the viscosity parameter (, assumed to be the same in both the disk and the corona). The model predicts a systematic change in the opt/UV/X-ray spectral energy distribution due to a change in . A larger ratio results in a more pronounced BBB, which is shifted towards higher energies (resulting in stronger soft-X-ray emission and hence steeper soft X-ray slopes).
We have determined continuum properties predicted by this model over a large range of (0.001 to 0.7), (0.02 to 0.4) and black hole masses ( to ). We then compared the observed continua of our NLSy1 with the UV luminosity at 2500Å, and the soft and hard X-ray slopes ( and ) predicted by the model. Table 5 shows the observed (from ROSAT) and (from ASCA) slopes for each object, while Table 6 gives the best fitted model parameters for each object. Our model was able to reproduce the steep soft and hard X-ray slopes within the observed uncertainties for most of the NLSy1. However for two objects (IZw1, PKS 0558504) we did not succeed in fitting both the soft and hard-X-ray slopes simultaneously. This may be due to the way we treat Comptonization in our model (see Janiuk & Czerny 1999 for further details). In Fig. 5a,b we show how the X-ray slopes change with the model parameters. Each curve represents one value of and and a full range of black hole masses, where smaller lie at smaller 2500Å luminosities. We see clearly that only the large ratios of can give the steep, observed soft X-ray slopes.

As has been shown by Czerny, Witt & Życki (1997), quasars radiate usually at 0.01-0.2 of their Eddington luminosity, while Seyfert galaxies radiate at 0.001-0.3. Our NLSy1 (where we use the same ADC model as Czerny, Witt & Życki 1997 to fit the parameters of the central engine) radiate at 0.27-0.58, much larger than the typical AGN. The masses of the central black hole calculated from the model ( to ) for our objects are of the same order as masses found in typical Seyfert 1 galaxies, but the bolometric luminosities are larger, and comparable to those of QSOs (see Wilkes et al. 1999, Table 12 for comparison). This is deduced from the stronger, higher energy BBB and places the NLSy1 in a transition zone between the Sy1s and QSOs i.e. among Sy1s with larger luminosities or QSOs with lower masses. We note that, while the absolute numbers we deduce depend upon the particular ADC model used, the general trends do not.
3.2.2 Density and the radius of the BLR
The structure and the dynamics of the BLR is complex, as suggested by variability studies in the case of Seyfert galaxies. However, we can analize the scaling properties of the whole BLR of an object with the properties of the central source, including the shape of the X-ray continuum.
The BLR gas Compton heated by the ionizing continuum will form (in any geometry) two phases: a cool phase with (the BLR clouds) and a hot phase with (the intercloud medium, see Krolik and Kallman 1988, Czerny & Dumont 1998, Wandel & Liang 1991), when in equilibrium. The precise values of these temperatures depend on the shape of the continuum.
In the context of the two-phase model, we will now investigate how the properties of the BLR change due to the steeper X-ray continuum of a NLSy1. We use the ionization parameter of Krolik, McKee & Tarter (1981):
| (1) |
where is the total pressure, and the density and temperature of the cold phase, and is the flux above 1 Ryd determined by the ionizing luminosity of the central source and the current radius (where effects of geometry have been neglected):
| (2) |
The two phases coexist at a value of the ionization parameter, , which scales with the hot phase temperature, in the following way (Begelman et al. 1983):
| (3) |
The BLR is most probably radially extended. For the purpose of exploring the various dependencies, we determine a representative radius for the BLR. Note that this is a scaling factor rather than the specific radius at which a particular emission line is generated. If the cloud number density profile is flatter than , then most of the emission would come from the outer radii of the BLR. As in the case of the Inverse Compton heated coronae discussed by Begelman et al. (1983), a nearly hydrostatic corona will exist up to a radius where the temperature of the hot medium is equal to the “escape” temperature (i.e. the virial temperature). At larger radii the corona is heated to temperatures exceeding the escape temperature, becomes unstable and forms an outflowing wind. We therefore identify the outer edge of the BLR, with the radius where the hot medium temperature is equal to the virial temperature
| (4) |
The size of the BLR expressed in units of the Schwarzschild radius, is then given by:
| (5) |
so a lower value of the hot medium temperature in NLSy1 galaxies is consistent with larger values of and, consequently, lower values of the typical velocities.
A similar conclusion, that the BLR radius is larger in NLSy1s, was reached by Wandel (1997) who assumed that the representative radius of the BLR is determined by the requirement to have a standard value of the ionization parameter. He then showed that the size of the BLR region is dependent not only on the luminosity of the central source, but also on the soft X-ray spectral slope. A steeper (softer) X-ray spectrum has a stronger ionizing power and hence, for a constant ionizing parameter, the BLR clouds are at larger distances from the central source, have smaller velocity dispersions and as a result form narrower emission lines. Laor et al. (1995) also reach a similar conclusion but in their picture the narrow lines in NLSy1 result purely from the lower black hole mass. In our scenario the lower black hole mass and the shape of the SED (i.e. the steeper soft-X-rays which decrease ) combine to produce the narrow lines.
Combining equations (1)-(4) we estimate the cloud density:
| (6) |
or using logarithms:
| (7) |
As has been argued in Section 3.2.1, NLSy1s have bolometric luminosities comparable to QSOs, although their central black holes have lower masses. The median value of a black hole in quasars is (see Czerny, Witt & Życki 1997 calculations), while the median black hole mass in NLSy1s (as inferred from our calculations, using the same ADC model - see Table 6) is i.e. 55 times lower. Let us assume that a typical quasar SED is composed of a power law and an accretion disk spectrum peaking at 10 eV (, 1240Å), while a typical NLSy1 SED has a power law and a disk peaking at 80 eV (however note that the most extreme NLSy1 RE J1034396 has its peak at 120eV - see Puchnarewicz et al. 1995). Krolik and Kallman (1988) calculated the Compton temperatures of the hot phase for these SEDs, normalizing both to have the same total ionizing energy. The 10eV bump spectrum gave Compton temperatures 3.0 while the 80eV bump gave a lower temperature 8.0 . At the same time the temperature of the cool phase increased by a factor 3.0 (0.5 in logarithm see Krolik & Kallman 1988 Fig. 2). Hence the Compton temperature of the hot phase in NLSy1 and QSOs differs by: and the temperature of the cold phase is larger by: . Substituting the above values into equation (7) implies that i.e the densities of the BLR should be higher by a factor of 10 in NLSy1 than in typical QSOs with redder BBB.
The larger BLR radii and larger by a factor 10 densities obtained from our modeling (as being due to hotter BBBs) are consistent with the narrow lines and line ratios observed in NLSy1s. Thus we conclude that the unusually hot and strong BBB in NLSy1s can naturally produce their observed UV spectra.
4 NLSy1 vs. BAL QSOs
It has been suggested (e.g. Leighly et al. 1997, Lawrence et al. 1997) that there may exist a connection between NLSy1 and BAL QSOs. Both these classes have strong FeII 4570 and AlIII 1857 emission and weak CIV 1549 and [OIII5007. Their continua are red in the optical and strong in the IR; additionally both classes are mostly radio-quiet. Leighly et al. (1997) reported evidence for relativistic outflows in three NLSy1.
Observationally there are also many differences. NLSy1 are strong soft-X-ray emitters, while BAL QSOs are weak, possibly due to X-ray absorption (Mathur, Elvis & Singh 1995). BAL QSOs are thought to be seen more edge-on, at viewing angles skimming the edge of the dusty torus (Turnshek et al. 1996, Aldcroft, Elvis & Bechtold 1993). NLSy1s, on the other hand, are probably viewed more face-on, as they show low absorption from the torus (Boller, Brandt & Fink 1996) and some even show beaming in their radio spectra (e.g. PKS 0558-504, Remillard et al. 1991).
In high resolution HST spectra NLSy1 show absorption features which are much weaker than in BAL QSOs (see Table 2). However this is expected since 50% of Seyfert 1s show absorption features (Crenshaw et al. 1995). The optical spectra of some BAL QSOs may resemble the spectra of NLSy1, showing narrow H with FWHM 2000 kms-1 (that is why the two BAL QSOs: PG 1351+640 and PG 1411+442 were initially chosen to be in our sample), but this only cautions us that basing classifications on optical spectra alone is potentially misleading.
5 Conclusions
In this paper we have studied the UV emission line properties of a class of extreme opt/UV/X-ray AGN: the narrow line Seyfert 1 galaxies. We found 11 NLSy1s that had been observed in the UV by either HST or IUE. We have shown that in comparison with “normal” broader line AGN, the equivalent widths of CIV and MgII are significantly smaller (NLSy1 have EW(CIV)60 and EW(MgII)20, normal AGN have EW(CIV)210 and EW(MgII)120), the EW of AlIII larger (few Å), and the UV line widths are narrower (although not as narrow as the optical H line). Also the CIII]/Ly, CIV/Ly and MgII/Ly line ratios are smaller, while those of SiIII]/CIII], SiIV+OIV]/CIV lines are larger. Photoionization models predict that these line ratios are formed in material with densities higher, by a factor few (less than 10) than standard BLR cloud densities, and with the ionization parameter lower by a factor 10. These parameters however predict higher MgII/Ly ratio, in contradiction to the lower ratios observed requiring that MgII be produced in a separate region.
We have fitted the SEDs of our NLSy1s to the Witt, Czerny & Życki (1997) model of an accretion disk with a Compton cooled corona and found that NLSy1s radiate at , much larger than the typical AGN ( 0.3). The masses of the central black holes calculated from the model are, in our objects, of the order of masses found in typical Seyfert 1 galaxies () but the bolometric luminosities ( erg s-1) are larger and comparable to those of QSOs.
Krolik & Kallman (1988) predict that steeper soft-X-ray BBBs, such as these of NLSy1s, change the equilibrium of the two-phase cloud-intercloud medium, decreasing the temperature of the hot intercloud medium (which we assume to be the corona above the accretion disk) and increasing the temperature of the cool BLR clouds. We show that this change in equilibrium increases the density of the BLR clouds resulting in a change of the observed line intensities and ratios consistent with these in NLSy1s. In addition the resulting decrease in , causes an increase in the radius of the BLR, a correspondingly lower velocity dispersion and narrower lines as observed in NLSy1s.
The NLSy1s lie at the extreme end of the Boroson and Green eigenvector 1 (Boroson & Green 1992), which was then found (Brandt & Boller 1998) to link the soft X-ray properties with the optical properties i.e. the FeII/H and OIII] strengths and H line width. We have found that the NLSy1s have very weak CIV and CIII] lines, and narrow UV lines extending the set of parameters linked to eigenvector 1. The large BLR cloud densities, deduced from these characteristic UV line ratios, are probably due to the steep soft X-ray SEDs, which are in turn, the result of larger ratios (as inferred from the Witt, Czerny & Życki 1997 ADC model). In this scenario a larger is the physical parameter driving the Boroson & Green eigenvector 1.
References
- (1)
- (2) Aldcroft, T., Bechtold, J., & Elvis, M. 1994, ApJS, 93, 1
- (3) Aldcroft, T., Elvis, M., & Bechtold, J. 1993, AJ, 105, 2054
- (4) Baldwin, J. A., Ferland, G., Korista, K., & Verner, D. 1995, ApJ, 455, L119
- (5) Baldwin, J. A., McMahon, R., Hazard, C., & Williams, R. E. 1988, ApJ, 327, 103
- (6) Baldwin, J. A., Wampler, E. J., & Gaskell, S.M. 1989, ApJ, 338, 630
- (7) Bechtold, J., Dobrzycki, A., Wilden, B., Morita, M., Dobrzycka, D., Scott, J., & Tran, K.-V. 2000, in preparation
- (8) Bechtold J., Czerny B., Elvis M., Fabiano G, & Green R. F. 1987, ApJ, 314, 699
- (9) Begelman M. C.; McKee, C. F.; Shields, & G. A. 1983, ApJ, 271, 70
- (10) Boller, Th., Brandt, W. N., & Fink, H. 1996, A&A, 305, 53
- (11) Boller, Th., Bertoldi, F., Dennefeld, M., & Voges, W. 1998, A&AS, 129, 87
- (12) Boroson, T. A., & Green, R. F. 1992, ApJS, 80, 109
- (13) Brandt, W. N., & Boller, Th. 1998, Astron. Nachr., 319, 7
- (14) Brandt, W. N., Mathur, S., & Elvis M. 1997, MNRAS, 285, L25
- (15) Brandt, W. N., Fabian, A. C., & Pounds, K. A. 1996, MNRAS, 278, 326
- (16) Christiani, S. & Vio, R. 1990, A&A, 227, 385
- (17) Collin-Souffrin, S., Dyson, J. E., McDowell, J. C., & Perry, J. J. 1988, MNRAS, 232, 539
- (18) Corbin, M. R. & Boroson, T. A. 1996, ApJS, 107, 69
- (19) Crenshaw, D. M. 1995, BASS, No. 187, 24.05
- (20) Czerny, B., & Dumont, A.-M. 1998, A&A, 338, 386
- (21) Czerny, B. & Elvis, M. 1987, ApJ, 321, 305
- (22) Czerny, B., Witt, H. J., & Życki, P. T. 1997, in ESA SP-382, 2nd INTEGRAL Workshop,“The Transparent Universe”, eds. C. Winkler, T. Courvoisier and Ph. Durouchoux, “Luminosity to the Eddington Luminosity Ratio in AGN”, page 397
- (23) Davidson, K., & Netzer, H. 1979, Rev. Mod. Phys. 51, 715
- (24) Elvis, M., Wilkes, B. J., McDowell, J. C., Green, R. F., Bechtold, J., Willner, S. P., Cutri, R., Oey, M, S., & Polomski, E. 1994 ApJS 95, 1
- (25) Ferland, G. F. 1991, “HAZY”, OSU Astronomy Department Internal Report
- (26) Fiore, F., Matt, G., Cappi, M., Elvis M., Leighley, K. M., Nicastro, F., Piro, L., Siemiginowska, A., & Wilkes B. J. 1998, MNRAS, 298, 103
- (27) Fiore, F., Matt, G., & Nicastro, F., 1997, MNRAS, 284, 731
- (28) Fiore, F., Elvis, M., Siemiginowska, A., Wilkes B. J., McDowell J. C., & Mathur, S. 1995, ApJ, 449, 74
- (29) Francis, P. J., Hewett, P. C., Foltz, C. B., Chaffee, F. H., Weymann, R. J., & Morris, S. L. 1991, ApJ, 373, 465
- (30) Gaskell, C. M. 1985, ApJ, 291, 112
- (31) Greiner, J., Danner, R., Bade, N., Richter, G. A., Kroll, P., & Komossa, S. 1996, A&A, 310, 384
- (32) Grupe, D., Beuermann, K., Thomas, H.-C., Mannheim, K., & Fink, H. H., 1998, A&A, 330, 25
- (33) Hayashida, K. 1997, in Peterson, B.M., Cheng, F.-Z., Wilson, A.S., eds, Emission Lines in Active Galaxies: New Methods and Techniques. Astron. Soc. Pac., San Francisco, p.40
- (34) Janiuk, A. & Czerny, B. 1999, MNRAS, submitted
- (35) Korista K., Baldwin, J., Ferland G., & Verner D. 1996, ApJS, 108, 401
- (36) Korista K., et al. 1995, ApJS, 97, 285
- (37) Krolik, J. H., McKee, C. F., Tarter, C. B. 1981, ApJ, 249, 422
- (38) Krolik, J. H. & Kallman, T. R. 1988, ApJ, 324, 714
- (39) Lanzetta, K. M., Turnshek, D.A., & Sandoval, J. 1993, ApJ, 84, 109
- (40) Laor, A., Fiore F., Elvis M., Wilkes B., & McDowell J. C. 1997, ApJ, 477, 93
- (41) Laor, A., Bahcall, J. N., Jannuzi, B. T., Schneider, D. P., & Green, R. F. 1995, ApJS, 99, 1
- (42) Lawrence, A., Elvis, M., Wilkes, B.J., McHardy, I., & Brandt, W. N. 1997, MNRAS, 285, 879
- (43) Lawson, A. J., & Turner, M. J. L. 1997, MNRAS, 288, 920
- (44) Leighly, K. M., Mushotzky, R. F., Nandra, K., & Forster, K. 1997, ApJ 489, 25L
- (45) Mathews, W. G., & Ferland, G. 1987, ApJ, 323, 456
- (46) Mathur, S., Elvis, M., & Singh, K. P. 1995, ApJ, 455, L9
- (47) Mathur, S., Wilkes, B., Elvis, M., & Fiore, F. 1994, ApJ, 434, 493
- (48) Moran, E. C., Halpern, J. P., & Helfand, D. J. 1996, ApJS, 106, 341
- (49) Netzer, H., Brotherton, M. S., Wills, B. J., Han, M., Wills, D., Baldwin, J. A., Ferland, G., & Brown, I. W. A. 1995, ApJ, 448, 27
- (50) Osterbrock, D. E., & Pogge, R. W. 1985, ApJ, 297, 166
- (51) Peterson, B. M., Meyers, K. A., Capriotti, E. R., Foltz, C. B., Wilkes, B. J., & Miller, H. R. 1985, ApJ, 292, 164
- (52) Puchnarewicz, E. M., Mason, K. O., Siemiginowska, A., Pounds, K. A. 1995, MNRAS, 276, 20
- (53) Puchnarewicz, E. M., Mason, K. O., Córdova, F. A., Kartje, J., Branduardi-Raymont, G., Mittaz, J. P. D., Murdin, P. G., & Allington-Smith, J. 1992, MNRAS, 256, 589
- (54) Puchnarewicz, E. M., Mason, K. O., & Córdova, F. A. 1994, MNRAS, 270, 663
- (55) Pounds, K. A., Done, C., & Osborne J. 1995, MNRAS, 277, L5
- (56) Rees, M. J., Netzer, H., & Ferland, G. J. 1989, ApJ, 347, 640
- (57) Remillard, R. A., Grossan, B., Bradt, H. V., et al., 1991, Nature, 350, 589
- (58) Rodrigues-Pascual, P.M., et al. 1997, ApJS, 113, 69
- (59) Sergeev, S. G., Pronik, V. I, Malkov Y. F., & Chuvaev. K. K. 1997, A&A, 320, 405
- (60) Shapiro, S. L., Lightman, A. P., & Eardley, D.M. 1976, ApJ, 204, 187
- (61) Shastri, P., Wilkes, B. J., Elvis, M., & McDowell, J. 1993, ApJ, 410, 29
- (62) Shuder, J. M., & Osterbrock, D. E. 1981, ApJ, 250, 55
- (63) Turnshek, D. A., Kopko, M., Monier E., Noll D., Espey, B. R., & Weymann, R. J. 1996, ApJ, 463, 110
- (64) Ulvestad, J. S., Antonucci, R. R. J., & Goodrich, R. W. 1995, AJ, 109, 81
- (65) Vestergaard M., & Wilkes B. 2000, ApJ, submitted
- (66) Wandel, A. 1997, ApJ, 490, L131
- (67) Wandel, A., & Liang, E.P. 1991, ApJ, 380, 84
- (68) Wandel, A. & Urry, C.M. 1991, ApJ, 367, 78
- (69) Wanders, I. 1997, ApJS, 113, 69
- (70) Wang, T.-G., Lu, Y.-J., Zhou, Y.-Y. 1998, ApJ, 493, 1
- (71) Wang, T.-G., Brinkmann, W., & Bergeron, J. 1996, A&A, 309, 81
- (72) Wilkes B. J. 1998, La Serena conference proceedings “ Quasars as Standard Candles for Cosmology” editor: Ferland, G., PASP conf. proceedings
- (73) Wilkes B. J., Kuraszkiewicz, J. Green, P. J., Mathur, S., & McDowell, J. C. 1999, ApJ, 513, 76
- (74) Wilkes, B. J., Elvis, M., & McHardy, I. 1987, ApJ, L23
- (75) Witt, H. J. Czerny, B., & Życki, P. T. 1997, MNRAS, 286, 848
- (76) Wu C.-C., Boggess, A., & Gull, T. R. 1983, ApJ, 266, 28
| Name | (J2000) | (J2000) | z | |
|---|---|---|---|---|
| 2500Åa | ||||
| IZw1* | 00 53 34.94 | 12 41 36.2 | 0.0611 | 44.89 |
| E 0132411 | 01 34 57.36 | 40 56 22.4 | 0.266 | 45.00 |
| NAB 0205+024 | 02 07 49.86 | 02 42 55.9 | 0.1564 | 45.24 |
| PKS 0558504 | 05 59 47.37 | 50 26 51.8 | 0.137 | 45.31 |
| PG 1211+143* | 12 14 17.60 | +14 03 12.5 | 0.085 | 45.06 |
| IRAS 13349+2438 | 13 37 18.73 | +24 23 03.3 | 0.107 | 45.11 |
| PG 1351+640BAL | 13 53 15.78 | +63 45 44.8 | 0.087 | 44.99 |
| PG 1411+442*BAL | 14 13 48.39 | +44 00 13.6 | 0.090 | 44.96 |
| MRK 478* | 14 42 07.46 | +35 26 22.9 | 0.0781 | 44.85 |
| PG 1444+407* | 14 46 45.95 | +40 35 06.0 | 0.267 | 45.44 |
| IIZw136 | 21 32 27.81 | +10 08 19.5 | 0.061 | 45.04 |
![[Uncaptioned image]](/html/astro-ph/0006340/assets/x8.png)
![[Uncaptioned image]](/html/astro-ph/0006340/assets/x9.png)
| Name | Ly | CIV | MgII | H |
|---|---|---|---|---|
| IZw1* | 1730 | 3190 | 1850 | 1240 |
| 0132411a | 3920 | 2460 | - | 1930 |
| NAB 0205+024 | 1630 | 2520 | - | 1100 |
| PKS 0558504 | 3820 | 3540 | - | 1500 |
| PG 1211+143* | 1600 | 1940 | 1945 | 1900 |
| IRAS 13349+2438b | 7000 | - | - | 2100 |
| PG 1351+640BAL | 2370 | 2110 | 2140 | 860 |
| PG 1411+442*BAL | 1850 | 2300 | 1780 | 2670 |
| MRK 478* | 2810 | 2820 | - | 1370 |
| PG 1444+407* | 3700 | 6180 | - | 2480 |
| IIZW136 | 2130 | 2363 | 1980 | 2060 |
| Mean | 29601611 | 29421237 | 1939133 | 1746577 |
| QSOsc | 53992757 | 47931765 | 55662426 | |
| QSOsd | 51501680 | 45801890 | ||
| QSOse | 34541291 | 43351550 | 37742212 |
| Name | Ref. | Ref. | ||
|---|---|---|---|---|
| IZw1 | 2.00.1 | 1 | 1.30.06 | 7 |
| 0132411 | 3.10.6 | 1 | ||
| NAB 0205+024 | 2.80.5 | 2 | 1.090.10 | 10 |
| PKS 0558504 | 1.90.1 | 3 | 1.260.05 | 3 |
| PG 1211+143 | 2.130.22 | 4 | 1.010.06 | 8 |
| IRAS 13349+2438 | 1.700.33 | 5 | 1.22 | 8 |
| PG 1351+640BAL | 1.530.63 | 4 | ||
| PG 1411+442BAL | 1.970.46 | 4 | ||
| MRK 478 | 2.60.1 | 1 | 0.950.13 | 8 |
| PG 1444+407 | 2.20.3 | 1 | ||
| IIZw136 | 1.25… | 6 | 1.170.07a | 9 |
1 - Boller, Brandt & Fink (1996),
2 - Fiore et al. (1995),
3 - Brandt, private communication,
4 - Wang, Brinkmann & Bergeron (1996),
5 - Brandt, Fabian & Pounds (1996),
6 - Wang, Lu & Zhou (1998) (error on not available),
7 - Hayashida (1997),
8 - Brandt, Mathur & Elvis (1997),
9 - Lawson & Turner (1997),
10 - Fiore et al. (1998)
| Name | |||||
|---|---|---|---|---|---|
| IZw1b | 0.58 | 0.027 | 7.93 | 2.02 | 1.17 |
| 0132411a | 0.27 | 0.30 | 8.29 | 2.52 | 1.05 |
| NAB 0205+024 | 0.27 | 0.30 | 8.45 | 2.50 | 1.04 |
| PKS 0558504b | 0.58 | 0.027 | 8.89 | 1.89 | 1.14 |
| PG 1211+143 | 0.30 | 0.14 | 8.26 | 2.02 | 1.05 |
| IRAS 13349+2438 | 0.58 | 0.03 | 8.12 | 1.99 | 1.15 |
| PG 1351+640BAL,a | 0.27 | 0.03 | 8.20 | 1.51 | 1.11 |
| PG 1411+442BAL,a | 0.58 | 0.027 | 7.96 | 2.00 | 1.17 |
| MRK 478 | 0.27 | 0.3 | 8.12 | 2.53 | 1.07 |
| PG 1444+407a | 0.27 | 0.3 | 8.61 | 2.49 | 1.04 |
| IIZw136 | 0.27 | 0.03 | 8.20 | 1.51 | 1.11 |