The transient X-ray source SAX J2239.3+6116 and its optical counterpart
Abstract
We have discovered with the Wide Field Cameras on board BeppoSAX the weak transient X-ray source SAX J2239.3+6116 whose position coincides with that of 4U 2238+60/3A 2237+608 and is close to that of the fast transient AT 2238+60 and the unidentified EGRET source 3EG 2227+6122. The data suggest that the source exhibits outbursts that last for a few weeks and peak to a flux of erg cm-2 s-1 (2-10 keV) at maximum. During the peak the X-ray spectrum is hard with a photon index of . Follow-up observations with the Narrow-Field Instruments on the same platform revealed a quiescent emission level that is 103 times less. Searches through the data archive of the All-Sky Monitor on RXTE result in the recognition of five outbursts in total from this source during 1996-1999, with a regular interval time of 262 days. Optical observations with the KPNO 2.1 m telescope provide a likely optical counterpart. It is a B0 V to B2 III star with broadened emission lines at an approximate distance of 4.4 kpc. The distance implies a 2-10 keV luminosity in the range from to erg s-1. The evidence suggests that SAX J2239.3+6116 is a Be X-ray binary with an orbital period of 262 days.
Key Words.:
stars: individual: SAX J2239.3+6116, 4U 2238+60, M 2233+595, 3A 2237+608, AT 2238+584, 3EG J2227+61221 Introduction
The Wide Field Cameras (WFCs) on board the BeppoSAX satellite carry out an extensive monitoring program of the whole X-ray sky. Various kinds of transient X-ray sources are detected during these observations on time scales between a fraction of a second and months. We here discuss one case which we have followed up with the more sensitive Narrow-Field Instruments (NFI) on board BeppoSAX and with the Kitt Peak National Observatory (KPNO) 2.1 m optical telescope, and whose signature we searched for in data from the All-Sky Monitor (ASM) on the Rossi X-ray Timing Explorer (RXTE) and in occultation data from the Burst And Transient Source Experiment (BATSE) on the Compton Gamma-Ray Observatory. In all observations we have interesting detections. We describe analyses of WFC (Sect. 2), NFI (Sect. 3), ASM (Sect. 4), BATSE (Sect. 5) and optical data (Sect. 6), point to possible associations of previously found sources of high-energy emission in the field (Sect. 7), and discuss the possible nature of the source (Sect. 8).
2 WFC observations
The WFCs (Jager et al. 1997) on the BeppoSAX satellite (Boella et al. 1997a) carry out a monitoring program where they point at arbitrary positions in the sky. This program is the ’secondary mode’ program whereby the WFC pointings are dictated by those of the Narrow Field Instruments (NFI) on the same satellite and the constraints of the satellite attitude with respect to the direction of the sun. The secondary mode observations entail roughly 90% of all observations.
There are two identical WFCs. They each have square degrees field of views (full width to zero response) with ′ angular resolution. The bandpass is 2 to 26 keV. The WFCs have been active continuously since mid-1996, except for a 1-month period in May 1998 when unit 1 was turned off, and a 3 week period in early 1999 when both cameras were turned off. During mid-May to mid-August 1997, the satellite was in a standby mode, with both cameras turned on but without sufficient stabilization for sensitive imaging.
During 103.4 d on-source time with a net exposure time of 27.8 d, the secondary observations covered the field around the supernova remnant Cas A. This exposure is roughly uniformly distributed in time. The latest data that we report here were obtained on Dec. 15, 1999. Except for Cas A, there are no bright X-ray sources present in this field. Compared to the background levels in the WFCs, Cas A is not so bright. The sensitivity is, therefore, close to optimum in the field. During two instances, a relatively faint transient turned up in the field, at an angular distance of 6.0° from Cas A. They were on March 4, 1997, and May 8, 1999. We note that sometimes Cyg X-2 is in the same field of view as this transient, but at an angular distance of 24.5° which implies it does not degrade the signal of the transient. The celestial position of the WFC-detected transient is 39m22.8s, = +61°16′47″ with a 99% confidence error radius of 18.
The detection in March, 1997, was the strongest WFC detection obtained so far. In Fig. 1, we present a light curve with a resolution of about a day. The period over which we detected activity is about 1 week. The variation in brightness during this event seems to suggest that it was not active for much longer.
A light curve of the second WFC-detected outburst is presented in Fig. 2. The measured peak flux of this outburst is about a factor of 3 lower than that of the first outburst but this could very well be a sampling effect. The source was above the detection threshold for one week but due to an unfavorable sampling it could just as well have been active for 50 days.
We have extracted the spectrum from the observation at the peak of the first outburst and modeled it with a simple power law plus absorption due to interstellar gas of cosmic abundances (according to Morrison & McCammon 1983). We kept the value for the hydrogen column density fixed at cm-2, as found from HI maps (Dickey & Lockman 1990). The fit was satisfactory, with (26 dof). The photon index is quite hard at . The spectrum is shown in Fig. 3. The 2-10 keV flux is erg cm-2 s-1 which is 0.016 times the flux of the Crab in the same bandpass. In the energy range 2 to 26 keV the flux is erg cm-2 s-1 or 0.033 times that of the Crab.
In Fig. 4, we present a light curve with a relatively high time resolution when the flux was at maximum during the first outburst. The source appears to be variable but no coherent signal could be found in this data set. The 90%-confidence upper limit on the amplitude of a periodic sinusoidal variation is 10% for periods between 1 and 103 s.
We have analyzed WFC data taken on December 13-15, 1999. This is 2 weeks after the optical measurements described in Sect. 6. No X-ray detection was found. The upper limit on the X-ray flux is 6 erg cm-2 s-1 (2-10 keV).


3 NFI observations
Observations were made with the NFI on Nov. 24.46-25.04 (UT), 1998, which is 627 d after the first and 165 d before the second WFC detection. The NFI include the low-energy concentrator/spectrometer (LECS; 0.1-10 keV; Parmar et al. 1997), the medium-energy concentrator/spectrometer (MECS; 1.8-10 keV; Boella et al. 1997b), the high-pressure gas scintillator proportional counter (HP-GSPC; 4-120 keV; Manzo et al. 1997), and the phoswich detector system (PDS; 15-200 keV, Frontera et al. 1997). The first two instruments are imaging devices. The effective exposure times on SAX J2239.3+6116 are 11.9 ks (LECS), 20.1 ks (MECS) and 10.0 ks (PDS). The HP-GSPC was turned off for operational reasons.
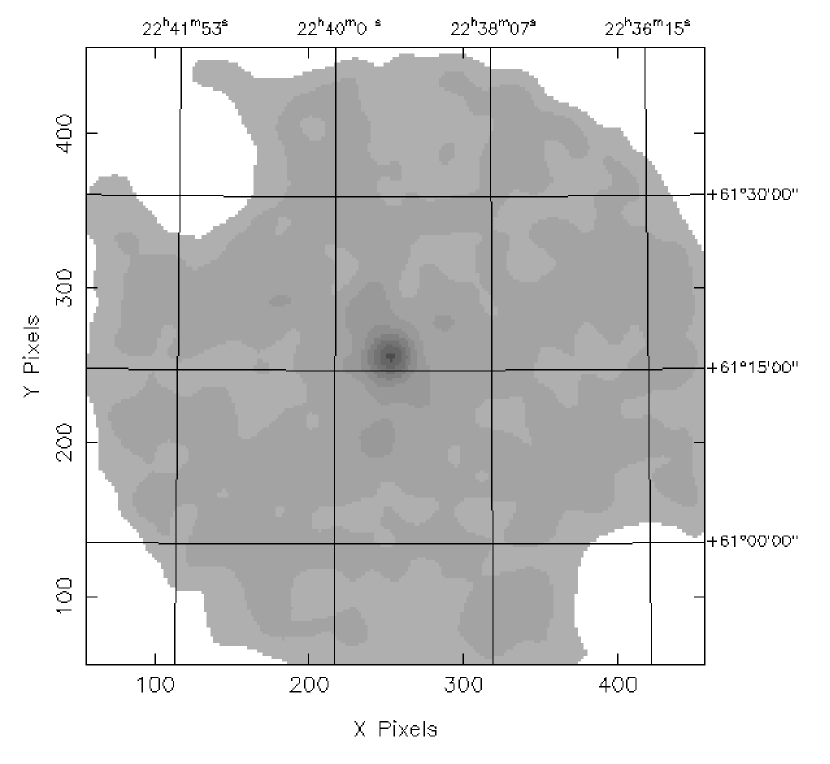
Only the MECS data show a detection of SAX J2239.3+6116 in an otherwise empty field of view (see Fig. 5). The position of the source is = 22h39m18.5s, = +61°16′20″ with a 90% confidence error radius of 10. This is 07 from the WFC centroid position and the two positions are fully consistent (see Fig. 9). The chance probability of a background point source with a flux in excess of erg cm-2 s-1 in the WFC error region is 0.3% (based on the counts by Giommi et al. 1999). We reduced the spectrum of the point source from the MECS data through application of the maximum likelihood method (e.g., In ’t Zand et al. 2000) and tried to model it with absorbed single-component models like a power-law function and thermal bremsstrahlung, while fixing to 1 cm-2. Only black-body radiation gave a satisfactory fit to the data of a single-component model, with for 7 dof. The color temperature is keV and the emission area at 4.4 kpc (see Sect. 6) for isotropic emission is equal that of a sphere with a radius of km. The 2-10 keV flux is erg cm-2 s-1 which is times fainter than the peak flux of the March 1997 outburst.
4 ASM observations

Given the NFI position, we have searched for signatures of SAX J2239.3+6116 in archival ASM data. The ASM is fully operational since March 1996 and monitors each position on the sky in 2 to 12 keV during 90 sec snapshots with a frequency of 5 to 10 times a day at a sensitivity of mCrab per day of observervations on uncrowded fields (Levine et al. 1996). The lightcurve for SAX J2239.3+6116 at 4-day resolution is presented in Fig. 6a. There is the suggestion for a detection during 5 instances, at regular interval times of about 262 d. We tested this periodicity by first filtering out the data within 10 d of closest aproaches to the Sun and all data after MJD 51450 because there does not appear to be an outburst there, and then calculating the variance statistic as defined by Stellingwerf (1978) for a range of test periods, see Fig. 6b. The resulting period is d. The epoch for peak flux is MJD 50786. The predicted times of outbursts are indicated in again Fig. 6a. Only the last predicted outburst does not appear to have materialized. The two WFC detections synchronize with the 2nd and 5th outburst. A folded light curve (Fig. 6c) shows an average outburst profile which lasts 15 days. The average peak flux is 4 mCrab.
5 BATSE observations


Due to the hardness of the spectrum measured with the WFC a search of the BATSE data was made to see if SAX J2239.3+6116 was detectable in the hard x-rays. The BATSE experiment onboard the Compton Gamma-Ray Observatory (Fishman et al. 1989) using the Large Area Detectors (LADs) can monitor the whole sky almost continuously in the energy range of 20 keV to 2 MeV with a typical daily 3 sensitivity of better than 100 mCrab. Detector counting rates with 16 energy channel energy resolution and a timing resolution of 2.048 seconds (CONT data) are used for our data analysis.
To produce the SAX J2239.3+6116 light curve, single step occultation data were taken using a standard Earth occultation analysis technique used for monitoring hard X-ray sources (Harmon et al. 1992). Interference from known bright sources was removed. The single occultation step data were then fit with a power law with a -2.0 photon index to determine daily flux measurements in the 20-100 keV band. A time period of 30 days centered on each outburst was examined for emission. Various time averages of the data were performed to search for a possible signal in the data.
During the time of the March 1997 outburst we find evidence of a weak two day outburst in the BATSE data (see Fig. 7). The 20-100 flux for highest daily average corresponds to 0.080 times that of the Crab in the same bandpass. It appears that there is a 3 day delay between the peak in the BATSE data and that detected in the WFC. For any of the other outbursts predicted throughout the BATSE operational period we do not find evidence for hard x-ray emission, but we can not rule out the presence of a source with a flux 0.050 times that of the Crab or less being present in the data.
We have extracted spectra from the BATSE data for the March 1997 outburst. During this time period the source was measured in three detectors. Spectra and responses for each detector were created and a joint fit was made with a simple power law. The fit was satisfactory, with a reduced chi-squared = 0.90 (40 dof). The photon index is . In Fig. 8 is plot the spectrum in which the three data sets have been grouped for plotting purposes. The 20-100 keV flux is erg cm-2 s-1 which is 0.080 times that of the Crab in the same bandpass. Very little flux is detected above 100 keV.
6 Optical observations
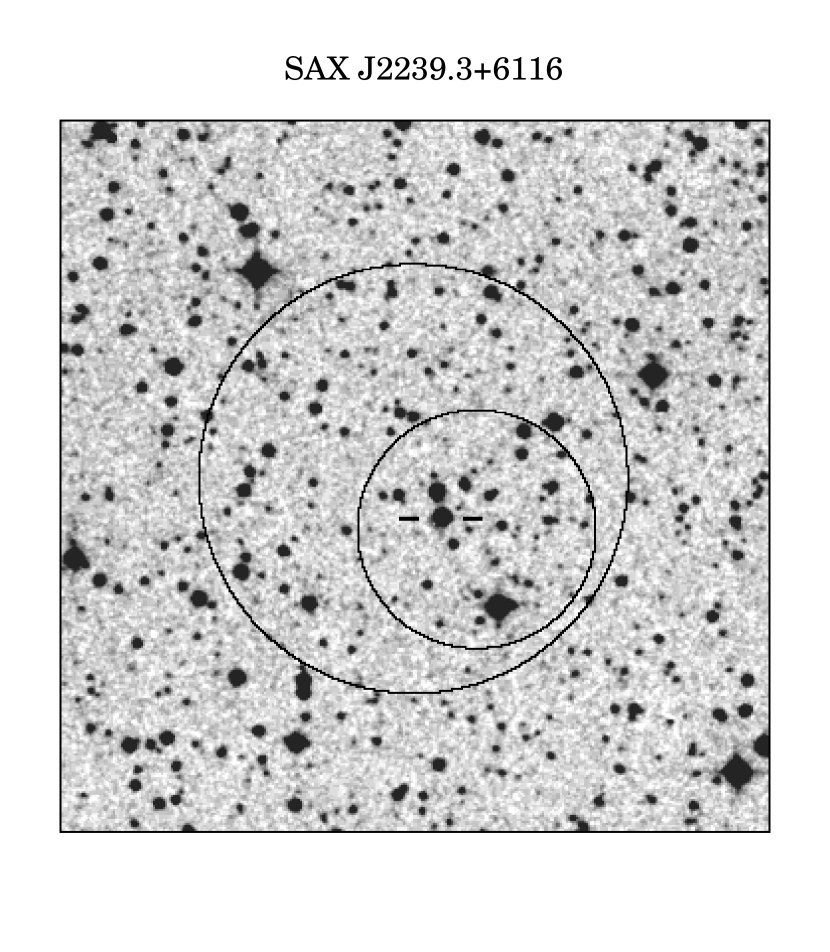

We looked for the optical counterpart of SAX J2239.3+6116 by obtaining spectra of the three brightest stars in the NFI error circle on 1999 Dec. 2 and 3 UT, using the KPNO 2.1 m telescope and Goldcam spectrograph. The date is 50 d before a predicted outburst (the last indicated in Fig. 6a). The spectra covered the wavelength range 3900–7500 Å at 5 Å resolution. The second brightest star within the error circle (Fig. 9) is the only one that has broad emission lines and other spectral features that are characteristic of a reddened Be star. Be stars are often hard X-ray sources because of emission from an unseen compact companion such as a neutron star. On this basis we identify the Be star with SAX J2239.3+6116. This star is listed in the USNO–A2.0 catalog (Monet et al. 1996, Monet 1998), at a position , (uncertainty ), which is from the NFI centroid and well within the error circle. The USNO–A2.0 catalog gives approximate magnitudes of and .
The summed spectrum from 3000 s of exposure is shown in Fig. 10. We measure approximate magnitudes , , and from the spectrum. The estimated uncertainty in these numbers is 0.2 mag. The magnitudes are consistent with the USNO magnitudes. The H emission line has an equivalent width (EW) of 6.7 Å, a flux of ergs cm-2 s-1, and a full-width at half maximum (FWHM) of 400 km s-1 after correcting for the instrumental resolution. Emission lines of He I 5876, He I 6678, and He I 7064 appear to be double-peaked, with the peaks separated by 300 km s-1. Double-peaked emission lines are commonly seen in Be star spectra, where they are attributed to a circumstellar disk.
The reddening to the star may be estimated from many diffuse interstellar band (DIBs) that are apparent in the spectrum (Fig. 10). We measure equivalent widths of EW = 3.4 Å, 3.2 Å, and 2.3 Å for 4430, Na I D, and the 5780,5797 blend, respectively. From the calibrations of Herbig (1975) and Tüg & Schmidt-Kaler (1981) we estimate . This is less than the value for the total Galactic extinction as derived from the hydrogen column density measurements through HI maps (Dickey & Lockman 1995). The integrated H I column density is cm-2 in this direction. From the standard conversions cm-2 mag-1 (Predehl & Schmitt 1995) and , one obtains . Also, the reddening is less than determined from IRAS m dust maps (Schlegel et al. 1998) which give .
Assuming that , the dereddened magnitudes from the spectrum become , and . Since these are somewhat redder than the colors of an early B star, we suspect that there may be some additional circumstellar extinction, and that dereddened is a realistic estimate. Also, if we assume an average mag kpc-1, then the distance to SAX J2239.3+6116 can be estimated as 4.4 kpc. The absolute visual magnitude would then be –3.5, as expected for a star in the range B0 V to B2 III.
In a 16 square-degree area around the NFI position, there are 3 cataloged Be stars brighter than . None of these are coincident with the NFI error box.
7 Association with other sources of high-energy emission

In Fig. 11, the WFC- and MECS-determined positions of SAX J2239.3+6116 are shown, as well as those of three other possibly related X-ray sources. It appears likely that SAX J2239.3+6116 is the same source as the one seen in the early seventies with Uhuru (4U 2238+60, Forman et al. 1978), OSO-7 (1M 2233+595, Markert et al. 1979), and Ariel-V (3A 2237+608, Warwick et al. 1981). 4U 2238+60 was detected at a level of erg cm-2 s-1 (2-10 keV, statistical error only) which is about 4 times lower than the peak of the March 1997 outburst. This is not really surprising because neither measurement encompassed the whole outburst. The Ariel source (Warwick et al. 1981) is classified as an irregular variable source during the 1974-1980 operational period with a measured peak flux of erg cm-2 s-1 (2-10 keV) which is also of the same order of magnitude as SAX J2239.3+6116 and 4U 2238+60.
There are two other interesting sources which have error boxes that are close to that of SAX J2239.3+6116 but are formally inconsistent. The first one is the fast transient AT 2238+584 which was seen in July 1975 with the sky-survey instrument on Ariel V (Pye & McHardy 1983). The outburst was not covered completely. The maximum measured flux was erg cm-2 s-1 (2-10 keV) which is 5 times as bright as for SAX J2239.3+6116. The e-folding decay time of AT 2238+584 was 0.78 d. The other inconsistent source is 3EG J2227+6122 which is one of the unidentified EGRET sources (Hartman et al. 1999). We mention this because SAX J2239.3+6116 is the bright X-ray source closest to 3EG J2227+6122 and because SAX J2239.3+6116 has quite a hard spectrum in the X-ray range. Nevertheless, the distance between the centroids of both sources is 87′ while the 95% confidence error region of 3EG J2227+6122 is three times smaller (28′).
8 Discussion
SAX J2239.3+6116 is an X-ray transient which often recurs with a periodicity of 262 d. Because of the Be-star nature of the likely optical counterpart, the periodicity may be identified with the orbital period of the binary. In such a Be X-ray binary system, the transient nature of the X-rays is thought to arise from a combination of episodic mass loss by the Be star, and an eccentric binary orbit. The compact object orbiting the Be star will show enhanced X-ray emission near periastron where it accretes more matter due to an enhanced wind density (e.g., review by White et al. 1995). The 2-10 keV flux history shows fluctuations of a factor of 103. Possibly the true dynamic range is larger. The likely counterpart at an estimated distance of 4.4 kpc implies that the 2-10 keV luminosity ranged between 1 erg s-1 and erg s-1. It seems plausible that SAX J2239.3+6116 was more or less active over the last decades. The peak flux is so low that it can easily be missed. The spectral type of the counterpart, the resulting luminosity and the transient behavior is consistent with the identification of SAX J2239.3+6116 as a Be X-ray binary. This is also confirmed by the value for the X-ray to optical color index (as defined by Van Paradijs & McClintock 1995) where is the dereddened magnitude and the 2-10 keV X-ray flux. For and Jy (during quiescence) . If would be 9.7 (to correct for additional circumstellar extinction) then . These are perfectly normal values for Be X-ray binaries in quiescence and three times lower than for low-mass X-ray binaries.
Usually Be X-ray binaries contain an X-ray pulsar (e.g., review by White et al. 1995). SAX J2239.3+6116 does not appear to contain one with a period shorter than 103 sec, with a fairly sensitive upper limit of 10% on the amplitude. This may be explained by the fact that the pulse period is longer than 103 sec. Corbet (1984) discovered a strong correlation between orbital and pulse period for Be X-ray binaries. If SAX J2239.3+6116 adheres to this correlation, the orbital period of 262 d implies a pulse period near to 103 sec. More dedicated sensitive X-ray observations during future outbursts are obviously needed to study this system in more detail.
Acknowledgements.
We are grateful to the staff of the BeppoSAX Science Data Center for processing the vast amounts of raw data from WFC secondary mode observations which were the basis for the study presented in this paper, and thank Lucien Kuiper for help in analyzing the MECS data with the maximum likelihood method. BeppoSAX is a joint Italian and Dutch program.References
- Boella et al. (1997a) Boella G., Butler R.C., Perola G.C., et al., 1997a, A&AS 122, 299
- Boella et al. (1997b) Boella G., Chiappetti L., Conti G., et al., 1997b, A&AS 122, 327
- Corbet (1984) Corbet, R.H.D., 1984, A&A 141, 91
- Dickey & Lockman (1990) Dickey J.M., Lockman F.J., 1990, ARA&A, 28, 215
- Fishman et al. (1989) Fishman G.J., et al., 1989, in Proc. Gamma-Ray Observatory Science Workshop, ed. N. Johnson (Greenbelt: Goddard Space Flight Center), 2-39
- Forman et al. (1978) Forman W., Jones L., Cominsky C., et al., 1978, ApJS 38, 357
- Frontera et al. (1997) Frontera F., Costa E., Dal Fiume D., et al., 1997, A&AS 122, 357
- Giommi et al. (1999) Giommi P., Fiore F., Perri M., 1999, Astrophys. Lett. Comm. 39, 173
- Harmon et al. (1992) Harmon B.A., Finger M.H., Rubin B., et al., 1992, in Proc. Compton Observatory Science Workshop, eds. C.R. Shrader, N. Gehrels and B. Dennis (Washington: NASA), 69
- Hartman et al. (1999) Hartman R.C., Bertsch D.L., Bloom S.D., et al., 1999, ApJSS 123, 79
- Herbig (1975) Herbig G., 1975, ApJ 196, 129
- In ’t Zand (2000) In ’t Zand, J.J.M., Kuiper, L.M., Amati, L., et al., 2000, ApJ, submitted
- Jager et al. (1997) Jager R., Mels W.A., Brinkman A.C., et al., 1997, A&AS 125, 557
- Levine (1996) Levine, A.M., Bradt, H., Cui, W., et al., 1996, ApJ 469, L33
- Manzo (1997) Manzo G., Giarusso S., Santangelo A., et al., 1997, A&AS 122, 341
- Markert et al. (1978) Markert T.H., Winkler P.F., Laird F.N., et al., 1979, ApJS 39, 573
- Monet et al. (1996) Monet D., Bird A., Canzian B., et al., 1996, USNO–A1.0 (US Naval Observatory, Washington DC)
- Monet et al. (1998) Monet D.G., 1998, BAAS 30, Vol.4, 120.03
- Morrison (1983) Morrison R., McCammon D., 1983, ApJ 270, 119
- Parmar (1997) Parmar A.N., Martins D.D.E., Bavdaz M., et al., 1997, A&AS 122, 309
- Pye & McHardy (1983) Pye J.P., McHardy I.M., 1983, MNRAS 205, 875P
- Predehl & Schmitt (1995) Predehl P., Schmitt J.H.M.M., 1995, A&A 293, 889
- Schlegel et al. (1998) Schlegel D. J., Finkbeiner D. P., Davis M., 1998, ApJ 500, 525
- Tüg et al. (1981) Tüg H., Schmidt-Kaler Th., 1981, A&A 94, 16
- Van Paradijs et al. (1995) Van Paradijs J., McClintock J.E., 1995, in “X-ray binaries”, eds. W.H.G. Lewin, J. van Paradijs and E.P.J. van den Heuvel, CUP, 58
- Warwick et al. (1981) Warwick R.S., Marshall N., Fraser G.W., et al., 1981, MNRAS 197, 865
- White et al. (1995) White N.E., F. Nagase, Parmar A.N., 1995, in “X-ray binaries”, eds. W.H.G. Lewin, J. van Paradijs and E.P.J. van den Heuvel, CUP, 1